





I. INTRODUCTION
The sleep process is a complex process of dynamic changes. According to R&K, the international standard for the interpretation of sleep stages, there are different states during sleep.
In addition to the awake period, the sleep cycle consists of two alternate sleep states, namely rapid eye movement(REM), and non-REM.
In non-REM, according to the gradual change of sleep state from shallow to deep, it is further divided into sleep, I, II, III, and sleep IV. Sleep stage III and sleep stage IV can be combined with a deep sleep stage.
Figure 1 shows the time series of EEG signals corresponding to different sleep stages, from top to bottom, namely, wakefulness, sleep I, sleep II, deep sleep and REM.
Figure 1 shows the characteristics of EEG signals vary in different sleep stages during the epidemic of Coronavirus Disease.





Automatic staging based on EEG signals can reduce the artificial burden on expert physicians and it is a useful auxiliary tool for assessing sleep quality, diagnosing and treating sleep-related diseases. In this paper, Python is used to build a neural network, and design a sleep staging prediction model. Based on as few training samples as possible, it can obtain relatively high prediction accuracy.
II. OVERVIEW OF BP NEURAL NETWORK
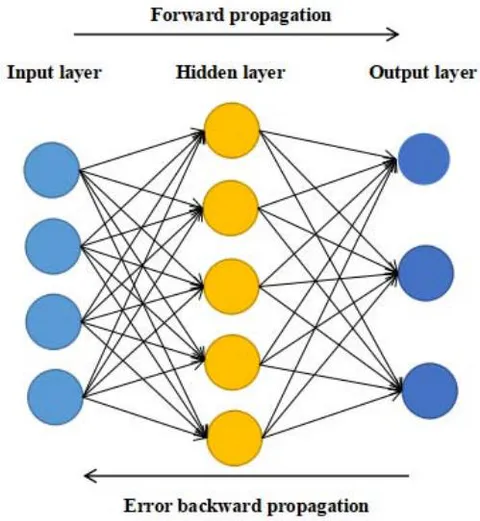
An artificial neural network gets widely used in some aspects, including pattern recognition, function approximation, data compression, data classification, data prediction, etc. BP neural the network is an algorithm in ANN. Figure 2 shows the basic structure of the BP neural network.
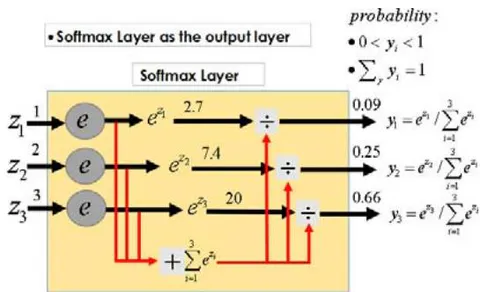
Softmax function:
Figure 3 shows the operating principle.
Adam algorithm:
Initialize 1st, 2st moment vector and time step do while:
Computing the gradient.
Update biased first moment estimate.
Upgrade biased second moment estimate.
Compute bias-corrected first moment estimate.
Compute bias-corrected second draw moment estimate.
Upgrade parameters.
Where is the step length, , is the moment estimation of the exponential decay rate, and is the random objective function of the parameter .
In this paper, the whole training process of the improved BP neural network model is:
Step 1: Parameter initialization. Determine the node number of the network input layer, hidden layer and output layer, and initialize the weight, bias between each layer, then initialize learning rate.
Step 2: Calculate the output of the hidden layer. The hidden layer output is calculated by the weight and bias between the input vector and the connection layer and the ReLU activation function.
Step 3: Calculate the output of the output layer. through the hidden layer output and connection weights and bias and the Softmax activation function calculate the predicted output.
Step 4: Calculate Softmax cross-entropy as cost function according to predicted output and real label.
Step 5: Back propagation, and this paper use the adaptive learning rate Adam algorithm to update the weight and bias.
Step 6: Determine whether the cost reaches the error range or the number of iterations. If not, return step 2.
III. DATA DESCRIPTION AND PREPROCESSING
Data were collected from 3000 sleep EEG samples and their labels are taken from different healthy adults during overnight sleep. The first is a "known label," which represents the different sleep stages in digital form: stage wake (6), rapid eye movement (5), sleep I (4), sleep II (3), and deep sleep (2); The second to fifth columns are the characteristic parameters calculated from the original time sequence, successively including "Alpha", "Beta", "Theta" and "Delta", which correspond to the energy proportion of EEG signals in the frequency range of "8-13Hz", "14-25Hz", "4-7Hz" and "0.5-4Hz" respectively. The unit of characteristic parameters is the percentage.
This paper gives raw data stage wake (6), and REM. (5), sleep I (4), sleep II (3), deep sleep (2), four brain electrical signal energy proportion of five sleep stages of brain electrical signal energy proportion, but the original data are generally given there are some abnormal data outliers or missing value, therefore we to each index of the five sets of data make a boxplot graph, the result is as follows in figure 4.
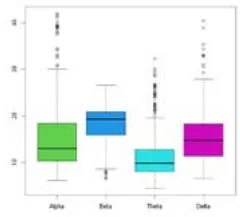
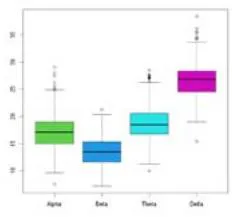
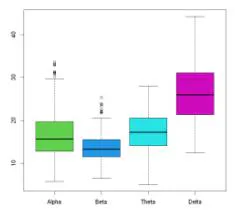
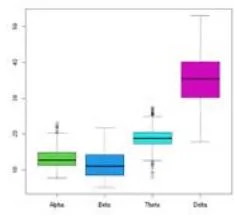
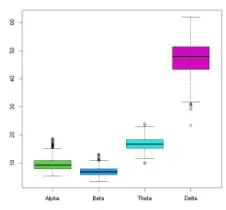
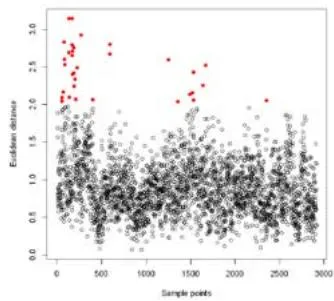
Five sleep period by Figure 4 shows, there are some outliers, namely, these all belong to the original data of abnormal points, this paper uses the principle of 3 sigmas will each table of data deletion, then after the processing of five tables to merge, and then using the K-means clustering + Euclidean distance outlier test , to find and remove outliers, as shown in figure 5, a total of 2883 samples after pretreatment.
IV. MODEL TRAINING AND PREDICTION
We divided the data into a training set and test set in a ratio of 2:8. We trained and tested the data using the traditional decision tree model (DT) and support vector machine model (SVM), and compared the classification effect with the accuracy rate and AUC value as evaluation indexes. The results are as follows:
| Classifier | Accuracy rate |
| DT | 0.59 |
| SVM | 0.68 |
| Adam-BPNNet | 0.73 |
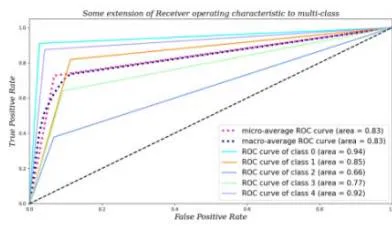
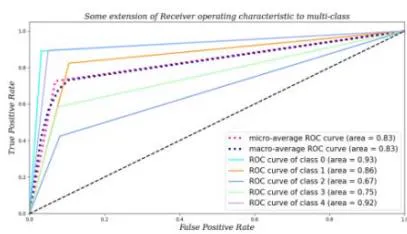
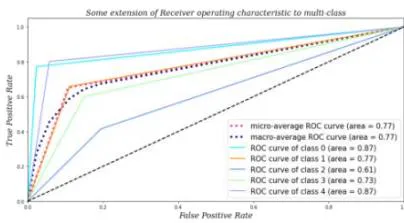
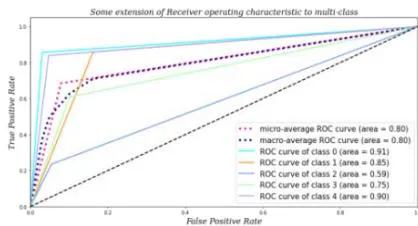
Classifier AUC DT 0.77 SVM 0.80 Adam-Bennett 0.83
Table 2 shows that in the Adam-BPNNet model, fewer training sets will still have a better classification effect.
The prediction result is the best classification effect obtained after many experiments. In the early stage of experiment, the classification accuracy is low. After repeated debugging of the number of hidden layers and nodes, the best AUC value of this experiment is 0.83.
V. CONCLUSION
This study is mainly based on theoretical research and combines theory with practice. This paper uses BP neural network based on an adaptive learning rate Adam algorithm for data classification. Also, this paper selects Softmax as the activation function in the output layer, enabling the model to have good self-learning and self-adaptive ability. The most important thing is that the network has good generalization ability. When designing the classifier, it should consider whether the network can correctly classify the objects it needs to classify, and whether the network can correctly classify the unseen or noise-polluted patterns after training. The classification AUC value of this study is 0.83, which is scientific to a certain extent and can be used as auxiliary tool for the evaluation of sleep quality, diagnosis and treatment of sleep-related diseases.
Conflict of Interest
We have no conflict of interests to disclose and the manuscript has been read and approved by all named authors.
ACKNOWLEDGEMENT
This work was supported by the Philosophical and Social Sciences Research Project of Hubei Education Department (19Y049), and the Staring Research Foundation for the Ph.D. of Hubei University of Technology (BSQD2019054), Hubei Province, China.


