I. INTRODUCTION
Grocery stores are stores that involves in the primary sales of general range of food products and daily needs. [1]Identified Cereals, Toothpaste, Beer, Butter, Cake Mix, Chips, Cookies, Facial Tissues, Laundry Detergent, Loaf Bread, Toilet paper and Coffee to be the twelve categories of products in a grocery store. These categories are selected for purchases based on certain parameter, which include price, always buy, satisfaction, recommendation, brand name, shelf space. Retailers regularly are faced with the challenges of allocating products to shelves due to shelf space being a scarce resource in retail stores and needs to increase the no of products to be included in the assortment [2].Product shelving allocates products in the shelves in an optimized way that will maximize sales and profit. According to [3].Products shelving tremendously affect consumer buying behaviors. Efficient allocation of product on shelves curtail the economic threats of unfilled product shelves, improves consumer satisfaction, healthier consumer relationship [4], and improve product sales [5].
Product shelving is a modern-day marketing strategy for products to get to end users without using overt traditional advertising. Product placement is becoming an increasingly important way for brands to reach their target audience in subtle ways. Businesses are exploiting product shelving to enhance brand awareness, increase sales and draw in customers without traditional marketing, Shelf shelving strategies are the various methods of arrangement of products on the shelves to induce impulse purchases and thereby increase sales and profit margin of the retailers. An ingenious display of product on shelf will increase customer's purchase decision, which habitually influenced in-store factors [6]. The way customer's picks items to purchase on shelves are based on certain behavioral patterns and factors. Analytic of the past consumer purchasing behavior's record using Machine Learning (ML) algorithms will enhance the store's overall profitability[7].
ML is an aspect of artificial intelligence that learns with the aids of algorithm from data to obtain knowledge or pattern from it to make decision without human intervention. ML automate the process of data analytical for model building. ML's goal is to make an excellent guess useful to the predictive (classification) problem[8]. Supervised ML algorithms extract valuable knowledge from the mapping of supplied inputs and its desired output (class label) of the training dataset, then validates the testing dataset's obtained knowledge. Regression and classification are examples of supervised ML techniques. Unsupervised learning draws knowledge from a dataset consisting of input data without label responses. It partitions the dataset into clusters based on similarities that exists among the dataset. It validates by assigning a new test instance into the appropriate cluster; clustering analysis and association rule mining are examples of unsupervised learning methods.
Association Rule Mining (ARM) is rule-based ML algorithm for the discovering of interesting relationship among entities of a transactional dataset, ARM aim to identify patterns (combinations of events that occurred together) of entities in a transaction that frequently appear together among the whole transaction dataset. It generate rules that summarizes these patterns and use the generated rules to predict presence of one or more products based on the occurrences of some products in a new transaction. Products that are capable to influence the presence of other products in transaction are predicted to be placed together on the shelved with the aim to create impulse purchases. Grocery store generates lot of data on daily basic from customer's transactions, this dataset contains hidden knowledge and patterns that can be used to make important business intelligent decision, unlocking this knowledge and patterns remains a mirage to several grocery stores, provision of a framework for discovering latent pattern or knowledge from transactional dataset will help grocery store's owners to make important business decision that will make them competitive and maximized their profit margin. This work presents an Association Rule Mining framework for mining previous transactions of consumers' buying patterns for the optimal prediction of products placement on the shelves, physical shelf arrangement and identification of products that needs promotion
II. REVIEW OF RELATED LITERATURE
Several authors have applied Association Rule Mining algorithms to provide solution to different problems; Olasehinde et.al. (2018), applied ARM to mine customers buying behavior to improve customers relationship management, results from the research suggest products that should be shelved close to each other, products that needs promotion and products that promotion will not improve it sales [9].
[10] applied ARM to extract knowledge from the Market Basket Analysis (MBA) to predicts products that will be bought together and hence be placed close to each other on the shelf to induce and increase impulse buying. Serban et.al (11). proposed the application of relational ARM to predict the probability of certain diseases and predicts likely therapy [11]. Gupta et al. adopted ARM to determine the relationship among sequence of protein [12]. The research in [13] applied ARM to the analysis of huge supermarket data exploiting the customer behavior to make market competitive decision. Liuet. al. (2007) applied ARM to generate important rules to extract strategic Business Intelligence (BI) from the mining of organization transaction. The experimenter results from the application of ARM to records of business transactions and customer's data analysis shows interesting patterns for customer's satisfaction and improvement of quality of service and profit [14]. [15] applied ARM to determine probability of purchases in online stores, result from this work shows that customers that have spent 10 to 25 minutes in an online book store and has opened thirty to seventy pages has a probability of to confirm a purchase. The work in [16] applied ARM to the historic customer's transaction data from a grocery store to segment customers for targeted marketing.[17] conducted a research on Market Basket Analysis, Apriori Algorithm was used to discover frequent item sets among products stored in a large database, rules generated from this work were used to cluster customers based on their buying patterns and further subjected to selective marketing
III. ASSOCIATION RULE MINING
Association mining concerns the discernment of rules that cut across good percentage of dataset [18]. Given a set of transactions, T, the goal of ARM is to find all rules that predicts products to be placed closer to each other on the shelf and products that needs promotion.ARM involves two stages; in the first stage, frequent item set from the transaction dataset are generated that satisfied the predefined minimum support level. The second stage involves the generation of association rules that satisfied the minimum user's defined confidence rate among the frequent item-sets. Item-sets are one or more products in each record of the transaction dataset. A frequent itemset is a pattern that occurred frequently than a predefined threshold [19],frequent itemset is products combinations that satisfied the user's predefined minimum support. All subsets of a frequent itemsets are also frequent itemsets, while subsets of infrequent itemsets are infrequent item-sets. ARM is defined as follow:
Beset of n binary attributes called products.
be set of all possible transactions D.
where each transaction is a set of products such that
Each transaction in D has a unique transaction ID and contains a subset of the products in P. A rule is defined as an implication of the form interpreted as X implies Y.
To select interesting rules for optimal products placement strategy, Support and confidence constrains are applied to all the generated rules from the transaction dataset.
The support often expressed as a percentage of total number of transactions in the dataset is basically the number of transactions that include all items in the antecedent and consequent parts of the rule . The support of item-set containing products X and Y , written as supp(X Y) is the ratio of number of transactions that contains item-set X and Y to the total number of transaction in the dataset as shown in equation 4. Support of 0.75 for item-set X implies that 75% of the whole transactions in dataset contains item-set X. Itemsets that satisfied the minimum support threshold are considered to be frequent.
\begin{array}{c} \text{supp} (\mathrm{X} \Rightarrow \mathrm{Y}) = \\\frac{\text{No of transactions that contains itemset (X\cup Y)}}{\text{Total No of transactions in the dataset}} \end{array}\tag{4}The confidence of a frequent itemset (rule) is the percentage of all transactions that contain all products in both the consequent and the antecedent of the rule to the number of transactions that contain products in the antecedent [20]. The confidence of a frequent itemset (rule) is a conditional probability that will occurs whenever occurred [22], it is the ratio of the support of to support of given in equation 5. The implication of the confidence of a rule to be 0.90 implies that, 90% of customers that buys also buys .
IV. PROPOSED FRAMEWORK FOR ASSOCIATION RULES PRODUCTS SHELVING STRATEGY
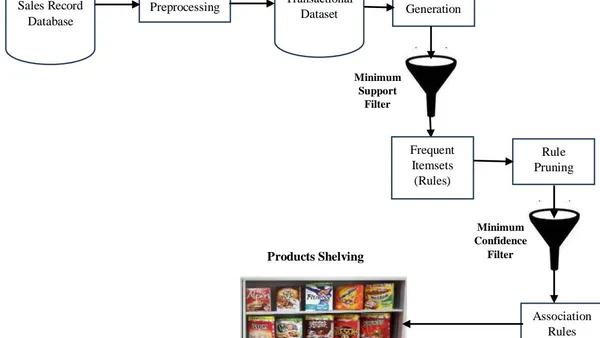
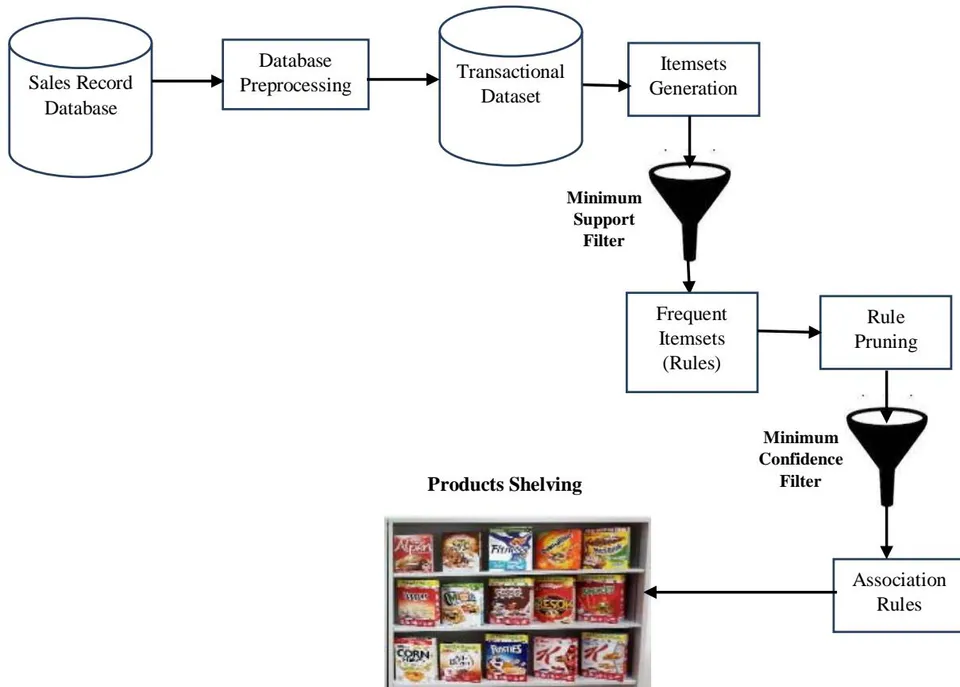
The proposed framework for the products placement (shelving) strategy is based on horizontal dataset layout, basically the framework consists of the following major components as shown in Figure 1
V. SALES RECORD DATASET
Availability and quality of data is the bedrock of successful database modeling project, availability involves existence of relevant and suitable quantity of data while quality of data involves the fitness of data for the purpose to which it is intended for. High quality data are free of redundancy, defects and possess desired features fit for the modeling purpose. Grocery stores generate and store large amount of data on daily basis, extraction of sensitive information implicitly contained in data will provide a lot direct benefits to the store. In order to obtain desire results of great benefits to the store from the store data, the data must be large enough to represent all the possible patterns of events in the store, a transaction data of 6to 24 months is recommended in order to provide good and effective decision that will benefit the grocery store [23]. Sales record contains many items such as transaction ID, customer's name, customer's ID, Product(s) bought, quantity bought, data and time of sales, unit price, product(s) code, Receipt number, product description.
VI. SALES RECORD DATABASE PREPROCESSING
All the constitutes of the sales record are not relevant for the modeling of the products placement strategy, there is need to select the relevant constitute and represent them appropriately for ARM algorithms to be able to model them. Data preprocessing is critical to a successful data modeling process, presence of missing data, noise and irrelevant attributes will degrade the quality of the modeling results. For products placement strategy, transaction ID and the list of products in the transaction are the two relevant attributes, Table 2 shows a sampled preprocessed of a sales record containing five transactions depicted in Table 1, each row of the sales record represent a transaction, and each column represent a product (an item). Present of an item in the every transaction is represented with 1's while 0's implies absence of a product
| Transaction ID | Transaction Details |
| T1 | {Bread, Egg} |
| T2 | {Milk, Bread, Egg} |
| T3 | {Bread, Butter, Egg} |
| T4 | {Bread, Butter} |
| T5 | {Milk, Bread, Butter, Egg} |
| Transaction ID | Milk | Bread | Butter | Egg |
| 1 | 0 | 1 | 0 | 1 |
| 2 | 1 | 1 | 0 | 1 |
| 3 | 0 | 1 | 1 | 1 |
| 4 | 0 | 1 | 1 | 0 |
| 5 | 1 | 1 | 1 | 1 |
VII. ITEMSET MINING
Itemsets are one or more than one products bought together by customers and recorded in the transaction dataset, Itemset mining, the process of determining itemsets in the transaction dataset was first introduced by in 1993, and it is nowadays called Frequent Itemset Mining (FIM). Frequent itemsets are pattern that transpired repeatedly than the predefined verge denoted as , where K is the no of elements in the itemset. FIM mines group of items regularly bought together from the dataset. Any itemset X with its frequency of occurrences in the transaction dataset is more than the user predefined verge known as minimum support threshold (i.e. sup(X) minsup) is called frequent itemset. A transaction dataset with n distinct items (products), there will be possible itemsets.
The five transactions represented in Table 1 has four distinct items; {Milk, Bread, Butter,and Egg} with possible itemsets itemsets. The fifteen itemsets from Table 1 with their support are;{Bread}:
1.0, it appeared in all the five transactions in the dataset, it support is 5/5 = 1.0, {Egg}: 0.8, {Milk}: 0.4, {Butter}: 0.6. {Milk and Bread}: 0.4, {Milk and Butter}: 0.2, {Milk and Egg}: 0.4, {Butter and Egg}: 0.4, {Bread and Egg}: 0.8, {Bread and Butter}: 0.6, {Milk, Bread and Butter}: 0.2, {Milk, Bread and Egg}: 0.4, {Bread, Butter and Egg}: 0.4, {Milk, Butter and Egg}: 0.2, {Milk, Bread, Butter and Egg}: 0.2.
Given a user defined minimum support of 0.5, itemsets that has it support equals or greater than 0.5 will be filtered as the frequent itemsets, from Table 1, the itemsets that meet the minimum support threshold (0.5) set by the user are: {Bread}:1.0, {Egg}: 0.8, {Butter}: 0.6. {Bread and Egg}:0.8, {Bread and Butter}:0.6. Considering all conceivable itemsets, the mining of frequent itemsets is huge, naive, time consuming, expensive in terms of computer resources employed and not efficient particularly when the number of items under consideration are many. Efficient way to mine frequent itemsetsis via design of algorithms that circumvent exploring the search space of all conceivable itemsets and analyses each itemset in the search space as efficient as possible.
The first algorithm used to mine frequent itemsets and association rules was Artificial Immune System (AIS) algorithm proposed by , improvement on AIS renamed as Apriori , other algorithms proposed for FIM include, Frequent pattern (FP) Growth algorithm , Equivalence Class Transformation (ECLATt) , Hyper-links Mine , Linear time Closed Mining (LCM) and SET-oriented Mining (SETM) . Apriori algorithm has been a predominantly implemented algorithm for mining frequent itemsets, but it is not efficient in its high overhead and consumption of the computer resources, an improvement to overcome it inefficiency was proposed in vertical representation of its dataset, Apriori TID improve the efficiency of Apriori by avoiding multiple scan of the dataset during its valuation process. All these algorithms employ different strategies and data structures to discover frequent itemsets efficiently. According to , FIM algorithms differs in the following areas;
Mode of dataset representation, and how to compute minimum support. An improvement to overcome its inefficiency was proposed in the vertical representation of its dataset, Apriori TID[31]. This improves the efficiency of Apriori by avoiding multiple scans of the dataset during its evaluation process. All these algorithms employ different strategies and data structures to discover frequent itemsets efficiently. According to[32], FIM algorithms differ in the following areas;
Search Space techniques, such as Depth-first or Breadth-first search, and how they determine the next item sets to explore in the search universe.
The two dataset representation formats used in FIM algorithms are Horizontal and vertical data format, horizontal format is presented in Table 1, it represents each transactions by its transaction ID, the vertical format is depleted in Table 3, it represents transactions with same items together, horizontal format can be easily converted to vertical format, the vertical format is more effective than horizontal format, it scan the dataset once to compute the support for each itemsets, it is faster than horizontal format in computing the support, but it also required more computer memory space to store the transactions ID. FIM algorithms employs Breadth-first and Depth-First search to mine frequent itemsets, Breadth-First search (BFS) explore all available nodes and select the shortest path between the starting node and other nodes, its memory consumption is higher than the Depth-First Search (DFS). in Breadth-first Search, the algorithm first evaluate single itemsets {Bread}, {Milk}, {Butter}, {Egg}, then itemsets with two itemsets such as {{Milk and Bread}, {Milk and Butter}, {Milk and Egg}, {Butter and Egg}, {Bread and Egg}, {Bread and Butter}, follows by three elements, {Milk, Bread and Butter}, {Milk, Bread and Egg}, {Bread, Butter and Egg}, {Milk, Butter and Egg} and so on until all the number of items has been generated. On the other hand, depth-first search explore itemsets starting with single itemset and then recursively append items to the existing itemset to create another itemset, in the following order; {Milk}, {Milk, Bread}, {Milk, Bread, Egg}, {Milk, Bread, Butter}, {Milk, Bread, Butter, Egg}, {Milk, Butter}, {Milk, Butter, Egg}, {Milk, Egg}, {Bread}, {Bread, Egg}, {Bread, Butter}, {Bread, Butter, Egg}, {Butter}, {Butter, Milk}, {Butter, Egg}, {Egg}. Table 4 depletes the features of some FIM algorithms.
| Itemsets | Transaction ID |
| Milk | T2, T5. |
| Bread | T1, T2, T3, T4, T5. |
| Butter | T3, T4, T5. |
| Egg | T1, T2, T3, T5. |
| Milk and Bread | T2, T5. |
| Milk and Butter | T5. |
| Milk and Egg | T2, T5. |
| Bread and Butter | T3, T4, T5. |
| Bread and Egg | T1, T2, T3, T5. |
| Butter and Egg | T3, T5. |
| Milk, Bread and Butter | T5. |
| Milk, Bread and Egg | T2, T5. |
| Bread, Butter and Egg | T3, T5. |
| Milk, Butter and Egg | T5. |
| Milk, Bread, Butter and Egg | T5. |
| Algorithms | Search Methods | Dataset Representation |
| AIS [25] | BFS (Candidate generation) | Horizontal |
| Apriori [24] | BFS (Candidate generation) | Horizontal |
| Apriori TID [31] | BFS (Candidate generation) | Vertical (TID) |
| SETM [30] | BFS (Candidate generation) | Horizontal (Sql) |
| ECLAT [27] | DFS (Candidate generation) | Vertical (TID-List) |
| FP-GROWTH [26] | DFS (Pattern Growth) | Horizontal (Prefix-tree) |
| H-MINE [28] | DFS (Pattern Growth) | Horizontal (Hyperlink Structure) |
| LCM [29] | DFS (Pattern Growth) | Horizontal (transaction merging) |
VIII. ASSOCIATION RULES GENERATIONS
Association Rules (AR) generation in ARM involves two stages, in the first stage, frequent itemsets were generated, while the second stage has to do with creation of all possible rules from each of identified frequent itemsets that satisfied the minimum confidence threshold. AR are conditional probability that indicate the likelihood of a customers to buy a certain product provided if he or she had bought another product in the same purchase. AR is of the form has two part; the antecedent and the consequent, X is the antecedent (if) and Y (then is the consequent. Antecedent are items found within the data while consequent are items found in combination with the antecedent. AR are created from binary partitioning of each itemsets, the following binary rules will be generated from {Bread, Egg, Milk} frequent itemset; {Bread Egg}, {Bread Milk}, {Bread Egg, Milk}, {Egg Bread}, {Egg Milk}, {Egg Bread, Milk}, {Milk Egg}, {Milk Bread}, {Milk Bread, Egg}, {Bread, Egg Milk}, {Bread, Milk Egg}, {Egg, Milk Bread}, etc. The total number of possible binary rules R, generated from an itemset with d no of items is given in equation 6
AR generate a lot of rules, most these rules are not relevant and important, to prune the rules and obtain important rules, confidence of the each rule are computed using equation 5 based on the user defined minimum confidence threshold filter. AR that does not meet the minimum confidence threshold will be discarded. Note that the confidence of the rule {Bread Egg} may not be same with the confidence of rule {Egg Bread}.
From Table 1, the itemsets that meet the minimum support threshold (0.5) set by the user are: {Bread}:1.0, {Egg}: 0.8, {Butter}: 0.6. {Bread and Egg}:0.8, {Bread and Butter}:0.6. Given a user defined confidence of 60% (0.6). The number of AR with their support and confidence values are listed below;
Rule 1: , support: 0.8, confidence: 0.8 Rule 2: , support: 0.8, confidence: 1.0
Rule 3: {Bread ⇒ Butter}, support: 0.6, confidence: 0.6 Rule 4: {Butter ⇒ Bread}, support: 0.6, confidence: 1.0
The rules are interpreted as follows, in rule 1, 80% of customers that bought Bread also bought Eggs. In rule 2, all the customers that bought Egg also bought Bread. 60% of customers that bought bread in rule 3 also bought Butter, while all the customers that bought butter in rule 4, also bought Bread. Rules that satisfied the minimum support and confidence threshold are strong rules. Often, an AR with high confidence implies a strong rule, this can be misleading and deceptive when the antecedent and/or the consequent have a high support. Whenever the consequent of any AR is very frequent, its confidence will high. High confidence may be misleading at times, and does not always implies strong rules.
Lift ratio is a better metric to measure the strength of AR, it is the ratio of confidence of a rule to the expected confidence a rule. The expected confidence of a rule is probability of buying the consequent of the AR without any knowledge about antecedent. The lift ratio of AR (X Y) is given in equation 7.
A Lift value greater than one (1) implies positive association (correlation) between the antecedent and consequent of the AR, it implies that if a customer buy products in the antecedent there is great chances that products in the consequent will also be bought also. A lift value less than one (1) implies negative association between the antecedent and consequent of the AR, lift value of one (1) indicates no association between the antecedent and consequent of the AR. Applying Equation 7 to Table 1 gives the following lift values for the Rules 1, 2, 3 and 4.
Rule 1: {Bread Egg}, support: 0.8, confidence: 0.8, lift: 1.0
Rule 2: {Egg Bread}, support: 0.8, confidence: 1.0, lift: 1.25
Rule 3: {Bread Butter}, support: 0.6, confidence: 0.6, lift: 1.0
Rule 4: {Butter Bread}, support: 0.6, confidence: 1.0, lift: 1.25
The values of the lift of the rules above shows that there is no association between the rules and , while there is a positive correlation between the antecedent and the consequent of rules and , with 25% more chances of buying the antecedent and the consequent products together. Considering the confidence of an AR alone will limit the competency of making good business decision, The Lift discloses how much better an AR is at predicting products to be placed together on the shelfe rather than assuming, confidence assumes, Lift is a measure that assist store managers to determine the products to be placed together on shelfe.
IX. CONCLUSION
The vast amount of transaction dataset being generated by grocery store remain useless unless the latent knowledge and patterns hidden in it is unlock and discovered. Discovered latent pattern or knowledge from transactional dataset will help grocery store's owners to make important business decision that will make them competitive and maximized their profit margin. The well-known and most used support-confidence framework for Association Rule Mining has some drawbacks when employ to generate strong rules, this weakness has led to it poor predictive performances. This framework predict customers buying behavior based on the assumption of the confidence value, which limits it competent at making good business decision. This work presents a better Association Rule Mining framework for mining data of previous transactions of consumers' buying patterns for the optimal prediction of products placement on the shelves, physical shelf arrangement and identification of products that needs promotion. The proposed framework leverage on the ability of lift metric at improving the predictive performance of association rule mining. The Lift discloses how much better an AR is at predicting products to be placed together on the shelf rather than assuming, confidence assumes. Lift is a measure that assist store managers to determine the products to be placed together on shelf. The proposed framework will assist retailers and grocery store's owners on products placement on the shelves, physical shelf arrangement and identification of products that needs promotion