The continuous growing worlds’ impact of climate change (global warming), including frequent natural disasters such as earthquakes, wildfires, etc.; rising food insecurity, infectious diseases, etc.; among others, causing economic, political, and civil unrest cannot be downplayed. Carbon dioxide (CO 2 ) is the most significant contributor to climate change, mainly generate through human-induced industrial and techno logical advancement activities. Africa is most vulnerable to the impact of climate change in the world. Hence, any effort to combat climate change in Africa will be an outstanding achievement towards mitigating the excessive effect of climate change globally. We proposed a surface response optimization method to optimize (mini mize) the CO 2 emissions in Africa. We utilized the desirability function approach to obtain the optimum value of the risk factors that minimize Africa’s CO 2 emissions. The minimum value of the CO 2 was obtained along with a 95% confidence region.
## I. INTRODUCTION
climate change, contributing 76% greenhouse gas emissions Global warming, also called climate change, is mainly a human-caused rise of the Earth's climate system's average temperature. It is a long-growing global concern politically and economically. It is driven by the greenhouse effect caused by human emissions of harmful gases and wild weather patterns. The physical and natural occurrences causing global warming are inevitable and unequivocal. However, when these occurrences or activities become excessive, our planet earth and the ecosystem's inhabitants pose a danger. Carbon dioxide $\mathrm{CO}_{2}$ has been identified as the greatest contributor to global climate change, contributing $76\%$ greenhouse gas emissions (GHG) through human activities. Other gases include methane (CH4), contributing $16\%$, nitrous oxide (N2O) contributing $7\%$, and fluorinated gases (F-gases) $2\%$, which include hydrofluorocarbons (HFCs), perfluorocarbons (PFCs), and sulfur hex afluoride (SF6) [1]. In 2010, the economic activities resulting in global GHG emissions includes electricity and heat production $(25\%)$; industry $(21\%)$; agriculture, forest, and other land use $(24\%)$; transportation $(14\%)$; building $(6\%)$; and other energy $(10\%)$ [20, 21].
Noticeably, the use of fossil fuel is the primary source of $\mathrm{CO}_{2}$. Other activities resulting in the emission of $\mathrm{CO}_{2}$ are direct human-induced impacts on the use of land and forest, such as land degradation and deforestation for agricultural purposes [1]. Moreover, the swift increase in climate change is due to the rapidly growing civilization, industrialization, and technological advancement in which Africa is not exempted. In 2014, China, the United States, the European Union, India, the Russian Federation, and Japan were the world's top $\mathrm{CO}_{2}$ emitters. The primary sources of $\mathrm{CO}_{2}$ emissions were fossil fuel combustion and cement manufacturing, and gas flaring, representing a large proportion of total global $\mathrm{CO}_{2}$ emissions [20]. The Inter governmental Panel on Climate Change (IPCC) has notified Africa to be among the most vulnerable continents to climate change [7], mainly due to weak adaptive capacity, over-reliance on the ecosystem for livelihood, and less developed agricultural production systems [8], prompting the risk or threat on lives and the sustainable development prospects in Africa [9].
The consequences of climate change can be tremendously dreadful and unprecedented. Most parts of the world are already experiencing and suffering from the impact of climate change, including growing natural disasters such as earthquakes and tsunamis like the 2004 Indian ocean earthquake and tsunami that swept an entire city of Indonesia, killing hundreds of thousands of people and destroying several infrastructures [5]; floodings; hurricanes; volcanic eruptions; a sharp rise in oceans, seas, and earth temperature; wildfires like the Amazon rainforest wildfire in 2019 [3] and 2020 California wildfire [4]; heatwaves; increasing deserts; and many others [6].
Many abrupt effects of climate change have been seen in the past and now with the rising current warming level around $1.1^{\circ}\mathrm{C}$ ( $2.0^{\circ}\mathrm{F}$ ) [10]. Climate change impacts have been projected to increase significantly according to a series of reports by the IPCC as warming continues to $1.5^{\circ}\mathrm{C}$ ( $2.7^{\circ}\mathrm{F}$ ) and beyond [11]. A report by NASA shows 2016 was the warmest year since 1880. Figure 1 was published by NASA, which shows a continued rising global temperature trajectory [12].
Although there is a continuous global fight against global warming, the causes and the impact vary from country to country, and so should the mitigation process. For instance, the United Nations fact sheet on climate change reported in 2006 that Africa is the most vulnerable to climate change, and its impact has a direct effect on the lives of the people in Africa. They further reported that Africa has warmed by $0.7^{\circ}\mathrm{C}$ during the
20th century and project that average surface temperatures in Africa could increase from $2 - 6^{\circ}\mathrm{C}$ by 2100 [13]. The statistics are alarming and endangering millions of lives if nothing is done. Hence, the need for strong mitigating efforts to fight climate change in Africa. The most vulnerable African countries are the Seychelles Islands, Cape Verde, and Mauritius and large African deltas such as the Niger Delta, Nile Delta in Egypt, the Kalahari, and Okavango Deltas in Botswana. This means that climate change must be taken more seriously and tackled within the African Continent setting rather than the global setting. The bottom-top mitigating strategy will be a more effective and efficient policy in combating global warming. Thus, the fight against climate change should start from country to continent to global and not otherwise, because the cause, effect, and impact varies from country to country and continent to continent.
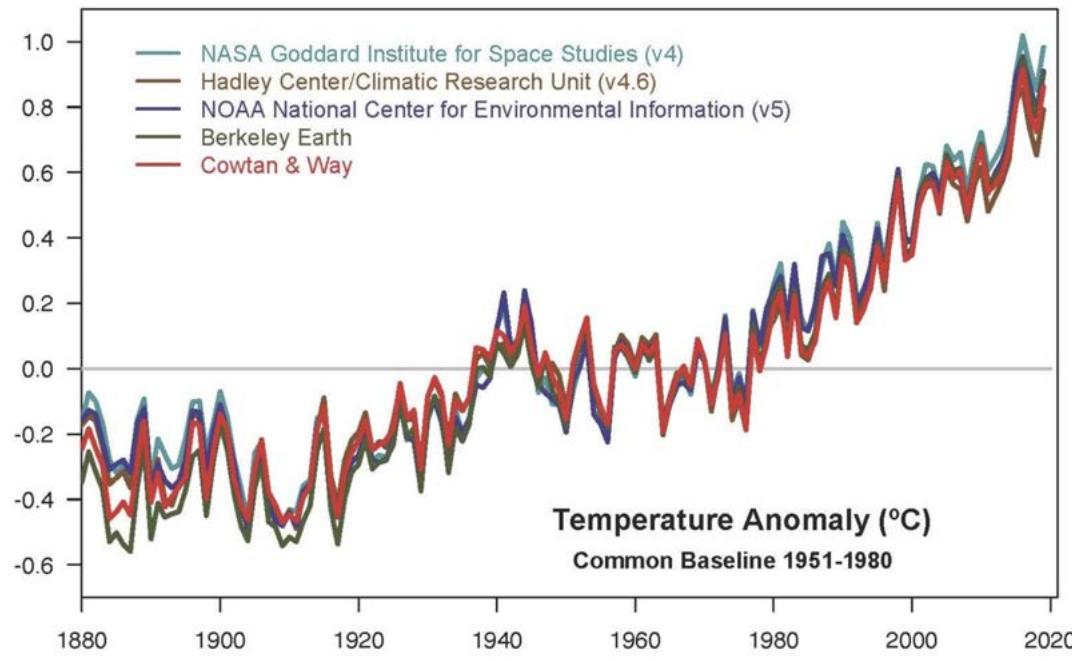 Figure 1: Temperature Data Showing Rapid Warming in the Past Few Decades, the Latest Data Going up to 2019
Admittedly, the mitigation against climate change is a global fight. However, it is only feasible if individual continents and countries play a major independent role in the mitigation process from within. The mitigation course requires great efforts, including research, policies to reduce fossil fuel emissions, developing and adopting low-carbon energy technologies, enhancing reforestation, forest preservation, and energy efficiency. Given that $\mathrm{CO}_{2}$ is the most significant driver of climate change contributing to $76\%$ of the world's global warming [1], most research to curb global warming has focused on CO2 and remedies to minimize its excessive emission [14] [17]. The increasing use of fossil fuels is the major contributor to $\mathrm{CO}_{2}$ emissions in the atmosphere.
The current study is about $\mathrm{CO}_{2}$ minimization in Africa. As mentioned earlier, Africa turns out to be the most at risk in the event of excessive climate change. Most African countries are third-world countries lacking the advanced technologies to combat the impact of climate change. The IPCC predicts a persistent increase in water stress among millions of people in Africa due to climate variability and change [7]. Surface runoff and water availability are directly affected by changes in precipitation patterns [25]. The public health systems are least efficient in African countries globally, the World Health Organization [19]. African countries are highly susceptible to infectious diseases such as malaria, dengue fever, meningitis, schistosomiasis, etc., especially in the Sub-Saharan African region. These diseases continue to exacerbate and are very sensitive to climate variability [25]. Many African countries are already suffering from the impact of climate change, including the rising food insecurity and inadequate or lack of water (especially hygiene water), the increasing mortality rate (especially infant mortality), malnutrition, among others. The combat against climate change in Africa must be taken highly seriously and should not be underestimated. Therefore, it is imperative to research $\mathrm{CO}_{2}$ emissions in Africa to combat climate change, Africa. As a contribution to mitigating the excessive emissions of $\mathrm{CO}_{2}$ in Africa, the world at large, Abu Sheha, M. and Tsokos, C. (2019) developed a statistical model of fos sil fuel emission factors contributing to atmospheric carbon dioxide in Africa. They found Liquid fuels (Li), Solid fuels (So), Gas fuels (Ga), Gas flares (Gf), and Cement production (Ce), and seven interaction factors among them to be significant contributions to fossil fuel emissions. Also, they showed the rank of the risk factors' contribution to $\mathrm{CO}_{2}$ emissions on the Africa map [16]. The present study focused on building upon the model they developed. Thus, in the present study, we employed the desirability function approach to surface response optimization analysis of the $\mathrm{CO}_{2}$ emissions based on the identified risk factors. Our objective is to obtain the optimal or minimum value of the $CO_2$ by identifying the individual risk factors' optimum value and interactions along with their weights. Lohuwa Mamudu and Chris P Tsokos [23] applied the desirability function approach to optimize corn production returns in the United States (US). However, this study's methods use the single response surface optimization (SRSO) and desirability function approach (DFA) to optimize Africa's atmospheric carbon dioxide emissions. We also obtained the 95% confidence region of $CO_2$ for which the hypothesis of the amount of carbon dioxide emissions in Africa can be accessed. The optimization method used has been well-validated and satisfies all necessary conditions utilizing the desirability function, $R^2$, $R_{adj}^2$, and $R_{pred}^2$ statistic, and the 95% confidence interval (CI) and prediction interval (PI) of the optimal values.
The data used in this study was obtained from Oak Ridge National Lab (Division of US Department of Energy), consisting of the amount of atmospheric $\mathrm{CO}_{2}$ emissions in metric tons (MT) along with five risk factors from 1964 to 2014. Figure 2 shows the time series trend of $\mathrm{CO}_{2}$ emissions in Africa's atmosphere from 1964 to 2014, which is generally increasing.
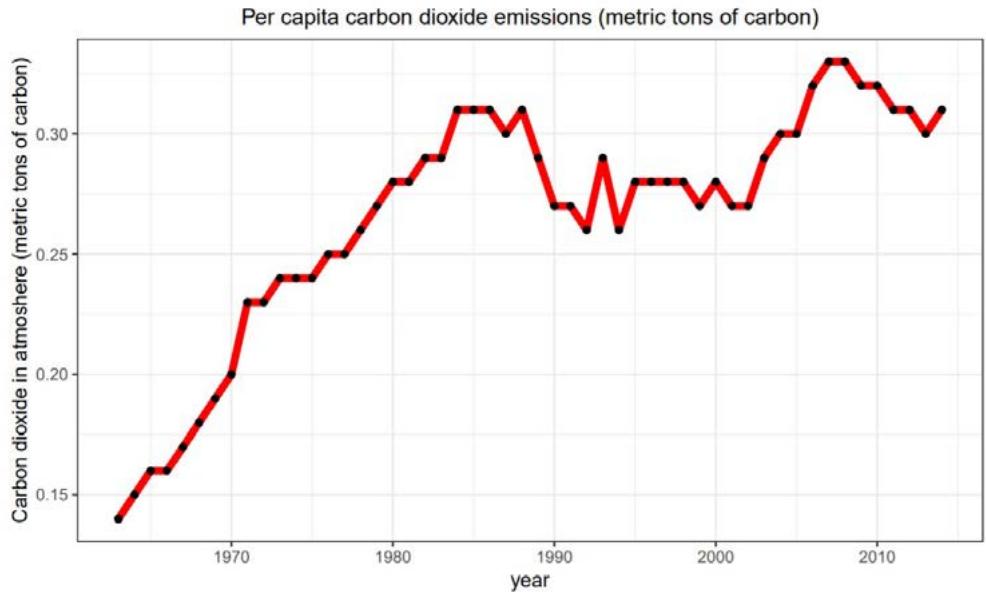 Figure 2: Annual
from 1964 to 2014
## II. METHOD AND RESULTS
### a) Overview of Desirability Function Approach
In the present study, we utilized the desirability function approach to optimize atmospheric carbon dioxide emissions in Africa. The desirability function approach is a commonly used optimization method that assigns values to a set of responses and chooses the factors that optimize the response's values. [24] proposed the different desirability function classes to optimize the response by obtaining the minimum, max imum, or target values. The method uses the constraints of the factors or predictors, $x$, and obtain optimum values of $x$ that provide the best-desired value of the response, $y$. The objective of the optimization process is to maximize, minimize, or obtain a target value of the response, $y_{j}$ with desirability function $d_{i}(y_{j})$. $d_{i}(y_{j})$ assigns a score between 0 and 1 for each value of $y_{i}$, where $d_{i}(y_{i}) = 0$ is the most undesired values of $y_{i}$ and $d_{i}(y_{i}) = 1$ is the most desired value of $y_{j}$. Thus, as $d_{i}(y_{i})$ approaches 1, the more $y_{i}$ approaches the optimal point. For example, $d_{1}(y_{1}) = 0.75$ gives a more desire optimal value of $y_{1}$ than $d_{1}(y_{1}) = 0.60$. The following are the three-desirability function we can obtain based on the objective of our optimization process.
If the optimization process is to obtain the target value of the response, $y_{i}$ for a set of values of predictor variables $x_{i}$, then the desirability function approach (DFA) $d_{i}(y_{i})$ is given by
$$
d _ {i} \left(\hat {y} _ {i}\right) = \left\{
\begin{array}{l l}
0, & \hat {y} _ {i} (x) < l _ {i} \\
\left(\frac {\hat {y} _ {i} (x) - l _ {i}}{t _ {i} - l _ {i}}\right) ^ {\tau_ {1}}, & l _ {i} \leq \hat {y} _ {i} (x) \leq t _ {i} \\
\left(\frac {u _ {i} - \hat {y} _ {i} (x)}{u _ {i} - t _ {i}}\right) ^ {\tau_ {2}}, & t _ {i} \leq \hat {y} _ {i} (x) \leq u _ {i} \\
0, & \hat {y} _ {i} (x) > u _ {i}.
\end{array}
\right.
\tag {1}
$$
Thus; if the optimization process is to maximize the value of the response, $y_{i}$ for a set of values of predictor variables $x_{j}$, then the estimated desirability function $d_{i}(y_{i})$ is given by
$$
d _ {i} (\hat {y} _ {i}) = \left\{ \begin{array}{l l} 0, & \hat {y} _ {i} (x) < l _ {i} \\ \left(\frac {\hat {y} _ {i} (x) - l _ {i}}{t _ {i} - l _ {i}}\right) ^ {\tau}, & l _ {i} \leq \hat {y} _ {i} (x) \leq t _ {i} \\ 1, & \hat {y} _ {i} (x) > t _ {i}. \end{array} \right. \tag {2}
$$
If the optimization process is to minimize the value of the response, $y_{i}$ for a set of values of predictor variables $x_{i}$, then the estimated desirability function $d_{i}(y_{i})$ is given by
$$
d _ {i} \left(\hat {y} _ {i}\right) = \left\{
\begin{array}{l l}
1, & \hat {y} _ {i} (x) < t _ {i} \\
\left(\frac {u _ {i} - \hat {y} _ {i} (x)}{u _ {i} - t _ {i}}\right) ^ {\tau}, & t _ {j} \leq \hat {y} _ {i} (x) \leq u _ {i} \\
0, & \hat {y} _ {i} (x) > u _ {i}
\end{array}
\right.
\tag {3}
$$
where $\pmb{\tau}_{1},\pmb{\tau}_{2}$, and $\pmb{\tau}$ are the weights that define the shape of the desirability function $d_{i}(\hat{y}_{i})$. In equation (1), if $\pmb{\tau}_{1} = \pmb{\tau}_{2} = 1$. It means that the shape of $d_{i}(\hat{y}_{i})$ is positively linear; for a concave shape, $\pmb{\tau}_{1} > 1$ and $\pmb{\tau}_{2} > 1$; and for convex shape, $\pmb{\tau}_{1} < 1$ and $\pmb{\tau}_{2} < 1$. In equation (2), $t_{i}$ denotes the large enough value of the response variable and $t_{i}$ in equation (3), represents the small enough value of the response. Furthermore, $t_{i},I_{i}$, and $u_{i}$ are the desired target values, lower values, and upper values for the response variable $y_{i}$, respectively. To obtain the overall desirability function $D$, we utilize the geometric mean of a combined function of individual desirability's $d_{i}(\hat{y}_{i})$ given by
$$
D = \left[ \prod_ {i = 1} ^ {c} d _ {i} (\hat {y} _ {i}) \right] ^ {1 / c} = \left[ d _ {1} (\hat {y} _ {1}) d _ {2} (\hat {y} _ {2}) \dots d _ {c} (\hat {y} _ {c}) \right] ^ {1 / c}. \tag {4}
$$
where $c$ represents the estimated number of responses, $y$. Note that the optimization of a single response variable for a set of controllable factors or risk factors is known as a single response optimization. Whereas the optimization of two or more responses is known as multiple response optimization.
### b) Statistical Analysis for Optimization of Atmospheric Carbon Dioxide $\mathrm{CO}_{2}$ Emissions in Africa
We adopt the following algorithmic procedure to optimize a given phenomenon's response based on the desirability function approach.
1. Develop the model that accurately predicts the response $y$ for a set of control table risk factors or predictors $x_{i}$.
2. Obtain the constraints of the response and input factors, for $a < y_{i} < b$ and $c < x_{j} < d$.
3. Define the desirability function(s) $d_{i}(y_{i})$ for the response(s) based on the opti mization objective.
4. Obtain the optimal value of the response by maximizing the desirability function concerning the controllable input factors.
5. Validate the optimization process based on the coefficient of variation $R^2$ and the prediction accuracy $R_{pred}^2$.
The following are the results obtained in the optimization process of the atmospheric carbon dioxide emission in Africa using the desirability function approach based on the stated algorithm. The objective is to minimize or obtain the minimum $\mathrm{CO}_{2}$ emissions with respect to the controllable input variable or risk factors Li, So, Ce, Ga, and Gf. In equation 5 below, we obtained a statistical model that predicts $\mathrm{CO}_{2}$ missions in Africa with $R^{2}$ of 97%. We then obtained the constraints of the response and the input factors, as shown in Table 1. Using the defined desirability function as given by in equation 3, we optimize the $\mathrm{CO}_{2}$ by obtaining the minimum $\mathrm{CO}_{2}$ with a maximum desirability function, $d(\mathrm{CO}^{\wedge}2) = 0.99$, $R^{2}$ along with $R_{adj}^{2}$ of 98.97% and 98.42%, respectively, and $R_{pred}^{2}$ of 97.71%, as shown in Table 3. In Table 2, we display the attained minimum values of the $\mathrm{CO}_{2}$ along with the corresponding optimum values of the input factors. We further obtained a 95% confidence region and predictive interval for the attained minimum value of $\mathrm{CO}_{2}$ emissions in Africa, as shown in Table 3, below.
$$
\hat{C O}_{2} = - 0.0 6 5 6 + 0.1 8 \times 1 0 ^ {- 3} S o + 0.1 1 5 \times 1 0 ^ {- 3} L i - 0.8 8 2 \times 1 0 ^ {- 5} G a \- 0.1 9 5 \times 1 0 ^ {- 3} C e + 0.1 2 6 \times 1 0 ^ {- 3} G f - 0.1 3 \times 1 0 ^ {- 8} S o . L i \- 0.4 6 8 \times 1 0 ^ {- 8} S o . G a + 0.1 8 4 \times 1 0 ^ {- 7} S o . C e \- 0.6 1 5 \times 1 0 ^ {- 8} S o . G f + 0.5 6 1 \times 1 0 ^ {- 8} L i . G a \- 0.1 1 4 \times 1 0 ^ {- 7} L i . C e + 0.5 7 2 \times 1 0 ^ {- 8} C e . G f . \tag{5}
$$
See [16] for the development of this statistical model.
Table 1: The Constraints of the Response and Risk Factors.
<table><tr><td>Response (CO2) in metric tons per capita</td><td>Input Risk Factors</td></tr><tr><td rowspan="5">0.14 ≤ CO2 ≤ 0.33</td><td>16537 ≤ Li ≤ 125427</td></tr><tr><td>29800 ≤ So ≤ 124526</td></tr><tr><td>1320 ≤ Ce ≤ 23631</td></tr><tr><td>196 ≤ Ga ≤ 67972</td></tr><tr><td>313 ≤ Gf ≤ 23942</td></tr></table>
Table 2: The Minimum Value of the Response and Optimum Value of the Risk Factors
<table><tr><td>C̅O2</td><td>Li</td><td>So</td><td>Ce</td><td>Ga</td><td>Gf</td></tr><tr><td>-1.13973</td><td>16537</td><td>29800</td><td>23631</td><td>67972</td><td>313</td></tr></table>
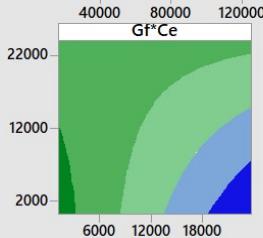
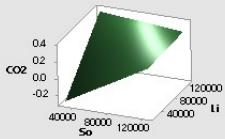
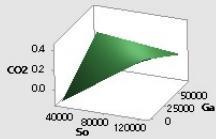
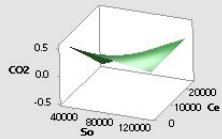
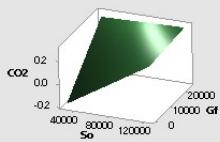
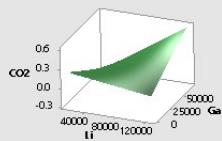
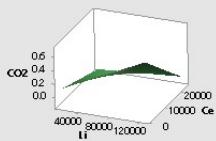
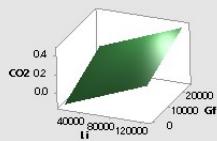
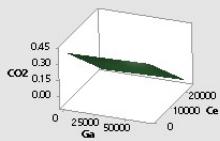
Also in the Appendix, we display in Figures 3 of the combination of two risk factors in maximizing the and 4 a contour plots and their corresponding 3D plots response holding other risk factors constant.
Table 3: Validation of the Optimization Process and Confidence Regions of the Optimal CO2 Emissions
<table><tr><td>R-sq</td><td>R-sq(adj)</td><td>R-sq(pred)</td><td>d(CO2)</td><td>95% CI</td><td>95% PI</td></tr><tr><td>98.79%</td><td>98.42%</td><td>97.71%</td><td>0.99</td><td>(-1.386, -0.893)</td><td>(-1.387, -0.893)</td></tr></table>
The validation results attest to the excellent results of obtaining the optimum values of the risk factors that will minimize the output of $\text{CO}_2$ emissions.
## III. DISCUSSION
Climate change (global warming) has become the world's greatest problem in recent years. On top of this, no sufficient human or national action has been taken to address climate changes. The United Nations Environment (UN Environment) IPCC outlined climate changes as the defining issue of our time, causing a change in the weather patterns that threatens food production, causing widespread food insecurity, and rising sea level that increases the risk of catastrophic flooding [25], among others. The IPCC further reported that carbon dioxide $\mathrm{CO}_{2}$, mainly from burning fossil fuel, contributes to two-thirds of greenhouse gas (GHG) emissions. Similarly, the European Environment Agency pointed out climate change as one of the biggest challenges of our time, stating that climate change is already happening with evidence of rising temperatures, drought and wildfires, a shift in rainfall patterns, melting of glacier and snow, and drastic increases in the mean sea level [26]. They further postulated that we could mitigate or reduce climate change by decreasing or preventing the emission of human-linked activities. In 2019, MIT Sloan School Management reported the five biggest challenges of fighting climate change [27]. They mentioned that climate change is a global threat and requires superhuman sacrifice and awareness to address it. They further pointed out that $\mathrm{CO}_{2}$ is globally polluted and cannot be locally contained.
Given that $\mathrm{CO}_{2}$ is the biggest threat or risk factor of climate change, most mitigation factors and efforts must reduce $\mathrm{CO}_{2}$ emissions. The interesting question is, what minimum value of $\mathrm{CO}_{2}$ emission can be considered less or no threat to climate change or global warming? In the present study, we utilized the desirability function approach of response surface optimization to optimize the atmospheric $\mathrm{CO}_{2}$ emission in Africa, achieving the minimum value of $\mathrm{CO}_{2}$ needed as a mitigating factor for climate change -1.13973. The optimal value for $\mathrm{CO}_{2}$ was attaining after developing a high-quality predictive model of $\mathrm{CO}_{2}$ with an R2 of 97.28%, identifying five individual risk factors and seven interaction terms [16]. We proceeded with the op timization process by obtaining the five individual risk factors' constraints and the response $\mathrm{CO}_{2}$, as given in Table 1. We then utilized the desirability function method to obtain the minimal value of $\mathrm{CO}_{2}$, maximizing the value of the desirability function. The optimization algorithm resulted in the minimum value of $\mathrm{CO}_{2}$ emission in Africa of -1.13973 and a maximum desirability value of 0.99. Thus, implying that the controllable risk factors are 99% effective in explaining the attained minimum value of $\mathrm{CO}_{2}$. The $\mathrm{CO}_{2}$ of -1.13973 is the minimum value Africa needs to achieve to reduce or control climate change. Our results are consistent with reports by [28], [29], who reported that negative emissions are needed to stabilize global warming to 1.5 degrees Celsius. Almost all studies on pathways to achieving the global warming of 1.5°C in the special report by the Intergovernmental Panel on Climate Change (IPCC) reveal carbon removal to achieve net negative emission is the best approach. Therefore, the minimum negative value of $\mathrm{CO}_{2}$ emission is ideal for Africa to curb climate change, contributing to stable global warming.
The probability of obtaining the minimum value of $CO_2$ of exactly -1.13973 seems not feasible. Therefore, we obtained a confidence region of (-1.386, -0.893) along with a predictive interval of (-1.387, -0.893), which gives us 95% confidence in capturing the minimum value of $CO_2$ emissions. The resulting $R^2$ at the end of the optimization process was 0.9879, approximately equal to the $R^2$ of the original model, attesting to the robustness and high quality of the optimization process we performed. Also, the optimization process resulted in a predictive accuracy of 97.71%, as given in Table 3. From Table 2, to attain the minimum value of $CO_2$ of -1.13973 required the combination of the optimal value of Liquid fuels of 16537, Solid fuels of 16537, Gas fuels (Ga) of 67972, Gas flares (Gf) of 313, and Cement production (Ce) of
23631. Combining the controllable factor needed to attain the optimal value of $CO_2$ may vary from data to data. However, the Optimal value of $CO_2$ should be within the limit of the confidence region. The individual risk factors Ga and Ce, including the interactions, So $\cap$ Li, So $\cap$ Ga, So $\cap$ Gf, and Li $\cap$ Ce are negatively associated with the atmospheric $CO_2$ emissions. Whereas the individual significant risk factor So, Li, and Gf with interactions So $\cap$ Ce, Li $\cap$ Ga, and Ce $\cap$ Gf are positively related to $CO_2$. The finding of So and Li as positively associated with $CO_2$ emissions in Africa is consistent with South Korea's result by D. Kim and C. P. Tsokos [30].
Similarly, Ga's finding as negatively associated with $\mathrm{CO}_{2}$ emission in Africa is consistent with the results in South Korea and the USA by Yong Xu, Chris P. Tsokos (2013) [17]. In contrast with the USA's findings [17], Ce was found to influence Africa's $\mathrm{CO}_{2}$ emission negatively. Also, we displayed contour and 3D plots showing the combination of the controllable or attributable factor impact on $\mathrm{CO}_{2}$ emissions in Africa. The blue-colored region of the contour plots is a region of minimization of $\mathrm{CO}_{2}$ emission. Thus, the deeper the blue color, the closer the approach to the optimal or minimum region of $\mathrm{CO}_{2}$ emissions. For example, by reducing Li and So in the first contour plot, we minimize $\mathrm{CO}_{2}$ emission.
Although mitigation against climate change is a global responsibility, we believe that every country/continent has an independent role to perform if we are to achieve the optimal level of $CO_{2}$, which is harmless to our globe. The rate of atmospheric $CO_{2}$ emissions and contributing risk factors vary from country to country or continent to continent, with some experiencing higher emissions than others. Therefore, different mitigation policies and efforts will be required. Although a global push for accelerated climate change mitigation is needed, enacting, and implementing policy relevant should be left in the hands of individual countries or continents. Thus, given that an optimal (minimum) $CO_{2}$ emissions of -1.13973 within a confidence region of (-1.386, -0.893) needs to be attained to stabilize the impact on global warming in Africa, this may differ from the required minimum emission of $CO_{2}$ in other continents. As a result, this study is only applicable to global warming policy intervention in Africa. However, the methodology or approach can be applied to find the minimum $CO_{2}$ emissions for other countries or continents. The optimization algorithm allows to set the $CO_{2}$ to a specific target value and obtain the values of each attributable variable needed to achieve the target value. The present study provides a strategy for controlling $CO_{2}$ emissions in Africa, hence a mitigating strategy for controlling climate change or global warming.
## IV. CONCLUSION
In the present study, we achieved five important major uses of the response surface optimization method to minimize the atmospheric $\mathrm{CO}_{2}$ emissions in Africa. First, the desirability function approach was utilized to determine the attributable variables' values that minimize Africa's $\mathrm{CO}_{2}$ emissions. Second, we identified the minimum value of -1.13973 $\mathrm{CO}_{2}$ emission in Africa's atmosphere using a data-driven statistical model with an R2 of $97.28\%$ obtained using real data from 1964 to 2014. Third, we also identified a $95\%$ confidence region for the attained minimum value of $\mathrm{CO}_{2}$ of (-1.386, -0.893), which can be used to assess the statistical significance of the optimal/minimum value of $\mathrm{CO}_{2}$ emissions. Fourth, the bivariate interaction effect on atmospheric $\mathrm{CO}_{2}$ emissions was obtained, including 3D and contour plots to assess the combination of individual risk factors' impact on atmospheric $\mathrm{CO}_{2}$ emissions in Africa. Lastly, the optimization process is well-validated to satisfy the necessary conditions, achieving an excellent desirability function of 0.99.
Given the IPCC goal of meeting $1.5^{\circ}\mathrm{C}$ of global warming, our finding of the minimum value of -1.13973 provides Africa with a real direction, a set goal, and a policy intervention strategy to mitigate climate changes, a contribution effort to fighting global warming. The results obtained from this study are only applicable to the Africa continent and cannot be generalized. However, the optimization approach or algorithm can be applied to $\mathrm{CO}_{2}$ data from other continents that have been statically modeled to identify the risk factors and interactions to assess the needed minimum value of $\mathrm{CO}_{2}$ emission.
### APPENDIX A
Contour Plots of CO2
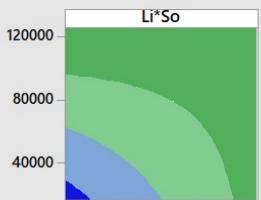
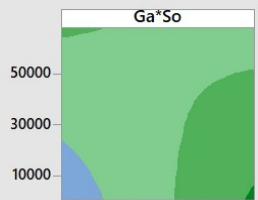
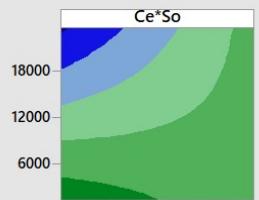
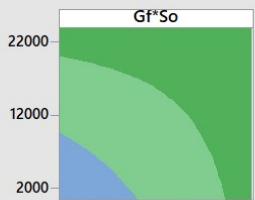
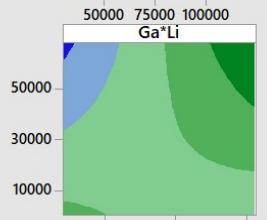
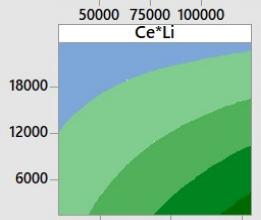
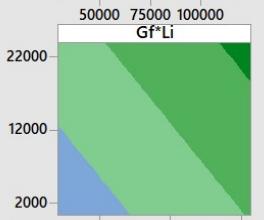
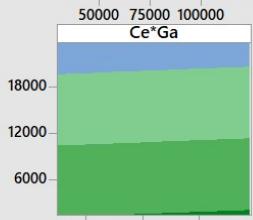
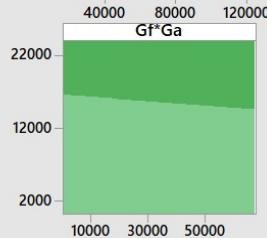


 Figure 3: Contour Plots of
### Surface Plots of CO2
Generating HTML Viewer...
References
28 Cites in Article
(2020). Scientific Consensus: Earth's Climate is Warming.
(2019). Trevelyan, Laura Kate, (born 21 Aug. 1968), anchor, BBC World News America, since 2012.
(2020). Measuring the State of Disaster Philanthropy, 2018.
Thorne Lay,Hiroo Kanamori,Charles Ammon,Meredith Nettles,Steven Ward,Richard Aster,Susan Beck,Susan Bilek,Michael Brudzinski,Rhett Butler,Heather Deshon,Göran Ekström,Kenji Satake,Stuart Sipkin (2005). The Great Sumatra-Andaman Earthquake of 26 December 2004.
Paolo D'odorico,Abinash Bhattachan,Kyle Davis,Sujith Ravi,Christiane Runyan (2013). Global desertification: Drivers and feedbacks.
S Schneider,S Semenov,Patwardhan,I Burton,Maga Dza,M Oppenheimer,Pittock,Rahman,Smith,A Suarez,Others (2007). Assessing key vulnerabilities and the risk from climate change. Climate Change 2007: Impacts, Adaptation and Vulner ability.
Chidiebere Ofoegbu,Paxie Chirwa (2019). Analysis of rural people's attitude towards the management of tribal forests in South Africa, Taylor & Francis.
(2014). Climate Change 2014 -Impacts, Adaptation and Vulnerability: Part B: Regional Aspects: Working Group II Contribution to the IPCC Fifth Assessment Report.
Rebecca Lindsey,Luann Dahlman,; Valérie,Panmao Zhai,Hans-Otto And Pörtner,Debra Roberts,Jim Skea,Priyadarshi Shukla,Anna Pirani,W Moufouma-Okia,C P´ean,R Pidcock,Ers (2018). Overview briefing on the IPCC Special Report on Global Warming of 1.5°C.
(2020). NASA Study: Rising Sea Level Could Exceed Estimates for U.S. Coasts – Climate Change: Vital Signs of the Planet.
(2006). Explicit references to human rights under the United Nations framework convention on climate change.
Ernst Worrell,Lynn Price,Nathan Martin,Chris Hendriks,Leticia Meida (2001). C<scp>ARBON</scp> D<scp>IOXIDE</scp> E<scp>MISSIONS FROM THE</scp> G<scp>LOBAL</scp> C<scp>EMENT</scp> I<scp>NDUSTRY</scp>.
James Raich,Christopher Potter (1995). Global patterns of carbon dioxide emissions from soils.
Mohamed Sheha,Ali Abu,Tsokos,Christ (2019). Statistical Modeling of Emission Factors of Fossil Fuels Contributing to Atmospheric Carbon Dioxide in Africa.
Yong Xu,Tsokos,C (2013). Attributable variables with interactions that contribute to carbon dioxide in the atmosphere.
Hayley Fowler,Stephen Blenkinsop,Claudia Tebaldi (2007). Linking climate change modelling to impacts studies: recent advances in downscaling techniques for hydrological modelling.
Luis Sambo,Gomes (2014). The health of the people: what works: the African Regional Health Report 2014.
Change (2014). Mitigation of climate change, Contribution of Working Group III to the Fifth Assessment Report of the Intergovern mental Panel on Climate Change.
F Tubiello,Salvatore,M,Cóndor Golec,Ferrara,S Rossi,R Biancalani,S Federici,H Jacobs,A Flammini (2014). Agriculture, forestry and other land use emissions by sources and removals by sinks.
Rajendra Pachauri,Allen,Myles Barros,Vicente Broome,John Cramer,Wolfgang Christ,Renate Church,John Clarke,Leon Dahe,Qin Dasgupta,Purnamita Others (2014). Climate change 2014: synthesis report. Contribution of Working Groups I, II and III to the fifth assessment report of the Intergovernmental Panel on Climate Change.
Mamudu Lohuwa,Tsokos Chris,P (2020). Response Surface Optimization of the Returns from Corn Production in the US Using the Desirability Function Approach.
George Derringer,Ronald Suich (1980). Simultaneous optimization of several response variables, Taylor & Francis.
Hayley Fowler,Stephen Blenkinsop,Claudia Tebaldi (2007). Linking climate change modelling to impacts studies: recent advances in downscaling techniques for hydrological modelling.
Carlo Fanelli (2014). Climate Change: 'The Greatest Challenge of Our Time, Alternate Routes.
Kara Baskin (2019). The 5 greatest challenges to fighting climate changes.
De Coninck,Heleen,Aromar Revi,Mustafa Babiker,Paolo Bertoldi,Marcos Buckeridge,Anton Cartwright,Wenjie Dong,James Ford,Sabine Fuss,J-C And Hourcade,Others (2018). Strengthening and implementing the global response, Intergovernmental Panel on Climate Change.
Howard Herzog (2018). Why we can’t reverse climate change with ‘negative emissions’ technologies.
D Kim,C Tsokos (2013). Statistical Significance of Fossil Fuels Contributing to Atmospheric Carbon Dioxide in South Korea and Comparisons with USA and EU.
No ethics committee approval was required for this article type.
Data Availability
Not applicable for this article.
How to Cite This Article
Mohamed Ali Abu Sheha. 2026. \u201cDesirability Function Approach to Response Surface Optimization Analysis of Atmospheric Carbon Dioxide CO2 Emissions in Africa\u201d. Global Journal of Science Frontier Research - H: Environment & Environmental geology GJSFR-H Volume 22 (GJSFR Volume 22 Issue H7).
Explore published articles in an immersive Augmented Reality environment. Our platform converts research papers into interactive 3D books, allowing readers to view and interact with content using AR and VR compatible devices.
Your published article is automatically converted into a realistic 3D book. Flip through pages and read research papers in a more engaging and interactive format.
Our website is actively being updated, and changes may occur frequently. Please clear your browser cache if needed. For feedback or error reporting, please email [email protected]
Thank you for connecting with us. We will respond to you shortly.