The design of mammalian cell culture processes as technological platform for monoclonal antibody (mAb) production is a complex task mainly due to partial knowledge of culture media composition impact on process outcomes. Faced with this problem, the present work aimed to characterize the metabolic profile during the early culture at lab-scale of a specific cell line transfected to obtain a monoclonal antibody (mAb) of therapeutic interest in the treatment of cancer, seeking most favorable nutritional conditions. The experimental design, based on the use of four different media in a two-liter scale culture, provided data on the content of 19 metabolites, cell concentration, and mAb concentration over the course of batches, where in the first case measurements were performed with liquid chromatography-mass spectrometry (LC-MS) as an advanced laboratory analytical support.
## I. INTRODUCTION
The use of mammalian cells to produce monoclonal antibodies (mAbs) has become a widespread practice in the biotechnology domain because of its ability to largely achieve posttranslational modifications and protein folding. However, from an engineering point of view, the greatest obstacle in designing culture processes including these cells is their high complexity, as currently there is partial knowledge of laws governing such phenomena. On one hand, it shall be taken into consideration the significant amount and intricate sequence of biochemical reactions at the intra and extracellular level, while on the other hand cell environment operational conditions have also their impact on culture process performance regarding product-required quality [1].
A key issue to consider at first is the influence of media metabolites content on cellular growth and mAb generation along the process. As a sound strategy, focusing on culture metabolic profile could start at small scale, leaving the inclusion of cell environment operational variables for further studies at gradually larger scales, where fluctuations of these are better detectable and meaningful to establish culture process state [2,3].
In such research, the design of experimental plans combined with the use of multivariate data analysis (MVDA) tools has shown its advantages, by facilitating the development of data-driven models that integrates input and output variables in all its interrelation complexity, hence providing comprehensive process variability characterization and prediction [4,5].
There is a wide range of MVDA applications that has been described in the biotechnological domain, for instance: cell culture process scales comparability [6,7]; determine the relationship between process parameters and critical quality attributes [8,9]; feeding strategies for metabolic control and improving process robustness [10,11], among others. In addition, MVDA is currently recognized as a useful mean to analyze genomic and proteomic data, as it provides the tools for a significant complexity reduction in data processing [12-14]. Yet, regarding the implementation of MVDA in metabolic studies and media selection, there are still a discrete number of published references that manage to analyze a significant spectrum of metabolites [15-17].
Such praxis is in full correspondence with Quality by Design current paradigm as appointed by The International Council for Harmonisation of Technical Requirements for Pharmaceuticals for Human Use (ICH) in the Q8, Q9, and Q10 guidelines, where process understanding acquires a key role for assuring an effective scaling-up exercise toward a successful technology transfer [18].
The present work exposes a MVDA approach for characterizing metabolic profile during the early lab-scale culture of a specific CHO-K1 cell line transfected for obtaining a mAb under study in a two-liter bioreactor, thus determining the most advantageous culture nutritional conditions. Results derived from this research provide a valuable knowledge that shall contribute to subsequent studies as a continuity for achieving culture media optimization and further process scale-up.
## II. MATERIALS AND METHODS
### a) Cell Culture Experiment
A transfected mammalian cell line CHO-K1 developed for expressing the mAb of interest was cultured in a two-liter volume APPLIKON bioreactor equipped with an automatic process control system, using four different protein-free and serum-free media identified as M1, M2, M3 and M4. Main chemical composition of each medium is summarized in Table 1:
Table 1: Composition of culture media in mg per liter
<table><tr><td>Components</td><td>Medium M1</td><td>Medium M2</td><td>Medium M3</td><td>Medium M4</td></tr><tr><td>Ala</td><td>1.052</td><td>1.311</td><td>0.952</td><td>0.895</td></tr><tr><td>Arg</td><td>1.562</td><td>1.356</td><td>1.792</td><td>1.640</td></tr><tr><td>Asn</td><td>3.727</td><td>1.371</td><td>1.512</td><td>1.363</td></tr><tr><td>Asp</td><td>0.028</td><td>0.020</td><td>0.702</td><td>0.687</td></tr><tr><td>Gln</td><td>4.236</td><td>2.507</td><td>5.133</td><td>3.745</td></tr><tr><td>Glu</td><td>0.396</td><td>0.514</td><td>0.548</td><td>0.525</td></tr><tr><td>Gly</td><td>0.261</td><td>0.411</td><td>0.549</td><td>0.605</td></tr><tr><td>Ile</td><td>0.104</td><td>0.054</td><td>1.690</td><td>1.539</td></tr><tr><td>Leu</td><td>2.304</td><td>1.359</td><td>1.836</td><td>1.573</td></tr><tr><td>Lys</td><td>1.806</td><td>1.209</td><td>1.367</td><td>1.172</td></tr><tr><td>Met</td><td>0.471</td><td>0.298</td><td>0.439</td><td>0.374</td></tr><tr><td>Phe</td><td>0.775</td><td>0.431</td><td>0.051</td><td>0.044</td></tr><tr><td>Pro</td><td>1.207</td><td>1.210</td><td>0.084</td><td>0.089</td></tr><tr><td>Ser</td><td>1.510</td><td>1.373</td><td>1.449</td><td>1.324</td></tr><tr><td>Thr</td><td>1.184</td><td>0.572</td><td>0.835</td><td>0.713</td></tr><tr><td>Val</td><td>1.786</td><td>0.913</td><td>1.278</td><td>1.038</td></tr><tr><td>Pyr</td><td>1.543</td><td>1.044</td><td>0.973</td><td>0.666</td></tr><tr><td>Gluc</td><td>24.182</td><td>10.887</td><td>20.138</td><td>17.348</td></tr></table>
The operation of each run was carried out in batch mode, starting from an inoculum with a concentration greater or equal to $0.4 \times 10^{6}$ cells/ml in the medium previously loaded in the bioreactor, and then the process was allowed to carry on until viability was less than $50\%$. Cell environment culture conditions were set as follows: temperature at $37 \pm 1^{\circ}\mathrm{C}$, dissolved oxygen at $40 \pm 10\%$ and pH at $7.2 \pm 0.2$, as well as an agitation impeller tip speed kept at $1\mathrm{m/s}$ and aeration rate between $0.005 - 0.0075$ vessel volumes per minute (wvm).
### b) Analytical Support
Several measurements were obtained off line from culture supernatant samples taken over the course of each batch:
- The concentration of metabolites was measured through a Liquid Chromatography-Mass Spectrometry (LC-MS) analytical method. The equipment configuration was composed of Heater Electro Spray Ionization source, ORBITRAP detector (AGILENT, USA) and ZIC-pHILIC column (MERCK MILLIPORE, Germany). All standard reagents used for quantification of the 19 metabolites involved in
the process were from SIGMA ALDRICH (MERCK MILLIPORE, Germany).
- The mAb concentration (IgG) was determined by an own-developed ELISA sandwich method. In summary, 96-microwell plates were previously coated with human PD-1 and kept overnight at $4^{\circ}\mathrm{C}$. Next, the samples and the standard were added to the plates and incubated at $37^{\circ}\mathrm{C}$ for one hour. Subsequently, an anti-Human IgG antibody conjugated with alkaline phosphatase was added to the plate and incubated at $37^{\circ}\mathrm{C}$ for one hour. Then, p-Nitrophenyl phosphate substrate was added to the plate and after 30 minutes, the plates were read by means of a spectrophotometer (JASCO, Japan) at $405\mathrm{nm}$.
- Concentration of cells (X) was obtained from visual counting through optical microscopy, using the trypan blue dye exclusion method in a Neubauer chamber (MARIENFELD, Germany).
### c) Data Preparation
All batch measurements collected over time were organized in a single two-way data matrix of 756 elements in a Variable-Wise Unfolded (VWU) array, where each column is a single variable, and each row contains measurements for the variables at a specific time point in correspondence to batches [19,20]. Notation of scored samples (S) represents first number as the specific culture medium in the batch, and second number as the time instant (T) of sampling (for example, S21 score is the first sample taken at time T1 of batch run using M2). The work matrix can be seen here.
### d) Data Processing
MVDA was applied with the following sequence \[21\]:
- Use of descriptive statistic and run chart graphics for a preliminary look to the dataset in order to identify variable fluctuations, tendencies and potential correlations between them.
- Data auto-scaling standardization (ratio of centered mean and the standard deviation) in order to avoid prevalence of variables due to their magnitude.
- Use of Principal Component Analysis (PCA) for dimensionality reduction in a few independent latent variables or Principal Components (PC) in order to differentiate input variables according to their real impact on process variability and probable correlation between each other, as well as identification of score's trends.
- Use of Soft Independent Modeling of Class Analogies (SIMCA) method [22,23] to confirm differences among nutritional media according to batches progress.
- Use of Partial Least Square Regression (PLSR) to find the potential interrelation between cell and IgG concentration as output variables vs. supernatant metabolites content as input variables, focusing on data from the exponential phase of batch cell growth.
It should be noted that given the limitations to replicate experiments in this early stage of development, an internal full cross validation (leaves out only one sample at a time) procedure was applied to appraise
PLSR model ability of estimation rather than prediction, which is admissible for the purposes of the present work [21,24].
An available UNSCRAMBLER X version 10.4 software (CAMO Software AS) was used to run the above MVDA methods, which does not mean a preference among other applications.
## III. RESULTS
A first look at batch culture metabolic dataset by applying descriptive statistics and run charts showed that all measured metabolites could be relevant for the study, as they exhibit a substantial concentration variability that can potentially impact cell culture performance, also noticing certain degree of correlation between metabolites, which in some cases is considerable. Fluctuations detected in those univariate graphs also contributed to multivariate analysis subsequently.
Additionally, it is also detected a difference of magnitude among metabolites concentration, more significant in the case of Glucose and Lactate (see a summary of univariate statistic graphs here). Since other metabolites can have a greater influence even at lower proportion in the culture as known elsewhere [25], data were standardized via auto-scaling in order to assure a proper balance among variables.
### a) Characterization of Process Metabolic Progression through PCA
A model expressed in three principal components points out as a proper choice, covering around $90\%$ of data variance in calibration and about $86\%$ in validation, as shown in Figure 1a. In addition, no outliers were detected, as can be noticed in Figure 1b. Hence, such PCA model can be considered as representative of culture metabolic variability and adequate for further analysis.
 (a)
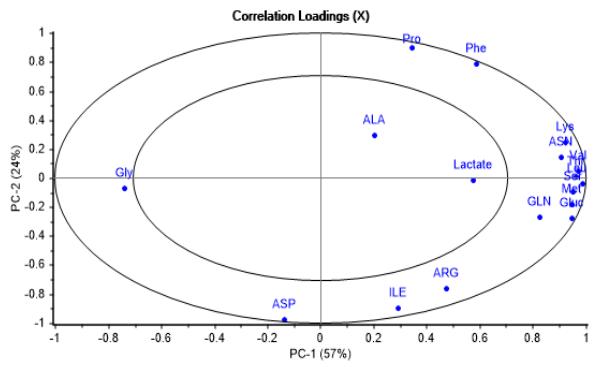
 (b) Figure 1: Explained variance and influence graphs illustrating PCA model adjustment to dataset. (a) X-Variance vs. PC's showing calibration and validation data variance properly covered by 3 PC's. (b) F-residuals vs. leverage showing no outliers From Figure 2a it can be appreciated that those metabolites consumed throughout the batches, such as Asn, Gln, Leu, Lys, Met, Ser, Thr, Val, Gluc, Pyr, and produced as Gly, can be grouped in PC-1, having correlation loadings outside the margin of $\pm 0.7$, which in regular practice is indicative of the greatest contribution to process variability. Furthermore, consumed metabolites show a strong correlation among each other.
 (a)
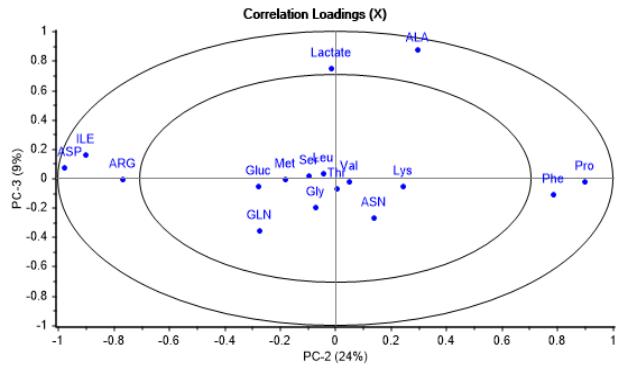 (b) Figure 2: Correlation loadings graphs. (a) Second vs. first principal component, emphasizing impact on process variability and correlation of metabolites grouped along PC-1. (b) Third vs. second principal component, showing differences in influence on process variability of other metabolites grouped along PC-2 and PC-3 On the other side, it was found that PC-2, being the second major contributor to process variability, includes other metabolites such as Phe, Pro, Arg, Ile and Asp, having a notable disparity in initial concentration due to media differences in composition, as can be seen in Figure 2b. Moreover, in the same figure is observed that Lactate and Ala metabolites, which are first produced and later consumed during the batch course, are gathered in PC-3, with a less important relative impact on cell culture variability.
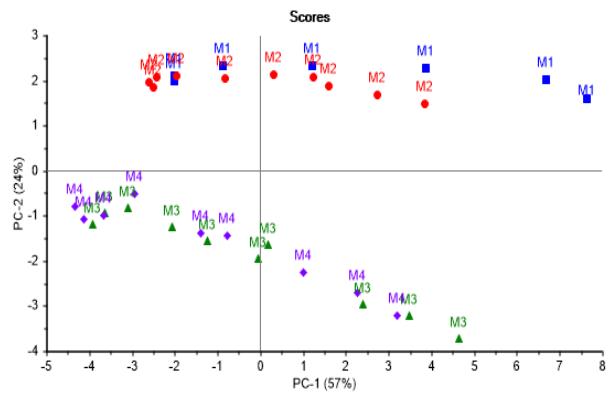
As a complement to the above, the score plot in Figure 3a shows a well-defined trajectory of the batches from right to left along PC-1 axis, with no remarkable differences in metabolites consumption or production patterns among nutritional media.
Concurrently, looking in the direction of PC-2 axis, batches using culture media M1 and M2 are very similar in tendency, as well as those using M3 and M4, both trends being distinguishable between each other. In addition, Figure 3b confirms there are metabolites first produced and later consumed, showing almost no differences in content among batches as already mentioned.
 (a)
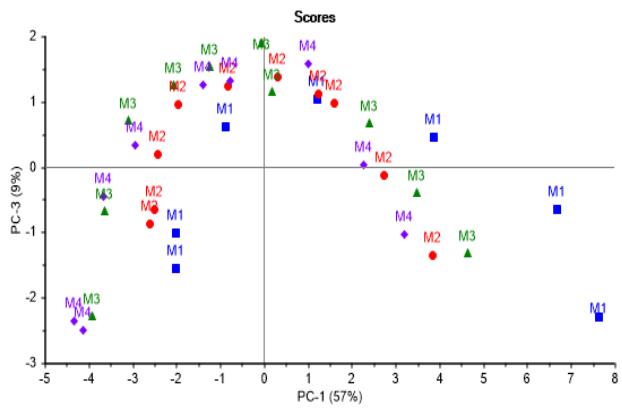 (b) Figure 3: Score graphs illustrating batches progression. (a) Second vs. first principal component showing no differences in consumption or production of metabolites among nutritional media. (b) Third vs. first principal component confirming there are metabolites first produced and later consumed with almost no difference in content among batches
A simultaneous view of both, scores and correlation loadings graphs, combined as a bi-plot in Figure 4a and Figure 4b, shows that culture samples are rich in those metabolites consumed since batches start, while Gly as the one produced, reach its higher concentration at the end of the culture.
Looking through PC-2 axis it is more evident that M1 and M2 have a significant initial content of Phe and Pro, as well as M3 and M4 in Arg, Ile and Asp.
Further, Lactate and Ala come to their highest concentration in the middle of culture batches, being corroborated its production at first and consumption later on.
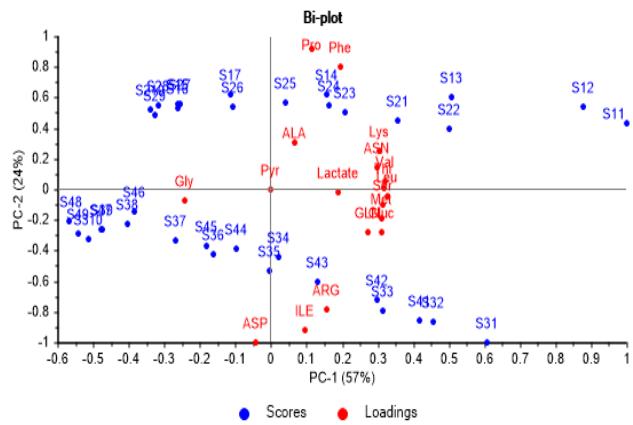 (a)
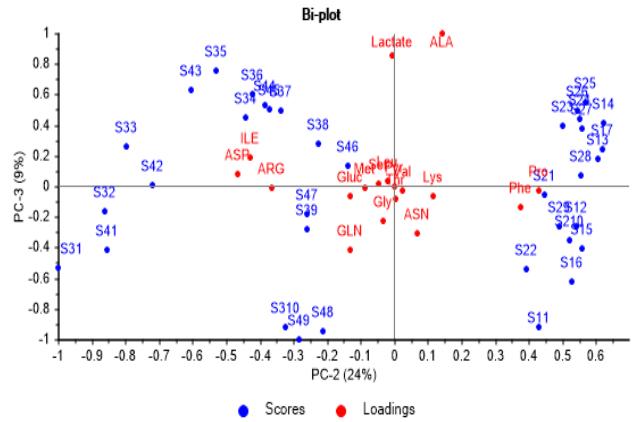 (b) Figure 4: Correlation loadings and scores biplot graphs. (a) Second vs. first principal component, showing significance of metabolites consumed and produced during the course of batches. (b) Third vs. second principal component, showing culture media have a significant content from the start in some metabolites
### b) Determining Media Differences through SIMCA Method
By requiring a more precise differentiation among culture media concerning batches performance than the one appreciated in the PCA score plot, a supervised classification method such as SIMCA was applied, using the individual PCA models of each batch.
Through the Coomans plot shown in Figure 5, it is confirmed that media M1 and M2 are segregated into different classes and at the same time are quite distinct to media M3 and M4, while the latter are rather similar. Such result is consistent with the fact that media M1 and M2 share $30\%$ of their initial composition, whereas M4 is the same medium M3 modified with some additives.
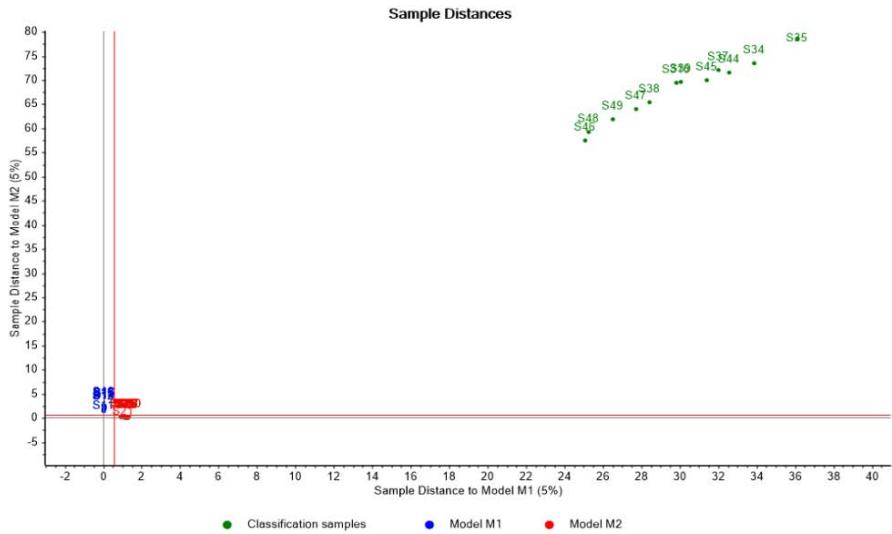 Figure 5: Coomans graph from Soft Independent Modeling of Class Analogy confirming differences among culture media relative to batches performance
### c) Determining Metabolites Influence on Cell Growth and mAb Production through PLSR
Metabolite concentrations relationship with cell and IgG concentrations was analyzed via PLSR using data from the exponential phase of batch cell growth, given its relevance in cell culture process [26]. Consequently, a logarithmic transformation of cell growth data was applied looking for an approximation to a linear behavior.
Following PLSR procedure, a Martens uncertainty test together with full cross validation was applied in order to find input variables with more significant impact on model's response [27,28]. In this regard, Figure 6a and Figure 6b show in striped-shaded bars Arg, Gln, Ile, Leu, Lys, Phe, Ser, Val and Lactate metabolites with statistically significant weighted regression coefficients, hence with a relevant influence
on cell growth and mAb generation. The rest of the metabolites can be discarded as they do not provide useful information and could lead to model overfitting.
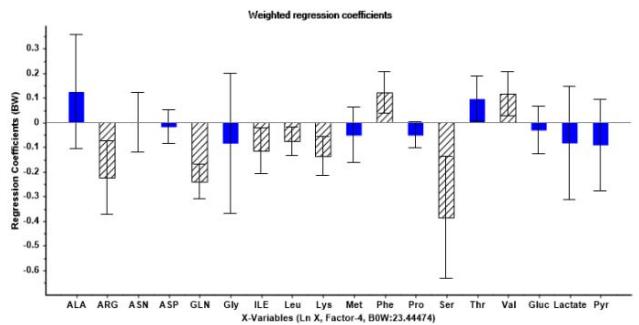 (a)
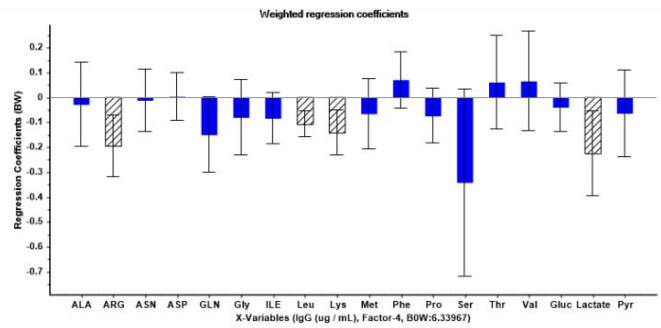 (b) Figure 6: Graphs derived from uncertainty test for four factors PLSR model. (a) Weighted regression coefficients relative to logarithmic cell concentration showing most significant metabolites in stripe-shaded bars. (b) Weighted regression coefficients relative to IgG concentration showing most significant metabolites in stripe-shaded bars
PLSR model restructured on this basis reach a proper fit by using three factors, as observed in Figure 7a and Figure 7b. In this case, model's R-Square is around $91\%$ in calibration and about $87\%$ in validation, showing good data adjustment and acceptable ability of estimation for the purposes of subsequent analysis.
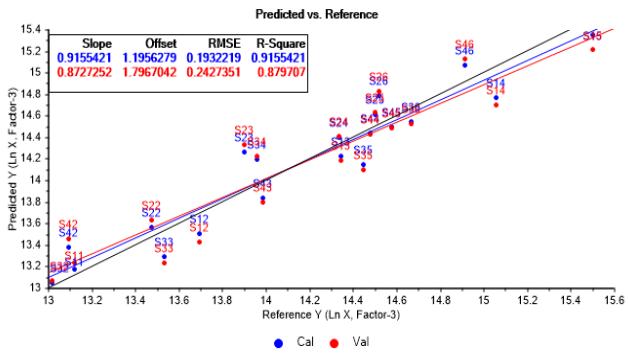 (a)
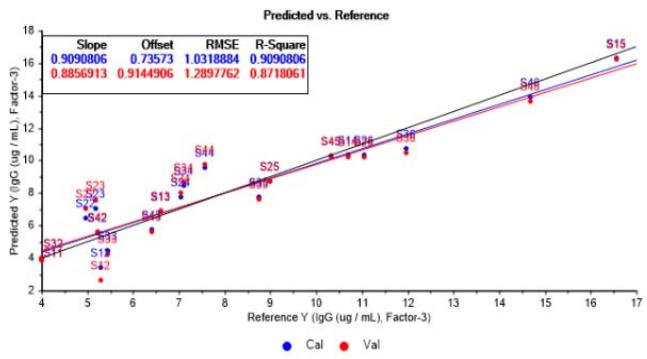 (b) Figure 7: Predicted vs. reference values graphs from PLSR model adjustment based in three factors. (a) Relative to logarithmic cell concentration. (b) Relative to IgG concentration
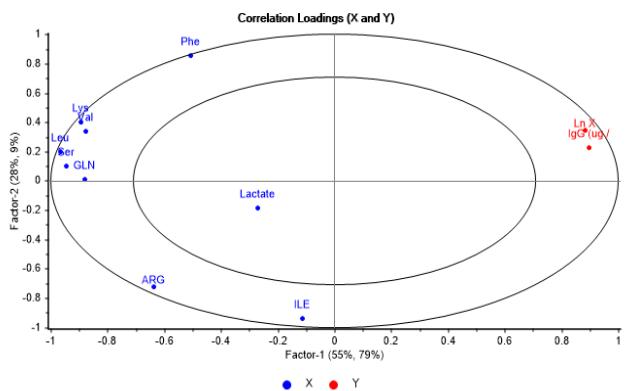
The correlation loadings $X - Y$ plots shown in Figure 8a and Figure 8b, reassert that incidence pattern of metabolites correlated with the output variables is comparable with the obtained from PCA model as well. It is also noticed that cell growth is closely interrelated to mAb generation, as evidence of a substantial interaction between them.
Complementarily, Figure 9 summarize those key metabolites influence on cell culture performance, based on Martens uncertainty test likewise.
 (a)
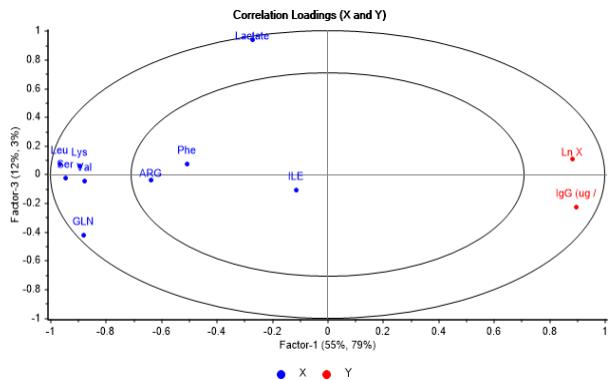 Figure 9: Influence matrix summarizing key metabolites impact on cell culture process according to weighted regression coefficients
(b)
Figure 8: Correlation loadings X - Y graphs showing metabolites incidence on logarithmic cell concentration and IgG concentration. (a) Second vs first factor. (b) Third vs. first factor From the analysis integrating both Figures 8a - 8b and Figure 9 it is inferred that metabolites linked to first factor, Lys, Leu, Ser and Gln contribute to cell growth and mAb generation as they are consumed, while Val only contributes to cell growth. In the case of those associated to second factor and related to initial concentration in media, Phe has a positive effect on cell growth, whereas Arg and Ile have a reverse effect on
both cell growth and mAb production. In view of these findings, extra experiments shall be done to consolidate knowledge on the actual influence of their initial concentrations in the culture. Concerning Lactate metabolite linked to third factor, it does not show a significant incidence on cell growth, but on mAb concentration in a negative way, which shall be discussed later.
<table><tr><td></td><td>Specific metabolic feature on cell culture variability</td><td>Cell growth</td><td>mAb production</td></tr><tr><td>Arginine</td><td>Given media difference, initially prevails in M3 and M4</td><td>-0.2859</td><td>-0.2210</td></tr><tr><td>Glutamine</td><td>Consumed during batch course</td><td>-0.2315</td><td>-0.0963</td></tr><tr><td>Isoleucine</td><td>Given media difference, initially prevails in M3 and M4</td><td>-0.2092</td><td>-0.1360</td></tr><tr><td>Leucine</td><td>Consumed during batch course</td><td>-0.1442</td><td>-0.1757</td></tr><tr><td>Lysine</td><td>Consumed during batch course</td><td>-0.1154</td><td>-0.1337</td></tr><tr><td>Phenylalanine</td><td>Given media difference, initially prevails in M1 and M2</td><td>+0.0798</td><td>+0.0297</td></tr><tr><td>Serine</td><td>Consumed during batch course</td><td>-0.2050</td><td>-0.2512</td></tr><tr><td>Valine</td><td>Consumed during batch course</td><td>-0.0842</td><td>-0.0758</td></tr><tr><td>Lactate</td><td>Produced and later consumed during batch course</td><td>-0.0237</td><td>-0.2952</td></tr></table>
As a matter of verifying model's estimation ability for cell growth and mAb production, predicted with deviation per batch graphs were obtained as shown in Figure 10a and Figure 10b, by plotting reference values along with calibration and validation computations throughout the four batches in the order of score samples. Indeed, both graphs show a proper model fit, bounded to used dataset.
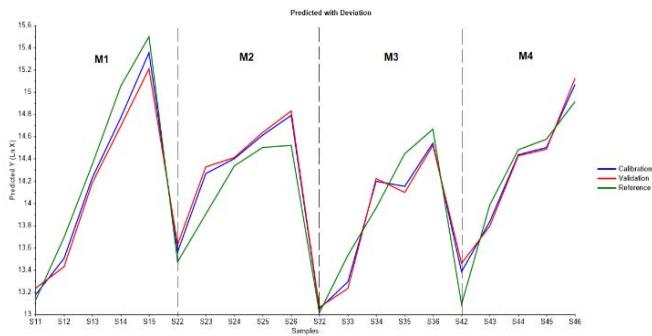 (a)
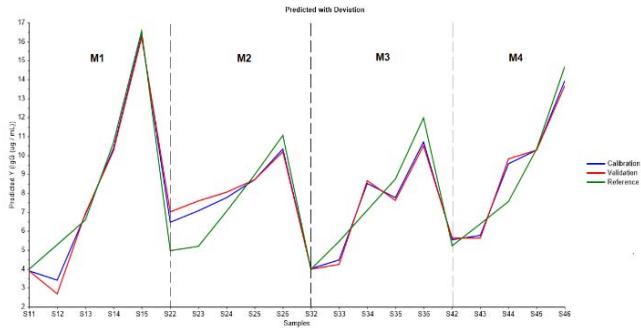 (b) Figure 10: Predicted with deviations graphs showing model's estimation ability by plotting references values, calibration and validation curves throughout the four batches in the order of score samples from M1 to M4. (a) Relative to logarithmic cell concentration. (b) Relative to IgG concentration
## IV. DISCUSSION
The above results, derived from early lab experimental work, depict the first insights into this particular cell culture system, in correspondence with its inherent metabolic complexity.
It was found that Lys, Leu, Val, Gln, and Ser metabolites have a major impact onto this cell culture process. In the case of Lys, Leu and Val, they are consistent with their role of being essential amino acids, in conformity with current knowledge so far [25]. Therefore, depletion of this substances could take place during the course of cell culture batches, and given the cells inability to produce them, the culture could end the exponential growth phase prematurely. Likewise, Gln is widely known as a key metabolite in mammalian cell culture due to its important function as a source of carbon and nitrogen, in addition to the influence it exerts in delaying cell death [29]. Concerning Ser metabolite, is also known to be relevant for cell metabolism. A deficiency on this metabolite in the culture can trigger several negative scenarios causing an imbalance in the tetrahydrofolate cycle, which is detrimental to cell growth [30]. Moreover, absence of this metabolite can bring on phosphatidylserine formation, a component involved in signaling and detection of cell death by apoptosis.
On the other hand, it was also found Arg, Ile and Phe metabolites as the second major contributors to cell culture behavior regarding their initial content in culture media. In fact, culture performance depends on cells capability to sense somehow nutrients availability at batch start, thereby stimulating the metabolic interactions that lead to primary growth and mAb generation concurrently. Hence, in the specific case of Arg and Ile it should be elucidated if their concentration at start exceeds the limit that leads to culture inhibition in further studies, which shall also include Phe in search of media optimization.
In regard to Lactate, it is well known that glucose/glutamine metabolism leads to formation and accumulation of this metabolite, which is more accentuated in cell culture batch mode [31]. Although in this cell culture system has a minor effect on cell growth, it shows a significant negative impact on mAb generation. This could be due to the potential effect of Lactate to divert cells specific metabolic pathways that subsequently lead to a decrease in its specific productivity [32].
Comparing these results with those obtained in other references, the substantial diversity and variability in CHO cell culture process is corroborated [33-35]. In some cases, a specific amino acid is relevant in a positive way, while in others is quite the opposite, or does not impact the process at all in certain cases. It may even be the case that most favorable cell culture nutritional conditions to ensure maximum cell growth may not necessarily be the best for cell productivity and product quality [36]. Thence the importance of proper culture media optimization based on cell specific nutritional profile understanding.
Given the difference among culture media derived from the above results, it can be deduced for this cell culture process that M1 provides most favorable nutritional conditions in terms of the content of those amino acids found as key contributors, followed by M4 in order. Paradoxically, from the economical point of view M1 have the highest unit cost, while M4 have the lowest. Hence, the alternative of using M4 becomes attractive if supplemented with Leu, Lys, Val and Phe in similar proportions as in M1, because it already has similar contents of Ser and Gln.
It is recognized that predictability of the MVDA models used for analysis is limited given the lack of additional data for performing an external validation. Nevertheless, the internal validation carried out on such models with the available dataset evidenced they have an adequate estimation ability to provide, in this early research, valuable insights on the cell culture system in question, thus assuring the necessary groundwork for further studies.
## V. CONCLUSION
The applied MVDA approach showed its potential by providing advanced data processing tools for achieving this study. It facilitated the understanding of metabolic variability in this particular cell culture process in batch mode at an early experimental stage, as well as disclosing the difference among culture media according to their nutritional effect on batches. In addition, the PLSR model derived from the available dataset contributed to identify those key metabolites that benefit cell growth and mAb production and those with a negative incidence, thus giving a rationale for the proper choice of culture media with most advantageous nutritional conditions. Finally, these outcomes offer the essentials needed for subsequent media optimization, which shall consolidate future scale-up studies.
Funding
This work has received funding from the European Union Horizon 2020 Research and Innovation Program MSCA-RISE-2016 under grant agreement No. 734439 INFERNET.
### ACKNOWLEDGMENTS
The authors deeply thank the contribution of Center of Molecular Immunology Research and Development Division in providing important resources and equipment, as well as the contribution of the support staff to this study. In addition, authors also thank the Core Services and Advanced Technologies at the Cancer Research UK Beatson Institute (CRUK A17196), with particular thanks to the Metabolomics Unit.
Conflicts of Interest
The authors have no conflict of interest to declare regarding this research.
Generating HTML Viewer...
References
36 Cites in Article
G Ruiz,M Moreno,M López,M Vega (2007). Anticuerpos monoclonales terapéuticos.
C Smith (2014). Scaling up your cell cultures to bioreactors.
B Swarbrick (2014). Multivariate data analysis for biotechnology, bioprocessing.
Anurag Rathore,Shachi Mittal,Mili Pathak,Arushi Arora (2014). Guidance for performing multivariate data analysis of bioprocessing data: Pitfalls and recommendations.
A Kirdar,J Conner,J Baclaski,A Rathore (2007). Application of multivariate analysis toward biotech processes: case study of a cell-culture unit operation.
A Kirdar,K Green,A Rathore (2008). Application of multivariate data analysis for identification and successful resolution of a root cause for a bioprocessing application.
Giuseppe Palermo,P Piraino,H Zucht (2009). Performance of PLS regression coefficients in selecting variables for each response of a multivariate PLS for omics-type data.
Nitish Bhushan,Sandip Hadpe,Anurag Rathore (2011). Chemometrics applications in biotech processes: Assessing process comparability.
P Roychoudhury,O' Kennedy,R Faulkner,J Mcneil,B Harvey,L (2013). Implementing multivariate data analysis to monitor mammalian cell culture processes.
Viktor Konakovsky,Christoph Clemens,Markus Müller,Jan Bechmann,Martina Berger,Stefan Schlatter,Christoph Herwig (2016). Metabolic Control in Mammalian Fed-Batch Cell Cultures for Reduced Lactic Acid Accumulation and Improved Process Robustness.
Michael Sokolov,Miroslav Soos,Benjamin Neunstoecklin,Massimo Morbidelli,Alessandro Butté,Riccardo Leardi,Thomas Solacroup,Matthieu Stettler,Hervé Broly (2015). Fingerprint detection and process prediction by multivariate analysis of fed‐batch monoclonal antibody cell culture data.
Michael Sokolov,Jonathan Ritscher,Nicola Mackinnon,Jean‐marc Bielser,David Brühlmann,Dominik Rothenhäusler,Gian Thanei,Miroslav Soos,Matthieu Stettler,Jonathan Souquet,Hervé Broly,Massimo Morbidelli,Alessandro Butté (2017). Robust factor selection in early cell culture process development for the production of a biosimilar monoclonal antibody.
Michael Sokolov,Massimo Morbidelli,Alessandro Butté,Jonathan Souquet,Hervé Broly (2018). Sequential Multivariate Cell Culture Modeling at Multiple Scales Supports Systematic Shaping of a Monoclonal Antibody Toward a Quality Target.
Anurag Rathore,Sumit Kumar Singh,Mili Pathak,Erik Read,Kurt Brorson,Cyrus Agarabi,Mansoor Khan (2015). Fermentanomics: Relating quality attributes of a monoclonal antibody to cell culture process variables and raw materials using multivariate data analysis.
O' Kennedy,R (2016). Multivariate analysis of biological additives for growth media and feeds.
Philipp Zürcher,Michael Sokolov,David Brühlmann,Raphael Ducommun,Matthieu Stettler,Jonathan Souquet,Martin Jordan,Hervé Broly,Massimo Morbidelli,Alessandro Butté (2020). Cell culture process metabolomics together with multivariate data analysis tools opens new routes for bioprocess development and glycosylation prediction.
Francesca Luciani,Sara Galluzzo,Andrea Gaggioli,Nanna Kruse,Pascal Venneugues,Christian Schneider,Carlo Pini,Daniela Melchiorri (2015). Implementing quality by design for biotech products: Are regulators on track?.
Ewan Mercer,John Mack,Furqan Tahir,David Lovett (2018). Application of Multivariate Process Modeling for Monitoring and Control Applications in Continuous Pharmaceutical Manufacturing.
Leo Chiang,Riccardo Leardi,Randy Pell,Mary Seasholtz (2006). Industrial experiences with multivariate statistical analysis of batch process data.
Kevin Dunn (2010). pid: Process Improvement using Data.
K Branden,M Hubert (2005). Robust classification in high dimensions based on the SIMCA Method.
Amc Davies,Tom Fearn (2008). Back to basics: multivariate qualitative analysis, SIMCA.
Daniel Berrar (2019). Cross-Validation.
L Carrillo-Cocom,T Genel-Rey,D Araíz-Hernández,F López-Pacheco,J López-Meza,M Rocha-Pizaña,A Ramírez-Medrano,M Alvarez (2015). Amino acid consumption in naïve and recombinant CHO cell cultures: producers of a monoclonal antibody.
De Alwis,D Dutton,R Scharer,J Moo-Young,M (2007). Statistical methods in media optimization for batch and fed-batch animal cell culture.
Amc Davies (2001). Uncertainty testing in PLS regression.
K Esbensen,B Swarbrick (2018). Multivariate Data Analysis 6th Edition.
F Ritacco,Y Wu,A Khetan (2018). Cell culture media for recombinant protein expression in chinese hamster ovary (CHO) cells: history, key components, and optimization strategies.
Andrew Salazar,Michael Keusgen,Jörg Von Hagen (2016). Amino acids in the cultivation of mammalian cells.
S Ozturk,W-S Hu (2005). Cell Culture Technology for Pharmaceutical and Cell-Based Therapies.
Sara Pereira,Helene Kildegaard,Mikael Andersen (2018). Impact of CHO Metabolism on Cell Growth and Protein Production: An Overview of Toxic and Inhibiting Metabolites and Nutrients.
Claudia Altamirano,Andres Illanes,Rossana Canessa,Silvana Becerra (2006). Specific nutrient supplementation of defined serum-free medium for the improvement of CHO cells growth and t-PA production.
Zizhuo Xing,Brian Kenty,Inna Koyrakh,Michael Borys,Shih-Hsie Pan,Zheng Li (2011). Optimizing amino acid composition of CHO cell culture media for a fusion protein production.
Fatemeh Torkashvand,Behrouz Vaziri,Shayan Maleknia,Amir Heydari,Manouchehr Vossoughi,Fatemeh Davami,Fereidoun Mahboudi (2015). Designed Amino Acid Feed in Improvement of Production and Quality Targets of a Therapeutic Monoclonal Antibody.
Nigel Jenkins,Paula Castro,Sunitha Menon,Andrew Ison,Alan Bull (1994). Effect of lipid supplements on the production and glycosylation of recombinant interferon-? expressed in CHO cells.
No ethics committee approval was required for this article type.
Data Availability
Not applicable for this article.
How to Cite This Article
Erick Hernández. 2026. \u201cDetermination of Best Nutritional Conditions for a Monoclonal Antibody-Producing Cell Line based on a Multivariate Data Analysis Approach\u201d. Global Journal of Research in Engineering - J: General Engineering GJRE-J Volume 23 (GJRE Volume 23 Issue J1).
Explore published articles in an immersive Augmented Reality environment. Our platform converts research papers into interactive 3D books, allowing readers to view and interact with content using AR and VR compatible devices.
Your published article is automatically converted into a realistic 3D book. Flip through pages and read research papers in a more engaging and interactive format.
Our website is actively being updated, and changes may occur frequently. Please clear your browser cache if needed. For feedback or error reporting, please email [email protected]
Thank you for connecting with us. We will respond to you shortly.