Development of a Urinary Screening Method, a Urinary Quantitative Confirmatory Method and Metabolic Profiling of the Semi-Synthetic Cannabinoid Hexahydrocannabinol in Humans Using UPLC-MS-QToF and UHPLC-MS/MS
## I. INTRODUCTION
The recreational use of preparations of the flowering or fruiting top of Cannabis sativa has been internationally controlled since 1961 in Article 1 of the Single Convention on Narcotic Drugs (1). Despite all the legislative efforts, cannabis is the most popular and widely used recreational drug according to the 2022 World Drug Report of the United Nations Office on Drugs and Crime (2). However, to circumvent legislation, new compounds having cannabinoidsimetic effects have emerged in the last decades. From the 2000s, different series of highly potent synthetic cannabinoids have been appearing and disappearing on the drug market. The abuse of these compounds have become widespread due to their low price, strong psychoactive effect and the lack of legal control, (3). The introduction of the 2018 Farm Bill resulted a significant change in the composition of the cannabinoid market. It led to the overproduction of phytocannabinoids, like CBD, in the US. The overproduction of their precursor led to the rapid spread of newly emerging, uncontrolled, semi-synthetic cannabinoids, like $\Delta 8$ -THC, HHC or their analogues (4). HHC was first reported to the European Monitoring of Drug and Drug Addiction (EMCDDA) in Denmark in August 2022 (5). By April 2023, 20 EU Member States have detected the substance. In April 2023, the EMCDDA released an extensive and detailed Technical Report on the rapidly emerging semi-synthetic cannabinoids (6).
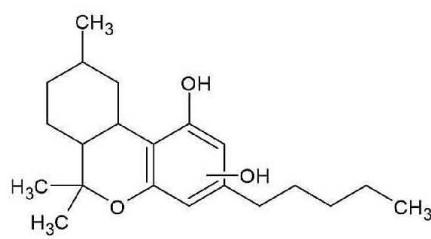
Hexahydrocannabinol can be found naturally in trace amounts in Cannabis sativa. However, the large-scale production of HHC uses phytochemical precursors like CBD from hemp extracts. Hemp-derived cannabidiol (CBD) is converted into a mixture of (9R)-HHC and (9S)-HHC epimers by simple chemical transformations like cyclization and catalytic hydrogenation. There are three stereogenic carbon atoms in HHC (6a, 9, 10a), resulting theoretically eight epimers, but only the (6aR, 9R, 10aR)-HHC and the (6aR, 9S, 10aR)-HHC isomers have appeared so far (7), scientific studies focus on these isomers. Pharmacological studies indicate that only the (9R)-HHC isomer has cannabinimetic psychoactive effects. This is explained by the spatial position of the C-11 methyl group being equatorial, so it is located in the plane of the quasiplanar alicyclic system, just similar to the C-11 methyl group of $\Delta 9$ -THC. The (9S)-HHC isomer has an axial C-11 methyl group pointing out of the plane of the quasiplanar alicyclic system, resulting in the loss of receptor binding affinity and the loss of psychoactive pharmacological effects (8).
A comprehensive review from Istvan Ujvárysummarises several UPLC-MS/MS, GC-MS, GC-MS/MS, TLC, IR, NMR methodologies for the structure identification of HHC in different matrices (4). Most of them are focused on the determination of the parent compounds. Baseline separation of the two epimers can be achieved with all techniques allowing quantitative analysis.
Forensic toxicology is highly based on urine analysis, it is essential to identify suitable urinary biomarkers of hexahydrocannabinol consumption and monitor them. Therefore, it is equally important to study the excretion profile, the metabolism and the pharmacology of these compounds. However human metabolism studies and analytical methods for investigating HHC metabolites in human urine are lacking or controversial. Due to the lack of adequate analytical methods to detect HHC in biological matrices, actual intoxication cases have not yet been reported, and the harmful potential of HHC was not described (9).[^9]
This study aims (I) to present an analytical method for screening HHC metabolites in human urine; (II) to investigate the Phase I HHC metabolites by performing in vitro and in vivo metabolite identification studies of human liver microsome (pHLM), S9 fraction (pS9) and urine samples; (III) and to present a quantitative confirmatory method optimized by the investigation of authentic urine samples.
1. The screening method was developed by optimizing a glucuronic acid conjugated carboxy-metabolite on a Shimadzu LCMS-8040 triplequadrupole mass spectrometer, based on a (9R)-HHC self-administration urine sample after the sample had been investigated and the metabolite had been tentatively identified on a Waters Xevo G2-XS QToF system. The QToF method had been transferred to the triple quadrupole system. After the optimized MRM-transitions of the glucuronic acid conjugated carboxy-metabolite were added to the routine LCMS/MS screening method, the authentic urine samples screened positive for the HHC-metabolite by the LC-MS/MS analysis and confirmed positive for the HHC parent compound by the QToF analysis were collected and used for the metabolic profiling
assay and the development of routine confirmatory analysis.
2. The analytical strategy for metabolic profiling was described in detail in our previous work (10). Based on the analysis of urine samples from users $(n = 11)$ as positive controls, blank urine samples as negative controls, pooled human liver microsome (pHLM), and pooled S9 fraction (pS9) samples in vitro, using a Waters XevoG2-XS QToF MS and UPLC in $\mathsf{MSe}^{\mathrm{e}}$ mode, phase I metabolites were investigated and ranked according to their relative abundance. UNIFI software (Waters Corporation) was applied to search for metabolites and to localize the metabolic transformations. The localization is based on the fragmentation pattern induced by high energy collision.
3. The development of the routine confirmatory analysis on a Shimadzu LCMS-8050 triple quadrupole mass spectrometer was based on the quantitation of the commercially available reference standard of (9R)-11-COOH-HHC and the investigation of its glucuronide conjugated form that was produced in vitro from the commercially available reference standard of (9R)-11-COOH-HHC. Urine samples from HHC users $(n = 31)$ were hydrolyzed in three ways and quantified. The presence of the glucuronide form and the concentration of the unconjugated form determined the efficiency of each hydrolysis method. Besides, the urinary concentration level to be monitored for (9R)-11-COOH-HHC was determined using the most efficient hydrolysis method. The extraction method was developed according to the sensitivity of the LC-MS/MS and the required concentration level.
## II. MATERIALS AND METHODS
### a) Reagents and chemicals
The Department of Drug Investigation of Hungarian Institution of Forensic Sciences provided the reference standard containing the mixture of (9R)-HHC and (9S)-HHC. Based on the exact molecular mass, the exact mass of generated fragments, and observed retention time that had been set based on the reference standard (9R)-HHC was identified in the jelly gum purchased under the name 'HHC Premium Gummies' from Eighty8 (Czech Republic), that was used for self-administration. The extracted ion chromatograms belonging to the protonated HHC molecules are illustrated in Figure 1. (9R)-11-COOH-HHC reference standard (1 mg; purity: ≥98%) was purchased from Cayman Chemicals. Incubation reagents [superoxide dismutase enzyme, UGT-system (Solution A and B), NADPH-regenerating system (Solution A and B), 0.5 M potassium phosphate buffer (pH 7.4)] were purchased from Corning (New York, USA). Abalonase ULTRA hydrolysis enzyme kit, Escherichia coli $\beta$ -D-glucuronidase IX-A hydrolysis enzyme and Biotagelsolute C18 SPE-cartridge (200 mg, 3 mL) was obtained from Shimkon Corporation (Budapest, Hungary). Leucine Enkephalin for Lockspray solution was obtained from Waters Corporation (Milford, USA) as a lyophilized peptide. Solvents [methanol, acetonitrile, ultrapure water, formic acid (LC-MS grade), acetic acid (100%)], KOH, KCl, and $\mathrm{MgCl}_2$ were purchased from Merck (Taufkirchen, Germany). Pooled human S9 fraction (pS9, 50 donors) and pooled human liver microsomes (pHLM, 50 donors) were purchased from Corning (New York, USA) and stored at -80°C until use.
# b) In
First, to tentatively identify a carboxylic acid metabolite in the self-administration urine to develop an appropriate screening method, and second, after identifying HHC-positive authentic urine samples, to investigate the metabolic profile of HHC, in vitro experiments with pHLM and with pS9 were performed. Both experiments were performed in five replicates where the fifth reaction mixtures lacked the substrate compound and were analyzed as blank in vitro samples. The reaction mixture consisted of either (i) pHLM $(5\mu L, 20\mathrm{mg/mL})$, NADPH-regenerating system - Solution A $(5\mu L)$ and Solution B $(1\mu L)$, superoxide dismutase $(10\mu L, 3\mathrm{kU/mL})$ and potassium phosphate buffer $(20\mu L, 0.5\mathrm{M}, \mathrm{pH}7.4)$ in $60\mu L$ water, or (ii)pS9 $(10\mu L, 20\mathrm{mg/mL})$, NADPH-regenerating system - Solution A $(5\mu L)$ and Solution B $(1\mu L), K/Mg$ solution $(2\mu L, 8\mathrm{mM}\mathrm{MgCl}_2$ and $33\mathrm{mM}$ KCl) and potassium phosphate buffer $(20\mu L, 0.5\mathrm{M}, \mathrm{pH}7.4)$ in $60\mu L$ water. $1\mu L$ of the parent compound $(10\mathrm{mg/mL}$ in methanol) was added and incubated for $120\mathrm{min}$ at $37^{\circ}\mathrm{C}$. $300\mu L$ ice-cold acetonitrile was added to terminate the reaction. After centrifugation (14500 rpm, $4^{\circ}\mathrm{C}$ ), the supernatant was analyzed with the LC-MS-QToFMS<sup>e</sup> method.
### c) Urine samples from a volunteer consumer and the development of a screening method
A 38-year-old female volunteer consumed one piece of the jelly gum called 'HHC Premium Gummies' from Eighty8, reported to contain '25 mg HHC/piece'. The methanol extract of the jelly gum was analyzed with LC-MS-QToF. The exact molecular mass, the exact mass of generated fragments and retention time had already been set based on the hexahydrocannabinol reference standard. (9R)-HHC was identified in the jelly gum.
First, 5-5 ml aliquots of collected urine samples from the volunteer consumer (0-8 h and 8-16 h) were hydrolyzed by Abalonase ULTRA hydrolysis enzyme and extracted by solid phase extraction (Isolute C18 SPE-cartridge, 200 mg, 3 mL) applying a 25-fold concentration. The concentrated extracts and the in vitro samples were analysed with LC-MS-QToF to identify a carboxylic acid metabolitentatively and to recognise its retention time. In the next step, the chromatographic analysis applied on the LC-MS-QToF was transferred to the LC-MS/MS used for screening. The retention time and the mass of the parent ion of the carboxylic acid metabolite was known from the QToF identification. So automatic MRM-optimization supported by chromatographic separation could be applied to the LC-MS/MS. By the optimised MRM-transitions, the retention time for the carboxylic acid metabolite could be determined for the screening analysis on the LC-MS/MS as well.
Second, to $100 - 100\mu L$ aliquots of collected urine samples from the volunteer consumer (0-8 h and 8-16 h), $300~\mu \mathrm{L}$ ice-cold acetonitrile was added, and after centrifugation (14500 rpm, $4^{\circ}C$ ), the supernatant was analyzed by the LC-MS/MS applying the chromatographic method used for screening and the optimized MRM-transitions for the carboxylic acid metabolite. However, the MRM-transition peak in these unhydrolyzed samples was supposed to belong to the glucuronic acid conjugate of the above analyzed carboxylic acid metabolite. The retention time and the mass of the parent ion of the glucuronide-conjugated carboxylic acid metabolite was determined in the unhydrolyzed samples. Soits automatic MRM-optimization supported by chromatographic separation could also be applied.
The optimised MRM-transitions and appropriate retention time data for the glucuronic acid conjugate of a carboxylic acid metabolite was introduced in the routine qualitative screening method for illicit drugs and new psychoactive substances.
All steps of the automatic MRM-optimization process supported by chromatographic separation for the two metabolites on the LC-MS/MS system are illustrated in Figure 2.
### d) Authentic urine samples for metabolic profiling and the development of a routine confirmatory method
Urine samples analysed in this study, have been submitted to our laboratory for forensic drug analysis. They were stored at $4^{\circ}\mathrm{C}$ until analysis.
The optimised MRM-transitions of the mentioned glucuronide-conjugated carboxy-metabolite and its retention time were imported into the routine screening analysis for new psychoactive substances and other common drugs of abuse. All urine samples submitted to our laboratory for forensic drug analysis were screened by this improved method using liquid chromatography with tandem mass spectrometry (LC-MS/MS) from April 2023.
Samples were only used for further experiments if the HHC-metabolite positive screening was followed by HHC-epimer positive confirmation. The presence of the HHCepimers was confirmed in highly concentrated samples using liquid-chromatography in conjunction with high-resolution mass spectrometry (LC-MS-QToF).
Eleven urine samples analysed in the metabolismstudy and thirty-one urine samples used in the development of a routine confirmatory method were screened positive for the optimised glucuronide-conjugated metabolite. All were confirmed positive for HHC epimers. One analyte-free urine sample was obtained from a person who had not taken any drugs or medication and who was screened and confirmed negative for the optimized glucuronide conjugate of the (9R)-HHC-carboxylic acid metabolite and HHC epimers, respectively.
### e) Instrumentation and sample preparation
## i. The LC-MS/MS screening method
In the Department of Forensic Toxicology at the Hungarian Institute of Forensic Sciences, a routine qualitative screening analysis is applied for new psychoactive substances and other common drugs of abuse. This LC-MS/MS method, monitoring 362 compounds, is described in detail in our previous work (10). This screening method was improved in this present work. MRM-transitions were optimised for the appropriate HHC metabolites and they were imported into the analysis method.
## ii. The LC-MS-QToF qualitative confirmatory method and metabolic profiling method
In the confirmatory method, 1 ml aliquots of urine samples were hydrolyzed with Abalonase ULTRA hydrolysis enzyme according to the application guide. 1 mL of 1:9:2.5 (v/v/v) hydrolysis buffer/water/hydrolysis enzyme solution was added to 1 mL aliquots of urine samples and incubated for 30 min at $60^{\circ}\mathrm{C}$. Our routine extraction method developed for the extraction of cannabinoids from blood was used for the qualitative confirmation of HHC consumption. 2 mLacetonitrile and 3 mL of 0,01 M HCl-solution were added to 1 mL aliquots of urine or blood samples and vortexed. The solid phase extraction procedure on Biotagelsolute C18 SPE-cartridges was done by the Automated Biotage Rapid Trace SPE-Workstation System. Sample was loaded to column with 1 mL/min flow rate after column activation with 1 mL methanol and conditioning with 1 mL 0.01M HCl-solution. After washing the column with 1 mL water and drying under nitrogen gas for 10 minutes, the analyte was collected by elution with 2.4 mL 2:1 (v/v) hexane/ethyl-acetate with 1 mL/min flow rate. Five replicates of each sample were extracted. The five extracts were united at the end of the SPE procedure. The extraction solvent was vaporized, and the united extracts were reconstituted into 200 μL 1:1 (v/v) methanol/water.
For the metabolic profiling study, in vitro samples were precipitated with acetonitrile. Authentic urine samples were extracted by the above characterised HHC confirmatory extraction method.
Extracts were analyzed using a Waters ACQUITY I-Class UPLC system coupled with a Xevo G2-
XS QToF system from Waters Corporation. Chromatographic parameters of the Forensic Toxicology Application developed by Waters Corporation for LC-MS-QToF were applied. The details of the chromatographic separation and the working conditions of the high-resolution mass spectrometer were presented in our previous work (10). UNIFI software performed the high-resolution data processing.
## iii. The LC-MS/MS quantitative confirmatory method
The routine quantitative confirmation of HHC consumption is based on the quantitation of (9R)-11-COOH-HHC, since its reference standard is commercially available. However, this metabolite is supposed to be excreted in a conjugated form to a high extent, similarly to THC- and CBD-metabolites. Therefore, in order to have a correct quantitation of the unconjugated form, first, an efficient hydrolysis is essential.
Three hydrolysis methods were compared. Four aliquots of the thirty-one authentic urine samples proved positive for HHC were used. In case of three aliquots the following three hydrolysis methods were applied. One aliquote remained unhydrolyzed. Ice-cold acetonitrile containing two internal standards was added in 3:1 (v/v) ratio to the urine samples. The supernatant was analysed after centrifugation at 14500 rpm at $4^{\circ}\mathrm{C}$.11-nor- $\Delta9$ -tetrahydrocannabinol-9-carboxylic acid-D3 and 11-nor- $\Delta9$ -tetrahydrocannabinol-9-carboxylic acid glucuronide-D3 were used as internal standards.
### 1. Abalonase ULTRA enzyme hydrolysis
100 μl aliquots of urine samples were hydrolyzed with Abalonase ULTRA hydrolysis enzyme according to the recommendations. 100 μlof 1:9:2.5 (v/v/v) hydrolysis buffer/water/hydrolysis enzyme solution was added to 100 μl aliquots of urine samples and incubated for 30 min at $60^{\circ}\mathrm{C}$.
#### 2. Escherichia coli $\beta$ -D-glucuronidase IX-A enzyme hydrolysis
100 μl aliquots of urine samples were hydrolyzed with Escherichia coli β-D-glucuronidase IX-A hydrolysis enzyme according to the recommendations. 6 μl of hydrolysis enzyme was added to 100 μl aliquots of urine samples and incubated for 90 min at $37.5^{\circ}\mathrm{C}$.
#### 3. Alkaline hydrolysis
100 μl aliquots of urine samples were hydrolyzed with alkaline hydrolysis. 5 μl of 10 M KOH was added to 100 μl aliquots of urine samples and incubated for 15 min at $60^{\circ}\mathrm{C}$. After the incubation, 7 μL of 100% acetic acid was added to each aliquot.
The comparison of the efficiency of the different hydrolysis methods had two aspects: (9R)-11-COOH-HHC was quantified and the presence of (9R)-11-COOH-HHC-glucuronide was monitored. The calibration points were $25\mathrm{ng / mL}$, $50\mathrm{ng / mL}$, $100\mathrm{ng / mL}$, $250\mathrm{ng / mL}$ and $500\mathrm{ng / mL}$.
The LC-MS/MS method for cannabinoids was used for the routine quantitative confirmation of HHC consumption. Ice-cold acetonitrile containing two internal standards was added in 1:3(v/v) to the hydrolysed samples. The supernatant was analysed after centrifugation (14500 rpm, $4^{\circ}\mathrm{C}$ ). 11-nor- $\Delta$ 9-tetrahydrocannabinol-9-carboxylic acid -D3 and 11-nor- $\Delta$ 9-tetrahydrocannabinol-9-carboxylic acid glucuronide-D3 were used as internal standards.
Extracts were analysed using a Nexera UPLC coupled with an LCMS-8050 Triple Quad mass spectrometer from Shimadzu. Chromatographic separation was identical to the above mentioned screening method.
The triple quadrupol mass spectrometer was equipped with an electro spray ionisation source. The mass spectrometer can work in positive (ESI+) or in negative (ESI-) ionisation mode. The ionisation mode depends on the optimised MRM-transition. The interface temperature was $250^{\circ}\mathrm{C}$, the heat block temperature was $300^{\circ}\mathrm{C}$, the DL temperature was $250^{\circ}\mathrm{C}$ and the desolvation temperature was $444^{\circ}\mathrm{C}$. Nitrogen was used as drying gas and nebulizing gas. Argon was used as collision gas.
Acquiring(9R)-11-COOH-HHC and its glucuronide conjugated form was performed in positive MRM mode. The precursor ion of (9R)-11-COOH-HHC is m/z 347.40, the quantifier product ion is m/z 193.25, the qualifier product ions are m/z 121.35 (with reference ion ratio $66.39\% \pm 30\%$ ) and m/z 207.30 (with reference ion ratio $50.41\% \pm 30\%$ ) with event time of 0.016 sec. The set time window is 5.900 min - 6.500 min. According to the optimized fragmentation, in case of (9R)-11-COOH-HHC-glucuronide, the precursor ion is m/z 523.40, the quantifier product ion is m/z 347.40, the qualifier product ions are m/z 329.30 (with reference ion ratio $18.69\% \pm 30\%$ ) and m/z 207.30 (with reference ion ratio $26.36\% \pm 30\%$ ) with event time of 0.016 sec. The set time window is 5.200 min - 5.800 min. Data processing was performed using Lab Solutions software.
## III. RESULTS AND DISCUSSION
# a) The
Figure 2. shows the steps of the optimisation process for the fragmentation of the carboxy-metabolite. This metabolite and its glucuronide-conjugated form were identified in the self-administration urine by high resolution mass spectrometry analysis. The MRM-transitions of the glucuronide-conjugated carboxylic acid metabolite were imported into the routine urinary screening analysis. Acquiring the fragment ions of the glucuronide-conjugated carboxylic acid metabolite was performed in positive MRM mode. According to its optimised fragmentation, the precursor ion is m/z 523.20, the quantifier product ion is m/z 347.10, the qualifier product ions are m/z 329.30 (with reference ion ratio $25.23\% \pm 30\%$ and m/z 207.00 (with reference ion ratio $49.85\% \pm 30\%$ with event time of 0.016 sec. The set time window is 5.100 min - 5.500 min. Data processing was performed using Lab Solutions software.
From April 2023 to June 2023, 2118 urine samples were screened in our laboratory for forensic drug consumption, and nine authentic urine samples were screened positive for the glucuronide conjugated carboxylic acid metabolite. All were qualitatively confirmed by identifying the parent compounds by the QToF analysis. The nine authentic samples and the two self-administration samples were investigated in the metabolic profiling assay.
From April 2023 to September 2023, 5012 urine samples were submitted to our laboratory for forensic drug analysis. Twenty-nine authentic urine samples were screened positive for the glucuronide-conjugated carboxylic acid metabolite. All were qualitatively confirmed by identifying the parent compounds by the QToF analysis. These twenty-nine samples and the two self-administration samples were investigated in the development of a quantitative confirmatory analysis.
### b) The metabolic profiling assay
## i. Analytical strategy for metabolic profiling
UPLC-HRMS $\mathsf{MSe}$ data was processed by UNIFI software in the following way.
First, the 'Transformations' tool of UNIFI software offers a list of possible metabolic transformations. Based on literature data, the metabolic profile of similar compounds, and the structure of HHC, the following biotransformations were selected: reduction (+H2, Phase I), oxidation (+O, Phase I), desaturation (-H2, Phase I), deethylation (-C2H4, Phase I), carboxylation (-H2+O2, Phase I). The software generated the chemical formula of all the potential metabolites that might be formed from the parent compound by these transformations and their combination.
Second, the protonated molecule of these possible metabolites might be detected in the low collision energy channel of the $\mathrm{MSe}^{\mathrm{e}}$ acquisition. Therefore, extracted ion chromatograms for these ions with a mass window of 20 ppm were automatically generated. All chromatographic peaks in the low collision energy data and the high collision energy spectra belonging to these peaks were investigated by the software.
In the third step, all chromatographic peaks were filtered for mass error being between -5 ppm and +5 ppm and the results of the positive control samples were compared to the blank and the in vitro samples. In case, the chromatographic peak was not detected in the blank samples and mass accuracy is appropriate, the peak was accepted as a possible metabolite and the high collision energy spectrum had to be analysed.
The high collision energy channel of the $\mathrm{MS}^{\mathrm{e}}$ acquisition is practically the fragmentation pattern of the molecule. These spectra were also automatically processed. It means that the chemical formula of the fragments was calculated from their accurate mass and the software suggested a structure for the fragments based on their chemical formula and the parent compound. Only one transformation could be automatically processed and localized by the software. Therefore, in silico suggestion for the structural formula of the entire molecule was provided only for metabolites generated from one biotransformation. Therefore, the detailed analysis of the estimated chemical formula of the fragments was the following step. In case the fragmentation pattern was obvious, the position of the metabolic transformation could be determined, and the structure of the potential metabolite was suggested.
Following these steps, the extracted ion chromatograms belonging to the protonated molecule of the potential metabolites based on the expected biotransformations and their combination with a mass window of 20 ppm, the high collision energy MS/MS spectra belonging to the integrated peak on the extracted ion chromatograms, the estimated structure of the fragments identified in the fragmentation pattern and the estimated structure of the possible metabolite based on the estimated structure of the identified fragments are illustrated on Figure 3., 4., 5. and Table 1., 2., 3., 4., 5.
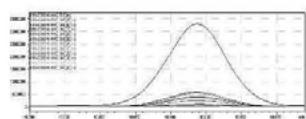
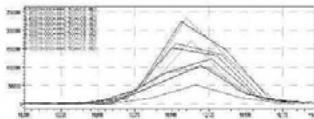
Based on retention times and molecular structure, ionization efficiency can change due to matrix effects (11, 12). However, concerning each ionization technology, a general prevalence and relative abundance of metabolites can be provided by comparing MS peak areas. Figure 6. and 7. summarize the relative amount of the 13 metabolites and the HHC epimers detected in the eleven urine samples from HHCusers, in the in vitrop HLM and in the in vitro pS9 samples. The relative abundances were calculated by averaging the ratio of the areas of each compound related to the most prevalent compound in each sample.
## ii. Fragmentation pathway of (9R)-HHC and (9S)-HHC
Figure 8. shows the structure and fragmentation pattern of the two HHC epimers, (9R)-HHC and (9S)-HHC, based on the conformation of the C-11 methyl group. Table 6. shows the elemental composition, the estimated structure and the observed m/z with the mass error in ppm of the 12 most intensive high energy fragments generated from the two HHC epimers. The most intensive product ions are identical and all correspond to the stable alicyclic system of the parent compound. However, the difference in the retention time of the two epimers assures the specific identification of the two compounds.
## iii. Metabolite identification
### Metabolite identification was based on
- the extracted ion chromatograms of the protonated molecule of the potential metabolites based on the expected biotransformations and their combination with a mass window of 20 ppm (Figures 3., 4., 5.)
- the high collision energy MS/MS spectra belonging to each integrated peak on the extracted ion chromatograms (Figures 3., 4., 5.)
- the estimated structure of the fragments identified in the fragmentation pattern (Tables 1., 2., 3., 4., 5.)
The estimated structure of a metabolite was presented in Figures 3. and 5., if the identified fragments belonging to that metabolite were unambiguously defined.
iv. The oxidised $[HHC + O]$ metabolites(Figure 3. and Tables 1., 2., 3.)
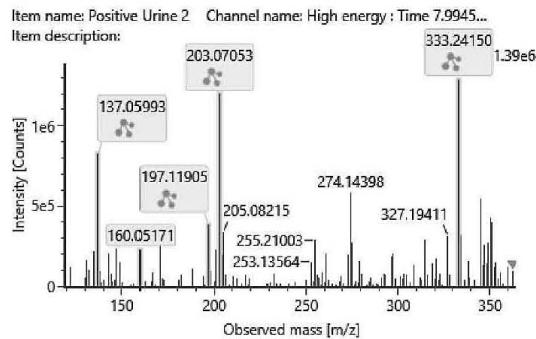
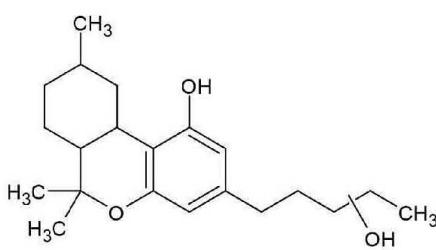
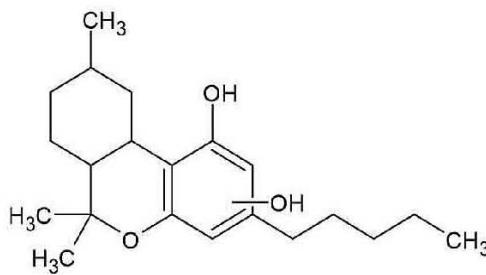
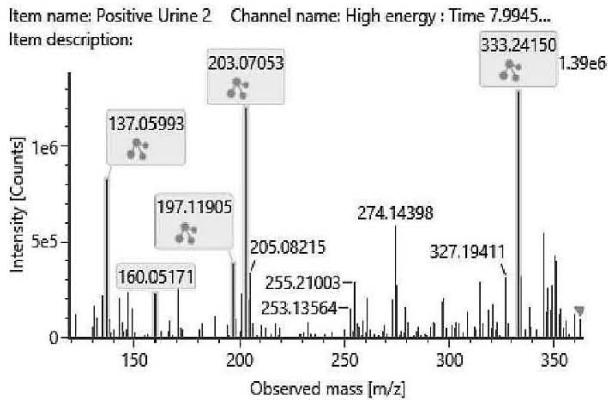
M01: The molecular formula of M01 (m/z 333.2422; C21H32O3) corresponded to oxidation. The most intense product ion at m/z 203.0705 corresponding to C12H11O3, and the product ion at m/z 197.1190 corresponding to C11H13O3 indicated that all the three oxygen atoms are connected to or part of the chroman ring. It means the oxidation might be on the C-2 or the C-4 methyl-group.
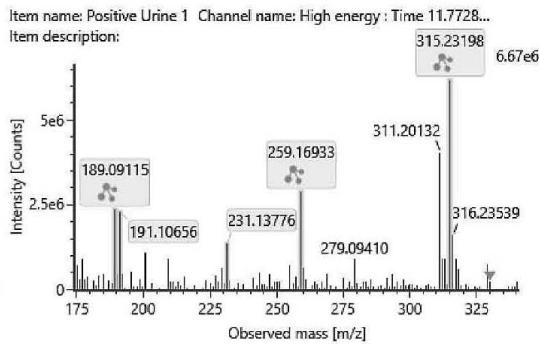
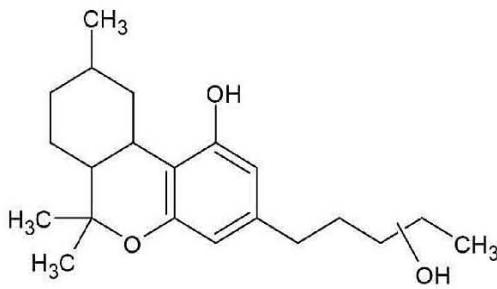
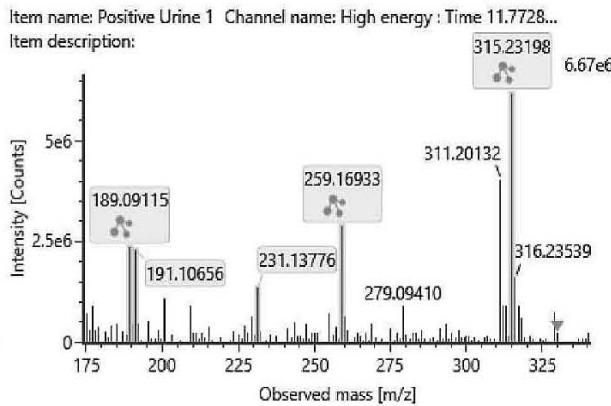
M02 – M05: The coeluting peaks of M02, M03, M04 and M05 were observed at m/z 333.2422 corresponding to C21H32O3suggesting an oxidation. The observed fragmentation indicated that the hydroxyl group was on the alkyl side chain, since the most intensive products at m/z 259.1693 (C17H23O2)and at m/z 231.1377 (C15H19O2) reveal that the hexahydrobenzochromene three-ring system has only two oxygen atoms. It means the oxidation might be on the C-1', C-2', C-3', C-4' or the C-5' carbon of the n-pentyl side chain.
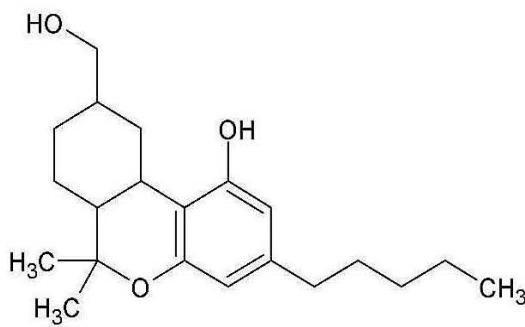
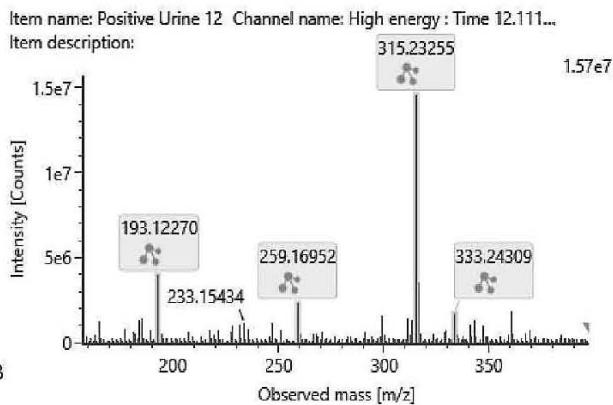
M06: M06 was detected at m/z 333.2422 (C21H32O3) corresponding to an oxidation. Product ion at m/z 193.1227 (C12H17O2)excludes the oxidation of the chroman ring and the n-penthyl side chain. Product ion at m/z 259.1695 (C17H23O2) excludes the oxidation of the three-ring system. Therefore, the oxidation might be on the C-11 methyl-group.
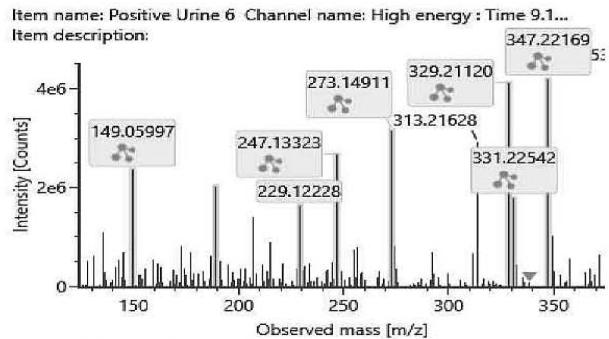
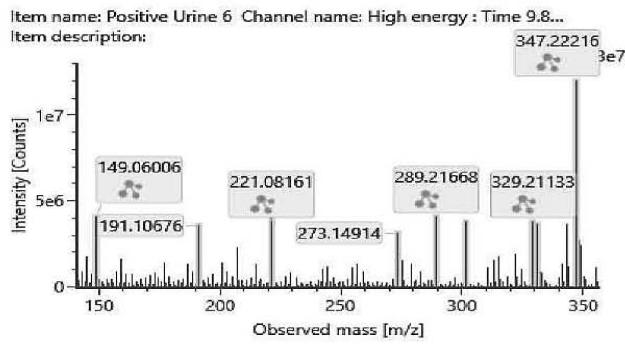
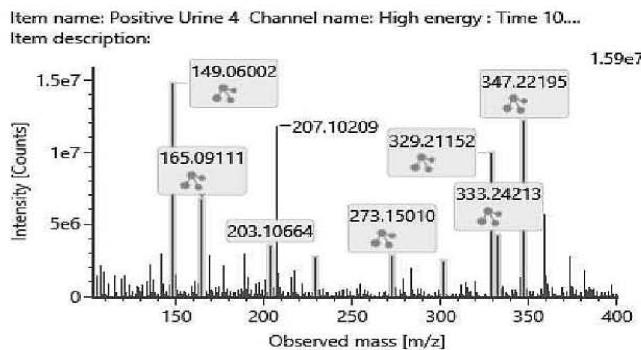
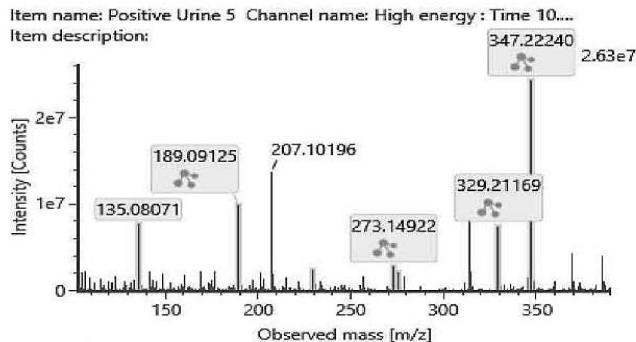
v. The carboxylated $[HHC-H2 + O2]$ metabolites (Figure 4. and Table 4.)
The fragmentation patterns of the carboxylated metabolites are very similar. The product ions are identical. Only their ratio might be specific for the metabolite. Therefore, the exact structure of most carboxylated metabolites and the location of the metabolic transformation could not be determined. Table 4. lists the elemental composition, the possible structure and the observed exact mass of the most intensive, unspecific high energy fragments generated from the carboxy-metabolites. Figure 4. shows the high energy spectrum and the chromatogram of the metabolites. Only two of them could be tentatively (M07) or unambiguously (M11) identified.
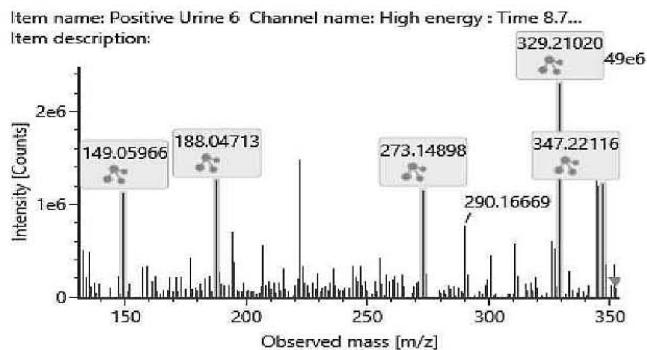
M07: The molecular formula obtained for M07 (m/z 347.2219; C21H30O4) corresponds to a carboxylated metabolite. Product ion at m/z 188.0471 (C11H8O3) suggests the carboxylation was on one of the geminal methyl groups on the hexahydrobenzochromene core.
M11: M11 was proved to be (9R)-11-COOH-HHC by investigating the commercially available reference standard.
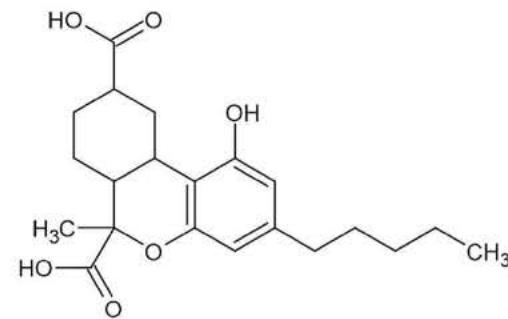
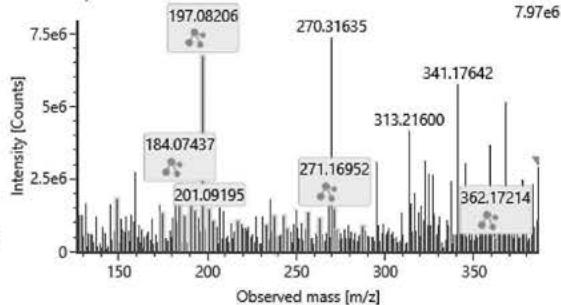
vi. The double carboxylated $[HHC + 2(-H2 + O2)]$ metabolite (Figure 5., Table 5.)
M13: M13 corresponds to a double carboxylated metabolite based on its elemental composition (m/z 377.1997; C21H28O6). Product ions m/z 197.0820 (C10H13O4), m/z 184.0743 (C9H12O4) and m/z 237.1125 (C13H17O4) contain four oxygen atoms, relatively few carbon atoms and a relatively higher number of hydrogen atoms. This strictly determines the possible conformation of the product ions based on the structure of the parent compound. The only possible conformation of the metabolite according to these product ions with four oxygens is the double carboxylated, C-11-carboxy- and C-12- or C-13-carboxy-HHC.
Reference standards are essential for further confirmation to compare the retention time and fragmentation pattern of our results and the standards. Furthermore, non-official standard compounds have to be analyzed by additional analytical techniques such as nuclear magnetic resonance(13).
## vii. Metabolite ranking
Figure 6.and 7. summarize the relative amount of the 13 tentatively identified metabolites and the HHC epimers detected in the eleven urine specimens from HHC users, detected in the pHLM samples and in the pS9 samples, respectively.
In case of the development of the screening method, the in vitro results served as a base for importing only the M10 carboxylated metabolite and its conjugated form into the analysis method, since only this carboxylated metabolite was present in the pHLM and pS9 samples. However, the results of the in vitro metabolite ranking study are always less reliable, since the metabolic transformations and pathways are entirely determined by the composition of the incubation mixture. These systems usually lack extrahepatic pathways. The results of the in vitro metabolite ranking might be informative and they might be compared to the in vivo ranking, however, metabolite profiling is usually based on the in vivo results.
According to the metabolite ranking study of the in vivo samples, all metabolites were more abundant than the parent compound having a mean ratio of $31.98\%$. In six urine samples the most abundant metabolite was M11 (mean ratio: $94.28\%$ ), in four sample M10 had the highest abundance (mean ratio: $65.66\%$ ) and in one sample M13 was the most abundant metabolite (mean ratio: $44.30\%$ ). M03, M04, M05, M06, M08, M09 and M12 were also dominant metabolites with a mean ratio of $23.29\%$, $33.75\%$, $25.83\%$, $21.35\%$, $24.68\%$, $31.97\%$, and $30.23\%$, respectively. The remaining three minor metabolites (M01, M02 and M07) have similar relative abundance to the parent compound.
In all the in vitro samples, the most prevalent compound was the parent compound. Four oxidised metabolites were detected in the in vitro samples: M02, M03, M05 and M06. Only one carboxylated metabolite, M10 was present in the pHLM and pS9 samples, in $9.46\%$ and $1.95\%$, respectively. At the beginning of our study, this fact was the primary reason for importing M10 into the screening method. M01, M04, M07, M08, M09, M11 and M13 were present only in trace amounts. It is explained by the lack of specific support mechanisms in our in vitro systems (eg. the lack of the NADP-regenerating systems, that provides the essential cofactor in the THC-metabolism pathway needed in the production of the carboxy-THC metabolite (14)) or the in vivo role of extrahepatic pathways.
## viii. Metabolic pathways
The estimated metabolic pathways of HHC-epimers in humans include oxidation of the chroman ring (M01), oxidation of the n-pentyl side chain (M02, M03, M04 and M05), oxidation of the C-11 methyl group(M06), carboxylation of one of the geminal methyl groups on the hexahydrobenzo chromenecore, carboxylation of the n-pentyl side chain, carboxylation of the C-11 methyl group (M07, M08, M09, M10, M11, M12), and the combination of two carboxylation steps (M13).
### c) The development of a quantitative confirmatory method - comparison of hydrolysis efficiency
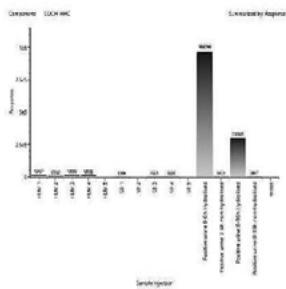
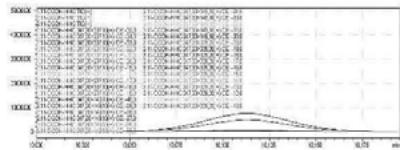
The routine quantitative confirmation of HHC consumption is based on the quantitation of(9R)-11-COOH-HHC. The glucuronide-conjugated metabolite was present in all non-hydrolysed samples. It proves that (9R)-11-COOH-HHC is partially excreted into urine in conjugated form, resulting a similar excretion profile to other cannabinoids. As a result, a hydrolysis step is essential for the quantification of the unconjugated form. One indicative aspect is the number of samples in which hydrolysis was complete $(n = 31)$. Complete hydrolysis meant that the glucuronide-conjugated form was undetectable in the samples. This number was 19, 1 and 3 for the Abalonase ULTRA enzyme, the Escherichia coli enzyme and the alkaline hydrolysis, respectively. The other indicative feature might be the concentration of the hydrolyzed samples. Figure 9. shows the average, the minimum and the maximum concentration levels measured in the authentic samples. Abalonase ULTRA proved to be slightly more efficient in this aspect, than the two other methods. With Abalonase ULTRA enzyme hydrolysis, the average concentration of (9R)-11-COOH-HHC was $140\mathrm{ng / mL}$, the highest concentration was 453 ng/mL and the lowest concentration was 0 ng/mL.
### d) Comparison of the present work with metabolism studies of hexahydrocannabinol
The semi-synthetic cannabinoids, especially hexahydrocannabinol, got into the focus of numerous forensic studies in a short time after its appearance in 2022. The published metabolism studies are controversial. However, the controversial aspects of these studies might be understood if some fundamental aspects got clarified.
First, the results of in vitro studies are restricted by the composition of the in vitro system, especially the cofactors. Cofactor dependence experiments with human liver subcellular fractions revealed that 11-carboxy-THC and 7-carboxy-CBD formation largely depend on cytosolic NAD+-dependent enzymes, with lesser contributions from NADPH-dependent microsomal enzymes. Based on experiments with chemical inhibitors, aldehyde dehydrogenases contribute dominantly to 7-carboxy-CBD formation, and 11-carboxy-THC formation is partly mediated by aldehyde oxidase (14). It means that human liver microsome assays cannot produce the carboxy metabolites of CBD and THC. There is a high probability of the same situation for the carboxy metabolite(s) of HHC. As a result, the metabolism studies must not be based on the in vitro HLM assays, and the lack or low level of carboxy metabolites in the in vitro systems does not estimate the levels of carboxy metabolites in the in vivo samples.
Second, in case of in vivo samples, conjugation might mislead the study. Since glucuronide conjugated metabolites are not available commercially, their detection is complicated. However, urinary metabolite ranking can only be correct if the glucuronide conjugated metabolites are all monitored as well (phase 1 and phase 2 ranking), or if the investigation starts with a hydrolysis step (only phase 1 ranking).
The analytical equipment is also critical in the comparison of metabolite ranking studies. These a works aim to define a urinary concentration ranking. However, the sensitivity, meaning the ratio of the urinary concentration and the peak area in the analysis, might be proved to be constant in a linear range for each compound. Still, it is different for every compound in one analytical method, and it is different for one compound on different analytical equipment, as well. As a result, it might be utterly controversy if the ranking is based on a GC-MS analysis with EI ionization, where the parent compound is fragmented, and the base for the ranking is the sign of the main fragment, and the ranking based on an LC-HRMS analysis with ESI ionization, where the ionized parent compound is monitored, is compared.
Considering these aspects of metabolism studies regarding HHC, our work is compatible with numerous scientific works.
- The metabolites generated by the hydroxylation of the n-pentyl side chain were identified and found to be abundant in metabolism studies by GC-MS and LC-QToF (15, 16, 17).
- Deglucuronidation of urine samples was found to be essential in phase 1 metabolism studies in numerous works (15, 16, 17).
- Studies agree that the carboxy metabolites are present in hydrolisedurinary samples. However, some works detected them only in trace amounts (15, 16, 17) while other studies had similar results to ours and these metabolites were found to be abundant (19).
- (18). The use of chiral analytical column for the quantitative analysis of HHC in biological samples was proved to be advantageous in separating the epimers and their 11-carboxy and 11-hydroxymetabolites.
- Quantitative results were collected for urine, blood and oral fluid samples (19). Urinary concentration for (9R)-11-COOH-HHC is lower $\left(\mathrm{c}_{\max}: 18.5 \mathrm{ng} / \mathrm{mL}\right)$ than in our study $\left(\mathrm{c}_{\max}: 453 \mathrm{ng} / \mathrm{mL}\right)$ but the first result was obtained in non-hydrolysed samples.
## IV. CONCLUSION
In this present paper we described the in vivo phase I metabolism of hexahydrocannabinol based on the LC-HRMS analysis of 11 authentic urine samples. The major biotransformations are oxidation (M1, M2, M3, M4, M5 and M6), hydroxylation (M7, M8, M9, M10, M11 and M12) and double carboxylation (M13). It should be noted that for metabolites other than M11, the chemical structures have not been unequivocally verified. Structure elucidation by interpretation of MS spectra provides strong clues to the chemical structure of the molecule. However, the structure should be verified by analysis of synthesized reference compounds or nuclear magnetic resonance analysis.
Another main result of this study is the ranking of the 13 in vivo HHC-metabolites. All were more prevalent than the parent compound, having a mean ratio of $31.98\%$. In six urine samples the most abundant metabolite was M11. In four samples M10 had the highest rank. In one sample M13 was the most abundant metabolite. M03, M04, M05, M06, M08, M09 and M12 were also dominant. The remaining three minor metabolites (M01, M02 and M07) have similar relative abundance to the parent compound.
We improved our routine LC-MS/MS screening analysis by importing the optimised MRM-transition for
M10 and for its glucuronic acid conjugated form. These compounds had been identified by LC-HRMS analysis of biological samples and in vitro samples.
We developed an LC-MS/MS confirmatory analysis based on M11, a synthesized reference compound. We compared different hydrolysis methods by the quantitative analysis of M11 in 31 authentic urine samples. Hydrolysis with Abalonase ULTRA glucuronidase enzyme proved to be the most efficient method.
Conflicts of interest
The authors declare that there are no conflicts of interest
Data Availability Statement
All data are incorporated into the article.
### ACKNOWLEDGEMENT
The authors gratefully acknowledge scientists at the Department of Drug Investigation of Hungarian Institution of Forensic Sciences for their contributions.
- pharmacology, 2023 Jun 23. doi: 10.2174/1570159X21666230623104624.
10. Kemenes, K., Hidvégí, E., Szabó, L., Kerner, Á., Süvegh, G. (2023) Metabolism of the Synthetic Cathinone Alpha-Pyrrolidinoisohexanophenone in Humans Using UHPLC-MS-QToF. Journal of Analytical Toxicology, 47(3), 253-262, doi: 10.1093/jat/bkac085
11. Andersson, M., Diao, X., Wohlfarth, A., Scheidweiler, K.B., Huestis, M.A. (2016) Metabolic profiling of new synthetic cannabinoids AMB and 5F-AMB by human hepatocyte and liver microsome incubations and high-resolution mass spectrometry. Rapid Communications in Mass Spectrometry, 30(8), 1067-78.
12. Diao, X., Ma, Z., Wang, H., Zhong, D., Zhang, Y., Jin, J., Fan, Y., Chen, X. (2013) Simultaneous quantitation of 3-n-butylphthalide (NBP) and its four major metabolites in human plasma by LC-MS/MS using deuterated internal standards. Journal of Pharmaceutical and Biomedical Analysis, 78-79(19-26), ISSN 0731-7085.
13. Fabregat-Safont, D., Mardal, M., Sancho, J.V., Hernández, F., Linnet, K., Ibanez, M. (2020) Metabolic profiling of four synthetic stimulants, including the novel indanyl-cathinone 5-PPDi, after human hepatocyte incubation. Journal of Pharmaceutical Analysis, 10(2), 147-156.
14. Beers, J., L., Authement, A., K., Isoherranen, N., Jackson, K., D. (2023) Cytosolic Enzymes Generate Cannabinoid Metabolites 7-Carboxycannabidiol and 11-Nor-9-carboxytetrahydrocannabinol ACS Medicinal Chemistry Letters, 14 (5), 614-620
15. Schirmer, W., Auwärter, V., Kaudewitz, J., Schurch, S., Weinmann, W. (2023) Identification of human hexahydrocannabinol metabolites in urine. Eur J Mass Spectrom (Chichester). 2023 Sep 14: 14690667231200139.
16. Schirmer, W. (2023) Identification of hexahydrocannabinol metabolites. 60<sup>th</sup> International Association of Forensic Toxicologists Meeting, TIAFT 2023 LP13
17. Carlier, J., Malaca, S. (2023) Epimers (9S)- and (9R)-hexahydrocannabinol (HHC): A different metabolic fate in humans? $60^{\text{th}}$ International Association of Forensic Toxicologists Meeting, TIAFT 2023 O13
18. Faro, F. L., Tini, A. (2023) Development and validation of a quantitative LC-MS/MS method for the stereoisomers 9R- and 9S-hexahydrocannabinol in blood, oral fluid and urine: application to authentic human samples. $60^{\text{th}}$ International Association of Forensic Toxicologists Meeting, TIAFT 2023 O43
19. Bambagiotti, G., Fede, M. S. (2023) Hexahydrocannabinol (HHC) concentrations in blood, oral fluid and urine following a single
controlled administration of 25 mg inhaled HHC to seven volunteers. $60^{\text {th }}$ International Association of Forensic Toxicologists Meeting, TIAFT 2023 O44
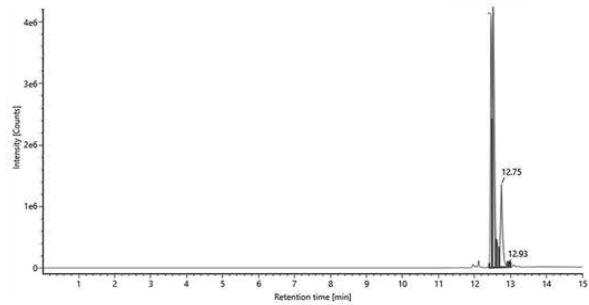
A Item name: 23786/2022-1 Channel name: Hexahydrocannabinol $\{+\mathrm{H}\}: (68.9\mathrm{PPM})317.2485$ Hexahydrocannabinol

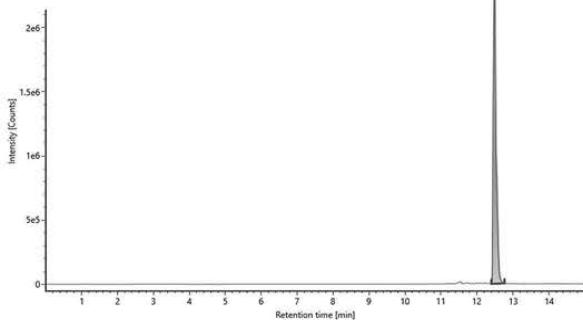
B Item name: Jelly gum $100~\mu \mathrm{g / mL}$ Channel name: Hexahydrocannabinol $\{+\mathrm{H}\}: (68.7\mathrm{PPM})$ 317.2486 Fig. 1: The chromatogram of HHC epimers in the reference standard provided by the Department of Drug Investigation of Hungarian Institution of Forensic Science [A], and the chromatogram of (9R)-HHC in the jelly gum extract[B].
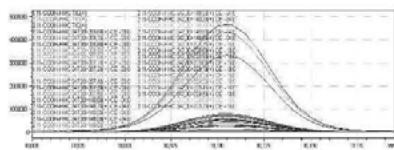
1. QToF analysis of the self-administration urine (hydrolysed/unhydrolysed, solid phase extraction, $25\mathrm{x}$ concentration) detection of a carboxy metabolite in the urine sample and in the in vitro samples
Rt: 10,07 min
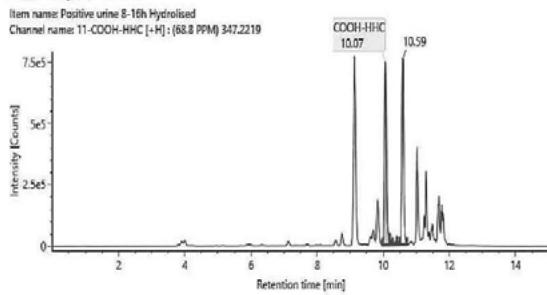
2. LC-MS/MS analysis of the self-administration urine (hydrolysed, solid phase extraction, $25\mathrm{x}$ concentration) after the method transfer; SIM and scan analysis Rt: 10,07 min
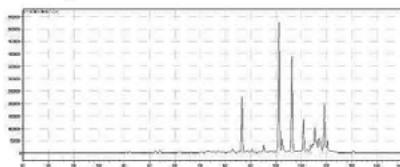
3. Automatic MRM-optimization supported by chromatographic separation on LCMS/MS of the carboxy-metabolite identified by the QToF analysis in the self-administration urine (hydrolysed, solid phase extraction, $25\mathrm{x}$ concentration) Rt: 10,07 min
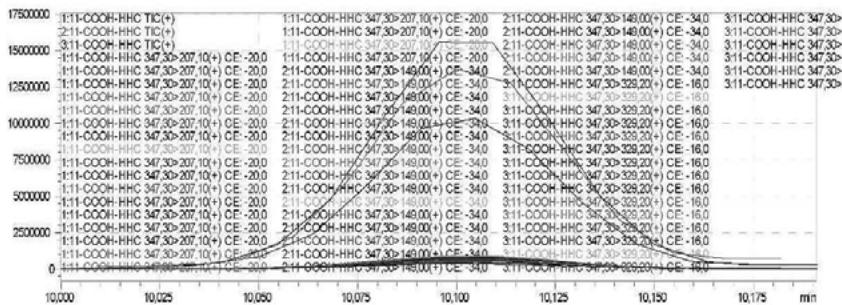
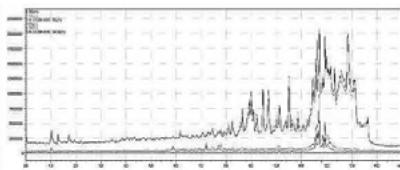
4. After importing the newly optimised MRM-transitions of the carboxy metabolite into the routine screening method, the self-administration urine was analysed following two different extraction procedures (hydrolysed, solid phase extraction, $25\mathrm{x}$ concentration for carboxy-HHC; unhydrolysed, protein precipitation, 4x dilution for glucuronide conjugated carboxy-HHC)
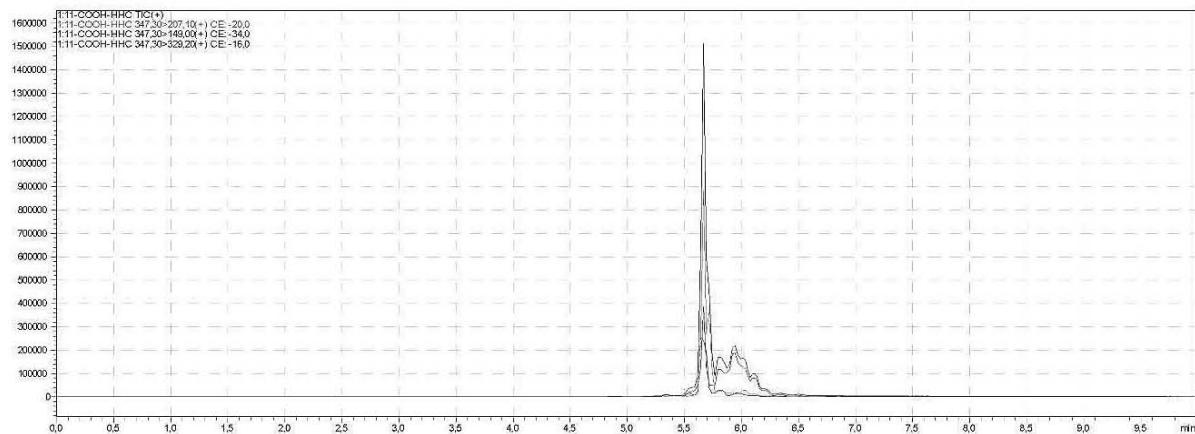
I. Hydrolysed, solid phase extraction, $25\mathrm{x}$ concentration for carboxy-HHC Rt: 5,667 min
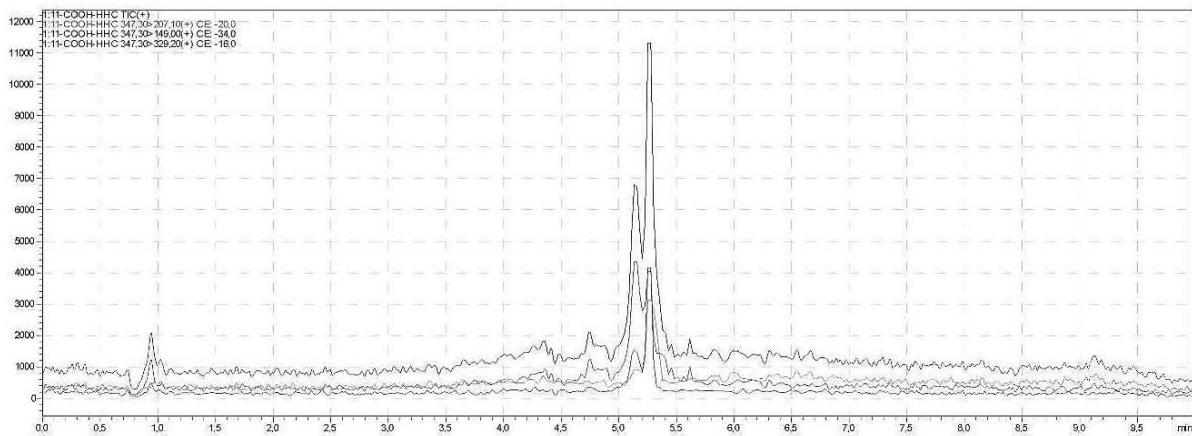
II. Unhydrolysed, protein precipitation, 4x dilution for glucuronide conjugated carboxy-HHC Rt: 5,300 min
5. Automatic MRM-optimization supported by chromatographic separation on LC-MS/MS of the carboxy-glucuronide-metabolite identified in the self-administration urine (unhydrolysed, protein precipitation, 4x dilution) Rt: 5.30 min
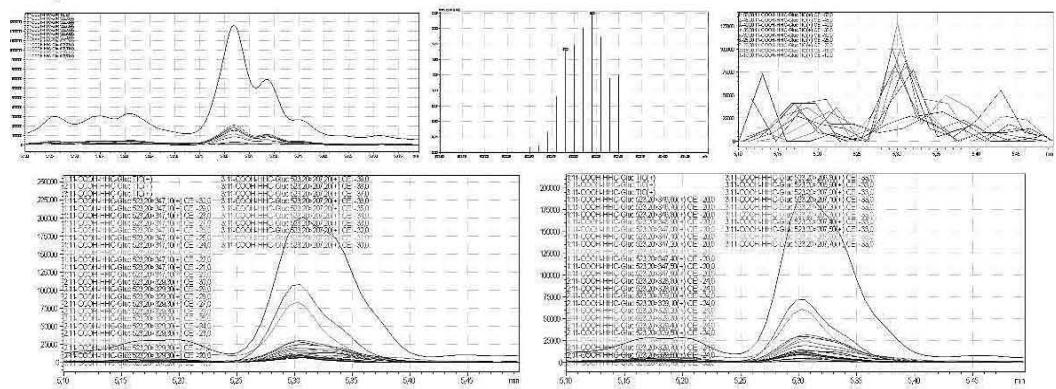
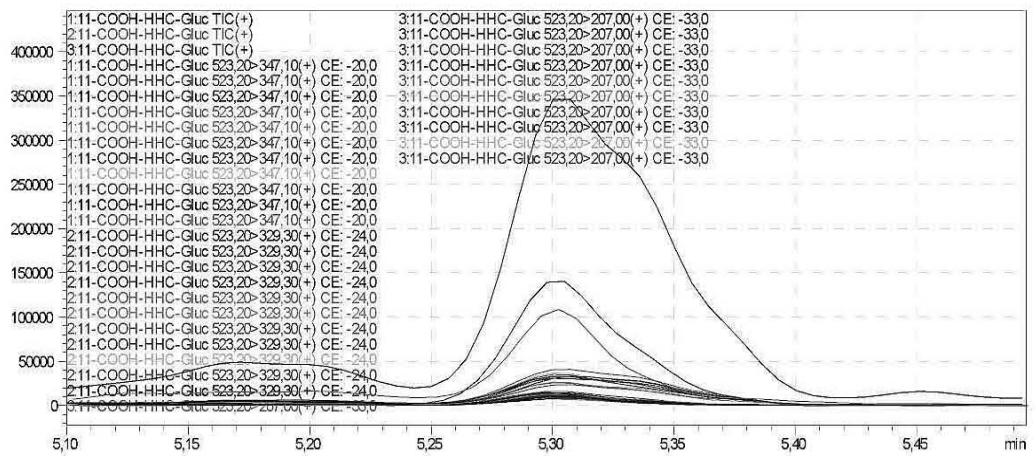
6. As a result of the development of the screening method, the optimised glucuronic acid conjugated carboxy metabolite can be detected by the routine LC-MS/MS screening analysis
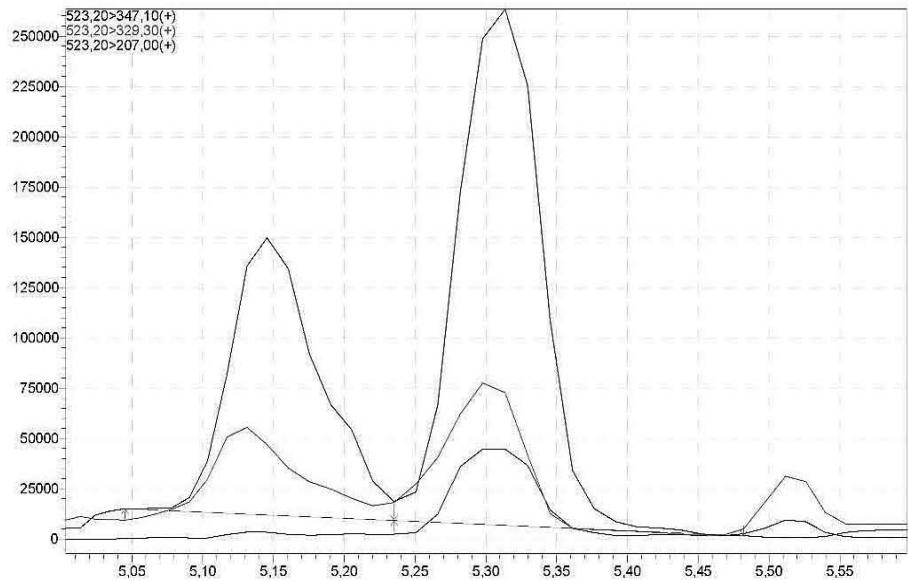 Fig. 2: The detailed development of the screening method
M01 (Rt: 7,98 min)
M02; M03; M04; M05 (in coelution)
M06 (Rt: 12,12 min)
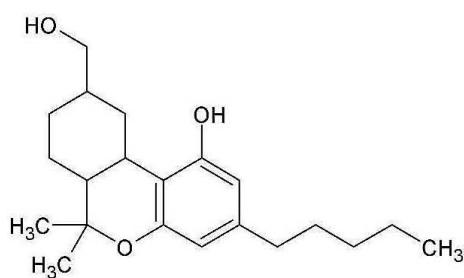
 Fig. 3: The estimated structure, fragmentation pattern and chromatogram of the
$\left[\mathrm{HHC}+\mathrm{O}\right]$ metabolites (M01, M02, M03, M04, M05 and M06)
M02; M03; M04; M05 (in coelution)
M06 (Rt: 12,12 min)

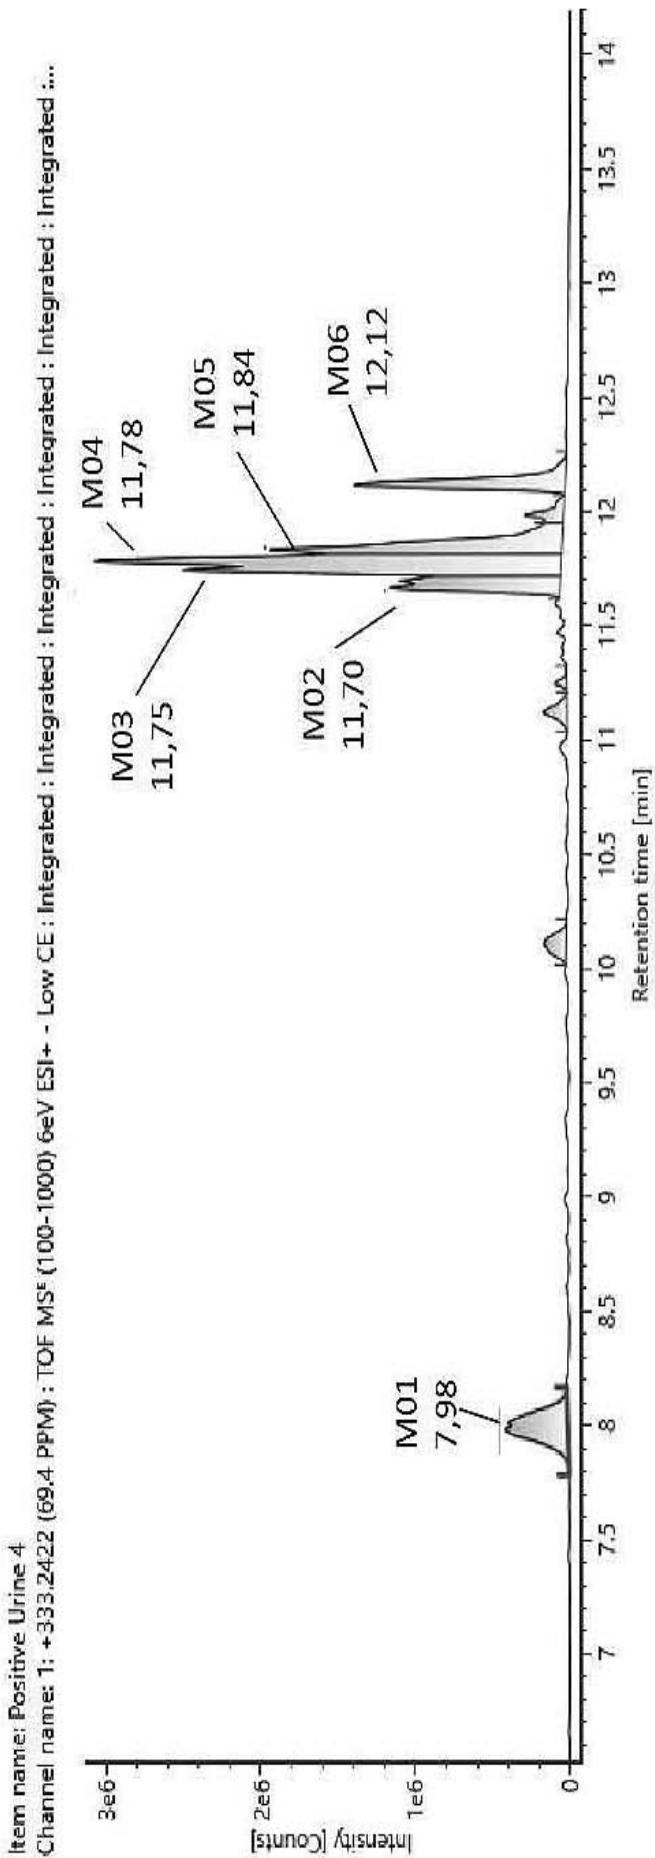
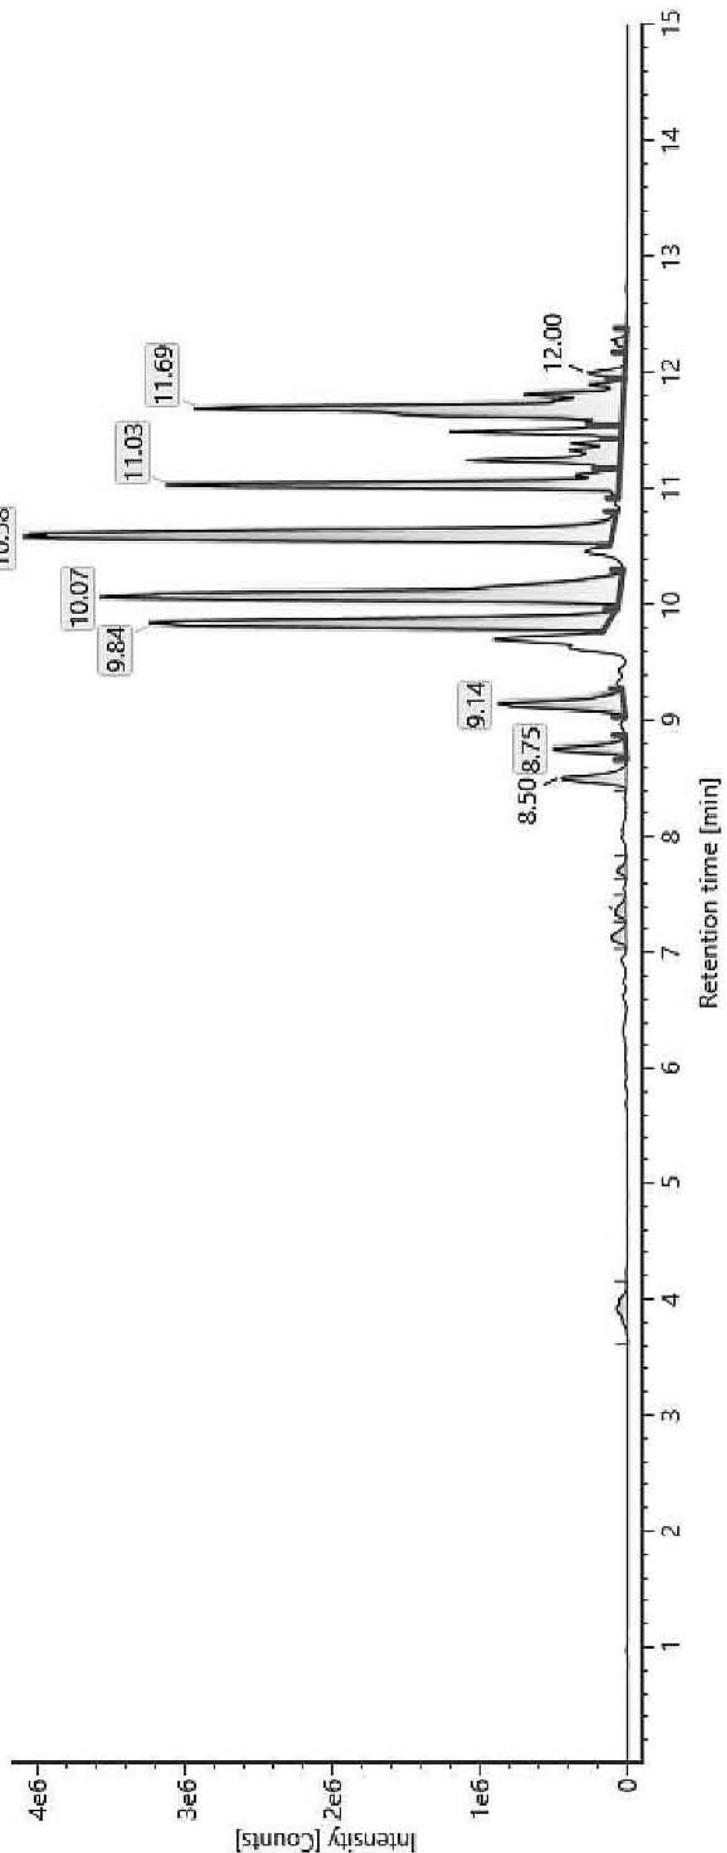
M07 (Rt: 8,75 min)
M08 (Rt: 9,14 min)
M09 (Rt: 9,84 min)
M10 (Rt: 10,07 min)
M11 (Rt: 10,58 min)
M12 (Rt: 11,03 min)
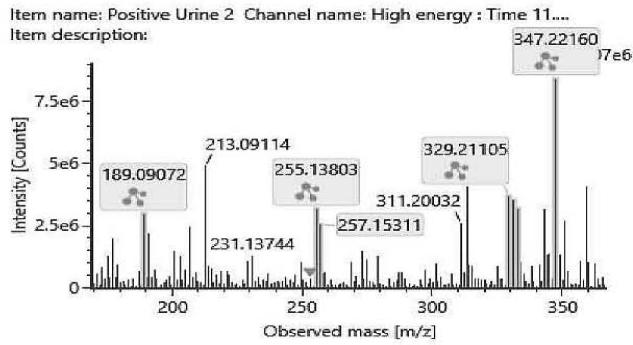 Fig. 4: The fragmentation pattern and chromatogram of the
$\mathrm{[HHC - H2 + O2]}$ metabolites (M07, M08, M09, M10, M11 and M12)

Item name: Positive Urine 5 Channel name: 1: +347.2219 (69.4 PPM): TOF MS $^{\text{E}}$ (100-1000) 6eV ESI+ - Low CE: Integrated: Integrated: Smoothed
Item name: Positive Urine 9 Channel name: High energy: Time 11.4854... Item description:
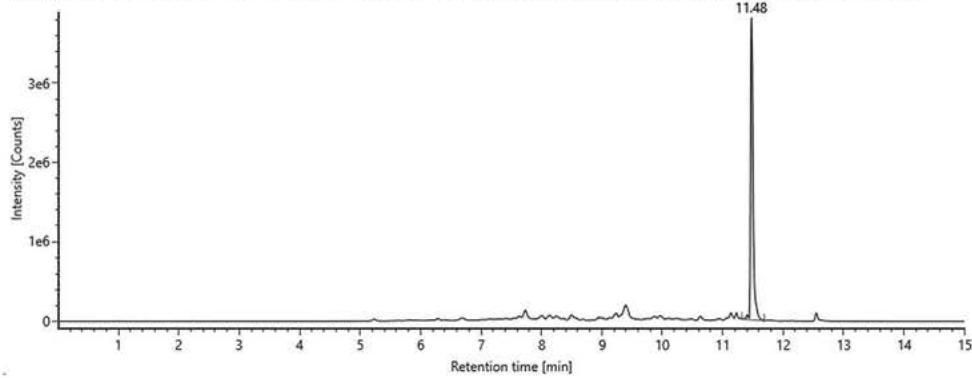
Item name: Positive Urine 7 Channel name: 1; +377.1997 (69.4 PPM): TOF MS ${}^{ \dagger }$ (100-1000) 6eV ESI+ - Low CE: Integrated: Integrated: Integrated: Integrated: Smoothed Fig. 5: The estimated structure, fragmentation pattern and chromatogram of M13 $\left[\mathrm{HHC} + 2\left(-\mathrm{H}2 + \mathrm{O}2\right)\right.$ metabolite, Rt: 11,48 min]
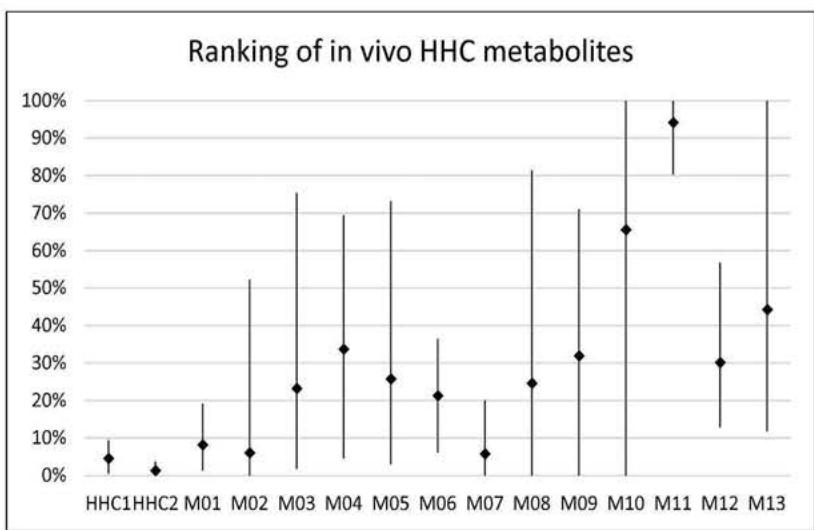
Fig. 6: The relative abundance of the tentatively identified metabolites and the parent compound(s) in the 11 urine specimens from HHC-users analysed
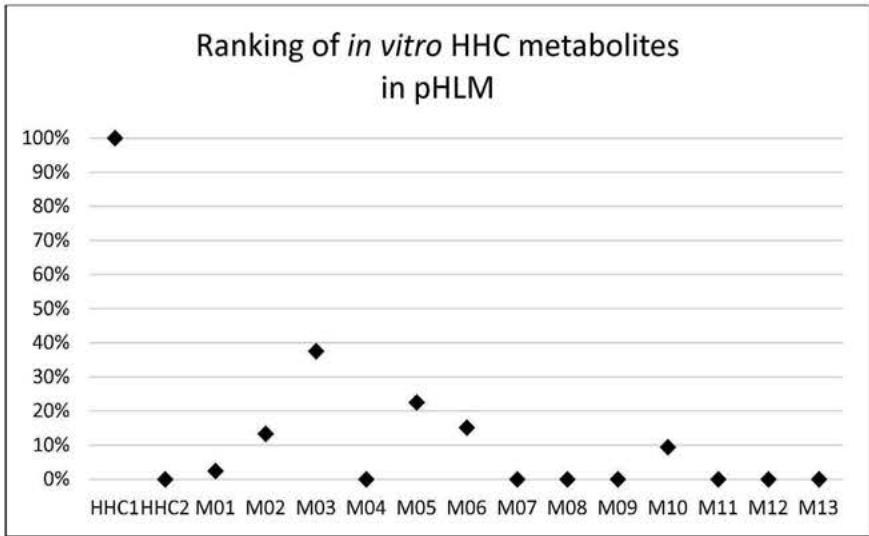
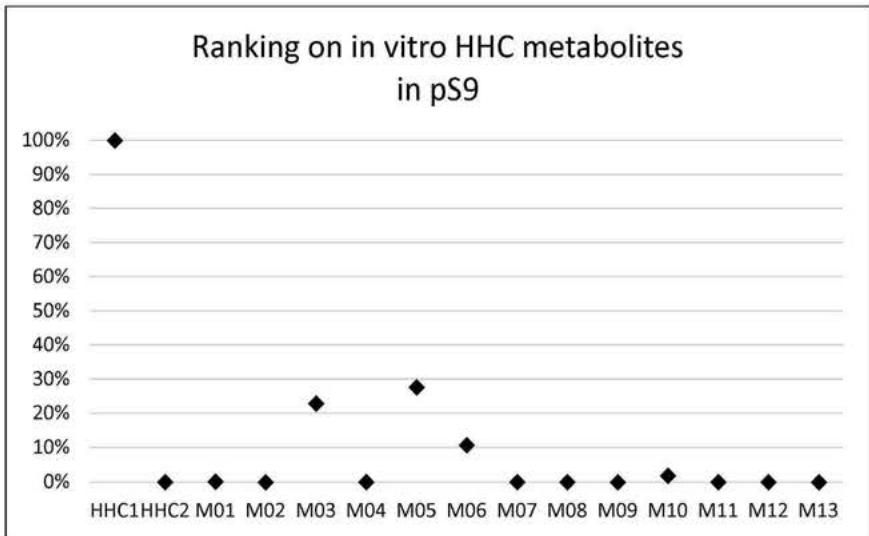
Fig. 7: The relative abundance of the tentatively identified metabolites and the parent compound in the pHLM and the pS9 samples
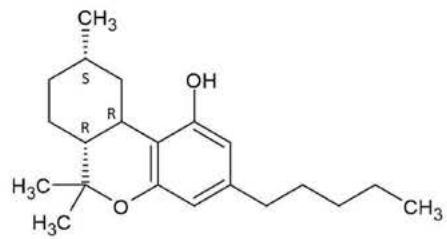
(9S)-HHC
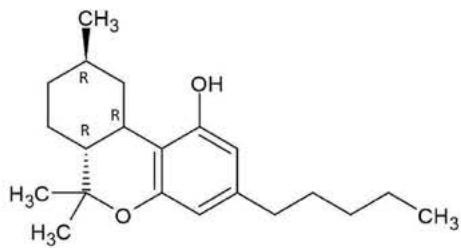
(9R)-HHC
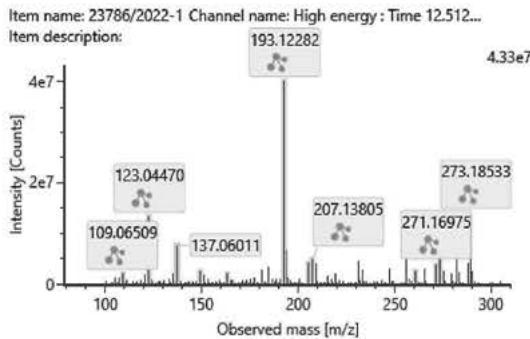
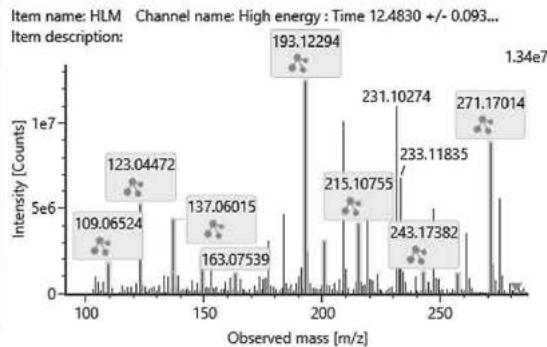
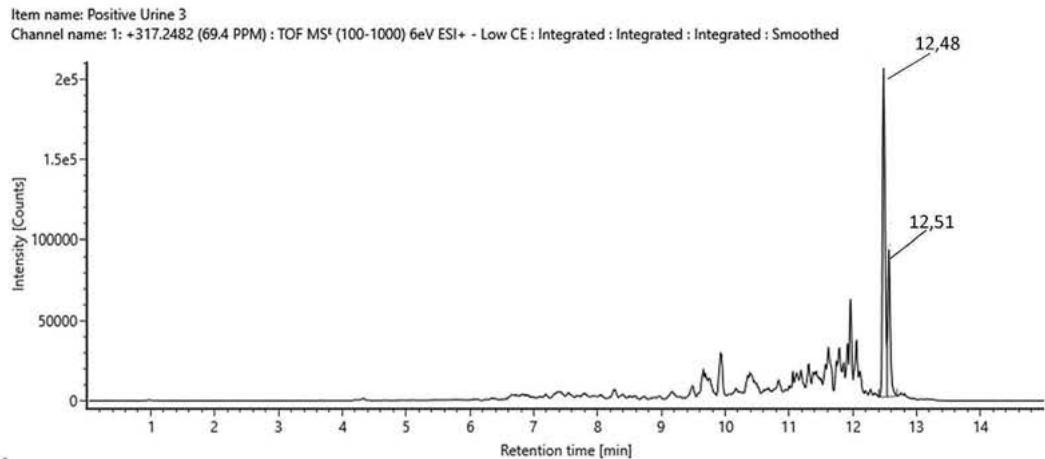
Fig. 8: The structure and fragmentation pattern of the two HHC epimers, (9S)-HHC and (9R)-HHC, based on the conformation of the C-11 methyl group
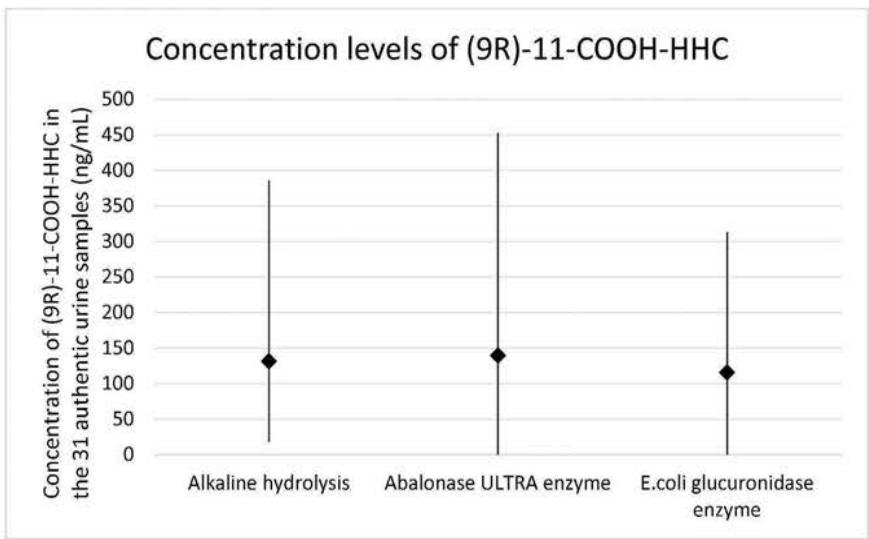 Fig. 9: Concentration levels in the thirty-one authentic urine samples quantified after the three different hydrolysis methods Table 1: The elemental composition, the estimated structure, the observed m/z with the mass error in ppm compared to the expected m/z of the most intensive high energy fragments generated from M01
M01; $[\mathrm{HHC + O}]$ metabolite, Rt: 7,98 min
<table><tr><td>Observed m/z</td><td>Mass error (ppm)</td><td>Formula</td><td>Estimated structure</td></tr><tr><td>333.24150</td><td>-2.77</td><td>C21H33O3</td><td></td></tr><tr><td>203.07053</td><td>1.29</td><td>C12H11O3</td><td></td></tr><tr><td>137.05993</td><td>1.62</td><td>C8H9O2</td><td></td></tr><tr><td>197.11905</td><td>9.29</td><td>C11H17O3</td><td></td></tr><tr><td>160.05171</td><td>-1.07</td><td>C10H8O2</td><td></td></tr><tr><td>315.23199</td><td>0.41</td><td>C21H31O2</td><td></td></tr><tr><td>259.16933</td><td>0.28</td><td>C17H23O2</td><td></td></tr><tr><td>189.09115</td><td>0.77</td><td>C12H13O2</td><td></td></tr><tr><td>191.10656</td><td>-0.48</td><td>C12H15O2</td><td></td></tr><tr><td>231.13776</td><td>-0.87</td><td>C15H19O2</td><td></td></tr></table>
Table 2: The elemental composition, the estimated structure, the observed m/z with the mass error in ppm compared to the expected m/z of the most intensive high energy fragments generated from M04, the metabolite with the highest peak among the four coeluting oxidised metabolites
M04; $[\mathrm{HHC + O}]$ metabolite, Rt: 11,78 min
Table 3: The elemental composition, the estimated structure, the observed m/z with the mass error in ppm compared to the expected m/z of the most intensive high energy fragments generated from M06
M06; $\mathrm{[HHC + O]}$ metabolite, Rt: 12,12 min
<table><tr><td>Observed m/z</td><td>Mass error (ppm)</td><td>Formula</td><td>Estimated structure</td></tr><tr><td>315.23255</td><td>2.21</td><td>C21H31O2</td><td></td></tr><tr><td>193.12270</td><td>2.05</td><td>C12H17O2</td><td></td></tr><tr><td>259.16952</td><td>1.00</td><td>C17H23O2</td><td></td></tr><tr><td>333.24309</td><td>2.00</td><td>C21H33O3</td><td></td></tr></table>
Table 4: The elemental composition, the estimated structure, the observed m/z with the mass intensive, but unspecific high energy fragments generated from
$\left[\mathrm{HHC}-\mathrm{H}2+\mathrm{O}2\right]$ metabolites (M07, M08, M09, M10, M11 and M12)
<table><tr><td>Observed m/z</td><td>Formula</td><td>Estimated structure</td></tr><tr><td>329.21112</td><td>C21H29O3</td><td>HHC-COOH -O-H2</td></tr><tr><td>273.14852</td><td>C17H21O3</td><td>HHC-COOH -C4-H10-O</td></tr><tr><td>149.05971</td><td>C9H9O2</td><td>HHC-COOH -C12-H22-O2</td></tr><tr><td>247.13287</td><td>C15H19O3</td><td>HHC-COOH -C6-H14-O</td></tr></table>

$\mathrm{[HHC + 2(-H2 + O2)]}$ metabolite, Rt: $11,48\mathrm{min}$
Table 5: The elemental composition, the estimated structure, the observed m/z with the mass error in ppm compared to the expected m/z of the 21 most intensive high energy fragments generated from M13
<table><tr><td>Observed m/z</td><td>Mass error (ppm)</td><td>Formula</td><td>Estimated structure</td><td>Observed m/z</td><td>Mass error (ppm)</td><td>Formula</td><td>Estimated structure</td></tr><tr><td>197,08206</td><td>6</td><td>C10H13O4</td><td></td><td>243,13945</td><td>6,14</td><td>C16H19O2</td><td></td></tr><tr><td>191,10654</td><td>-0,63</td><td>C12H15O2</td><td></td><td>217,1225</td><td>0,87</td><td>C14H17O2</td><td></td></tr><tr><td>184,07437</td><td>7,15</td><td>C9H12O4</td><td></td><td>237,11257</td><td>1,76</td><td>C13H17O4</td><td></td></tr><tr><td>257,15419</td><td>2,29</td><td>C17H21O2</td><td></td><td>263,12906</td><td>4,75</td><td>C15H19O4</td><td></td></tr><tr><td>201,09195</td><td>4,69</td><td>C13H13O2</td><td></td><td>203,10784</td><td>5,83</td><td>C13H15O2</td><td></td></tr><tr><td>271,16952</td><td>0,97</td><td>C18H23O2</td><td></td><td>233,15479</td><td>5,07</td><td>C15H21O2</td><td></td></tr><tr><td>149,06012</td><td>2,77</td><td>C9H9O2</td><td></td><td>175,07552</td><td>0,93</td><td>C11H11O2</td><td></td></tr><tr><td>187,0754</td><td>0,23</td><td>C12H11O2</td><td></td><td>273,14877</td><td>0,82</td><td>C17H21O3</td><td></td></tr><tr><td>287,16396</td><td>-0,82</td><td>C18H23O3</td><td></td><td>245,15527</td><td>6,77</td><td>C16H21O2</td><td></td></tr><tr><td>193,12219</td><td>-0,59</td><td>C12H17O2</td><td></td><td>362,17214</td><td>-0,82</td><td>C20H26O6</td><td></td></tr></table>
Table 6: The elemental composition, the estimated structure, the observed m/z with the mass error in ppm compared to the expected m/z of the 12 most intensive high energy fragments generated from the two HHC epimers(left column: (9S)-HHC; right column: (9R)-HHC)
<table><tr><td>Observed m/z</td><td>Mass error (ppm)</td><td>Formula</td><td>Estimated structure</td></tr><tr><td>193,12282</td><td>2,68</td><td>C12H17O2</td><td></td></tr><tr><td>273,18533</td><td>1,56</td><td>C18H25O2</td><td></td></tr><tr><td>123,0447</td><td>5,21</td><td>C7H7O2</td><td></td></tr><tr><td>137,13282</td><td>2,52</td><td>C10H17</td><td></td></tr><tr><td>137,06011</td><td>2,98</td><td>C8H9O2</td><td></td></tr><tr><td>271,16975</td><td>1,82</td><td>C18H23O2</td><td></td></tr><tr><td>207,13805</td><td>0,47</td><td>C13H19O2</td><td></td></tr><tr><td>205,12264</td><td>1,64</td><td>C13H17O2</td><td></td></tr><tr><td>261,18308</td><td>-7,01</td><td>C17H25O2</td><td></td></tr><tr><td>149,05997</td><td>1,74</td><td>C9H9O2</td><td></td></tr><tr><td>163,07537</td><td>0,07</td><td>C10H11O2</td><td></td></tr><tr><td>109,06509</td><td>2,71</td><td>C7H9O</td><td></td></tr></table>
Generating HTML Viewer...
References
18 Cites in Article
(1961). Unknown Title.
(2022). World Drug Report 2022.
P Squires (2009). The Prosecution of Drug Users in Europe: Insights Series 5: European Monitoring Centre for Drugs and Drug Addiction (EMCDDA): Office for Official Publications of the European Communities, Luxembourg, 2002 ISBN 92-9168-124-5.
István Ujváry (2023). Hexahydrocannabinol and closely related semi‐synthetic cannabinoids: A comprehensive review.
(2022). EU Early Warning System formal notification.
Robert Archer,Donald Boyd,Paul Demarco,Irene Tyminski,Norman Allinger (1970). Structural studies of cannabinoids. Theoretical and proton magnetic resonance analysis.
Patricia Reggio,Kaylar Greer,Stephanie Cox (1989). The importance of the orientation of the C9 substituent to cannabinoid activity.
Silvia Graziano,Maria Varì,Simona Pichini,Francesco Busardo,Tommaso Cassano,Annagiulia Di Trana (2023). Hexahydrocannabinol Pharmacology, Toxicology, and Analysis: The First Evidence for a Recent New Psychoactive Substance.
K Kemenes,E Hidvégi,L Szabó,Á Kerner,G Süvegh (2023). Metabolism of the Synthetic Cathinone Alpha-Pyrrolidinoisohexanophenone in Humans Using UHPLC--MS-QToF.
Maria Andersson,Xingxing Diao,Ariane Wohlfarth,Karl Scheidweiler,Marilyn Huestis (2016). Metabolic profiling of new synthetic cannabinoids AMB and 5F‐AMB by human hepatocyte and liver microsome incubations and high‐resolution mass spectrometry.
Xingxing Diao,Zhiyu Ma,Haidong Wang,Dafang Zhong,Yifan Zhang,Jing Jin,Yaxin Fan,Xiaoyan Chen (2013). Simultaneous quantitation of 3-n-butylphthalide (NBP) and its four major metabolites in human plasma by LC–MS/MS using deuterated internal standards.
David Fabregat-Safont,Marie Mardal,Juan Sancho,Félix Hernández,Kristian Linnet,María Ibáñez (2020). Metabolic profiling of four synthetic stimulants, including the novel indanyl-cathinone 5-PPDi, after human hepatocyte incubation.
Willi Schirmer,Volker Auwärter,Julia Kaudewitz,Stefan Schürch,Wolfgang Weinmann (2023). Identification of human hexahydrocannabinol metabolites in urine.
W Schirmer (2023). XXVIII international meeting of The International Association of Forensic Toxicologists (TIAFT).
J Carlier,S Malaca (2023). Origin of the Different Binding Affinities of (9R)- and (9S)Hexahydrocannabinol (HHC) for the CB1 and CB2 Cannabinoid Receptors.
F Faro,A Tini (2023). Development and validation of a quantitative LC-MS/MS method for the stereoisomers 9R-and 9S-hexahydrocannabinol in blood, oral fluid and urine: application to authentic human samples.
G Bambagiotti,M Fede (2023). Hexahydrocannabinol (HHC) concentrations in blood, oral fluid and urine following a single.
No ethics committee approval was required for this article type.
Data Availability
Not applicable for this article.
How to Cite This Article
Hegyiné Kemenes Klaudia. 2026. \u201cDevelopment of a Urinary Screening Method, a Urinary Quantitative Confirmatory Method and Metabolic Profiling of the Semi-Synthetic Cannabinoid Hexahydrocannabinol in Humans Using UPLC-MS-QToF and UHPLC-MS/MS\u201d. Global Journal of Medical Research - B: Pharma, Drug Discovery, Toxicology & Medicine GJMR-B Volume 24 (GJMR Volume 24 Issue B1): .
Explore published articles in an immersive Augmented Reality environment. Our platform converts research papers into interactive 3D books, allowing readers to view and interact with content using AR and VR compatible devices.
Your published article is automatically converted into a realistic 3D book. Flip through pages and read research papers in a more engaging and interactive format.
Our website is actively being updated, and changes may occur frequently. Please clear your browser cache if needed. For feedback or error reporting, please email [email protected]
Thank you for connecting with us. We will respond to you shortly.
Lorem ipsum dolor sit amet, consectetur adipiscing elit. Ut elit tellus, luctus nec ullamcorper mattis, pulvinar dapibus leo.
Development of a Urinary Screening Method, a Urinary Quantitative Confirmatory Method and Metabolic Profiling of the Semi-Synthetic Cannabinoid Hexahydrocannabinol in Humans Using UPLC-MS-QToF and UHPLC-MS/MS