I. INTRODUCTION
Today the topical issue of pharmaceutical development is the search for new objects of research and the use of science-based approaches.
Effervescent drugs are becoming increasingly popular with consumers, clinicians, and technologists yearly.
This is due to several of essential advantages. They provide a faster release of active pharmaceutical ingredients from the dosage form. As a result, high speed and completeness of absorption are ensured. This increases bioavailability and accelerates the onset of therapeutic action, reduces the irritating effect on the mucous membrane of the gastrointestinal tract, and increases the amount of fluid consumed. Effervescent drugs are well received by patients because they combine the advantages of tablets (portability, accurate dosage) and the possibility of easier administration (no need to swallow the pill) [1, 2]. They make it possible to convert difficult-to-dissolve compounds into solution by the salt formation and solubilization with carbon dioxide, correction of unpleasant organoleptic properties of active substances. Effervescent dosage forms allow you to combine components that react with each other [3, 4]. They are promise dosage forms for cardiovascular, antispasmodic, analgesic, expectorant, and other pharmacological groups, as well as for pediatric and geriatric practice [5].
The main components of effervescent dosage forms are a gas-forming mixture of acidic and alkaline fractions. They are selected individually for each drug. In most cases, they make up of the total mass [6]. Dry organic acids with carbonates and, or bicarbonates of alkali and alkaline earth metals are most often used so, effervescent substances, choose citric acid and sodium hydrogen carbonate [4].
The most common acid component is anhydrous citric acid (E 330). Sometimes it can be replaced by ascorbic or adipic acids [7]. Isolated cases of fumaric, malic, and tartaric acids were observed. Fumaric acid can be used in the form of more soluble salts, in particular sodium and potassium fumarates [6]. The acid source can be organic acids - tartaric, succinic, and acid anhydrides - mostly citric, succinic, and glutamic. Tartaric, adipic, and fumaric acids are usually used in small quantities due to their low solubility in water. The acid fraction can also be represented by salts of acids, such as sodium dihydrogen phosphate, sodium dihydrogen citrate, sodium dihydrogen tartrate, disodium dihydrogen pyrophosphate, and sodium sulfite [3, 6].
Currently, carbonates or bicarbonates of alkaline and alkaline earth metals or their mixtures are used as the carbonate fraction. The alkaline fraction of the gas-forming mix is most often formed by sodium bicarbonate (E 500) alone or with anhydrous sodium carbonate [7]. Hydrocarbons and potassium carbonates can be used as an alternative. As an alkaline components, calcium carbonates, magnesium, sodium glycine carbonate, sodium lysine carbonate, sodium arginine carbonate, potassium acesulfame, and others are also used [3].
Sodium salts (sodium citrate dihydrate and monosodium citrate anhydrous) are an antioxidant synergist, buffer, acidity stabilizer, and carbon dioxide retainer. Sodium hydrogen phosphate anhydrous is added as an acidity regulator. Anhydrous sodium sulfate acts as a humidity regulator. The composition also includes sodium benzoate as a preservative. Sodium docusate and sodium chloride are also used to obtain effervescent dosage forms [7].
Taking into account the fact that the mass of effervescent dosage forms is quite large and varies between 2-4 g, an essential step in the development stage is the choice of filler. It has specific requirements, the main of which are: high solubility in water, low hygroscopicity values, good compressibility, and satisfactory flowability. According to the literature, sugars (dextrose, glucose, lactose) and polyols (sorbitol, mannitol) are used as fillers in the production of the effervescent dosage forms. Sugars play the role not only of structure-formers but also of taste correctors. It is noted that the effervescent dosage form includes sorbitol, anhydrous lactose, lactose monohydrate, mannitol, glycine, sucrose, anhydrous glucose, and maltodextrin. Pregelatinized starch was used as a filler [8].
Effervescent drugs are a solution after dissolving in water. Therefore, one of the essential issues is the choice of optimal correctors of taste, smell, and color. Thus, natural water-soluble substances are used as taste correctors - sucrose, lactose, xylitol, D-glucose, sorbitol, mannitol, and glycine. However, most effervescent drugs formulations contain artificial sweeteners, including aspartame, cyclamates, and sodium, or potassium salts of saccharin. The leaders among taste correctors are sodium saccharin, aspartame, sodium cyclamate, lemon flavoring BSL code 119. The last includes natural lemon oil, natural/identical to natural lime flavoring, mannitol, maltodextrin, gluconolactone, sorbitol, acacia. So the bitter taste of ciprofloxacin, and paracetamol is masked by sodium saccharin. In addition, the effervescent effect of citric acid, tartaric acid, and sodium hydrogen carbonate leads to an improvement in the taste of the drug [9, 10]. Aspartame was most effective in masking the bitter taste of ranitidine hydrochloride [2]. The use of a complex of 2-hydroxypropyl- -cyclodextrin and mannitol with inclusion in a solid dispersion allows you to hide the bitter and sour taste of levocetirizine hydrochloride [5].
In order to improve organoleptic properties, natural and artificial fruit flavors in dry forms (orange, lemon, pineapple, etc.) are added to the composition of effervescent dosage forms. The most common flavoring is lemon. Aromas close to it are characterized by orange, tangerine, and lime. Fruit scents are popular: blackberry flavoring B, aromatic fruit additives of raspberry, grapefruit, red fruits, and mixed fruit flavoring. They are unique for each drug. For example, vanillin flavor increases sensitivity, when taking ciprofloxacin effervescent tablets [10]. For ranitidine hydrochloride effervescent tablets, mint and orange flavors were the most effective [2]. Strawberry and banana flavoring enhances the palatability of paracetamol effervescent tablets [9]. In the test of potassium citrate effervescent
Tablets, the combinations of flavors orange - lemon and strawberry - raspberry were acceptable [11].
The ability of dyes to change color under the influence of pH of the solution should be taken into account when choosing color correctors. Preference is given to natural pigments (carotene and chlorophyll) for the production of effervescent dosage forms [6]. Unique red AC, quinoline yellow lake, and red beet juice powder are also used [7].
Therefore, 5 to 15 components must be used to obtain an effervescent dosage form [12]. This involves the study of multifactorial dependencies, especially when it comes to active pharmaceutical ingredients with specific pharmaco-technological properties. Another aspect that requires significant amounts of experimental research is the creation of particular types of solid dosage forms. Currently, research on the outcome of effervescent dosage forms is rarely conducted. They require more significant of experimental studies due to the lack of thorough research on their development and the lack of experience in their production [13].
During the development of optimal formulations and drug technology, the experience gained in using the introductory provisions of mathematical planning of the experiment (quality by design). Depending on the physical and technological properties of active pharmaceutical ingredients, a research design has been developed that allows for a comparative evaluation of excipients, to establish a possible interaction between them, select the most rational ones, and establish their optimal quantities in the composition. Before starting experimental work, it is reasonable to use a priori ranking, especially when the first steps are taken to create drugs.
The beginning of experimental studies includes the selection of rational excipients for the created solid dosage form. A significant list of excipients available on the pharmaceutical market prompts the use of unique dispersion analysis plans. The developed algorithm for choosing a rational method of the experiment and its statistical processing makes it possible not only to reduce the number of experimental studies but also to obtain information about the interaction between the levels of the studied factors. It is practically impossible to get with a traditional single-factor study [13, 14]. The influence of excipients from different functional groups on the pharmaco-technological indicators of tablets was studied using the method of dispersion analysis [15-17]. Based on the results of the experiment, a ranked series of advantages constructed, significant factors determined, and the best excipients were selected [18].
Then the quantitative excipients influence on the pharmaco-technological properties of the solid dosage form is studied [14]. For experimental studies, it is rational to use the method of random balance, with the help of which it can significantly reduce the number of factors and select the most significant ones for further research [13]. Analyzis using quality by design is successfully used to optimize various technological processes. The main advantage of mathematical planning of the experiment compared to classical research methods is the possibility of the simultaneous study of a large number of factors [18]. The influence of quantitative factors on the leading quality indicators of the drug was studied, using the approaches of mathematical planning of the experiment, namely, the random balance method. The most significant factors affecting formulation and leading quality tablets indicators have been identified [19-21].
The purpose work was to develop the formulation and technology of a powder for oral solution in sachets, which includes 325 mg of paracetamol, 50 mg of ascorbic acid, 10 mg of phenylephrine hydrochloride, 20 mg of pheniramine maleate.
II. MATERIAL AND METHODS
The objects of the study were powders with paracetamol, phenylephrine hydrochloride, pheniramine maleate, ascorbic acid, and excipients. Paracetamol is manufactured by Hebei Jiheng (Group) Pharmaceutical Co. Ltd, China. Phenylephrine hydrochloride is manufactured by Unichem Laboratories, India. Pheniramine maleate is manufactured by Supria Litescience Ltd., India. Ascorbic acid is manufactured by Swiss DSM Nutritional Products. All excipients used in the development of the drug are generally accepted substances that are widely used in the production of powders for internal use. Theraflu, powder for oral solution in sachets No. 10 of the company Novartis Pharmaceuticals Canada Inc., Canada/Switzerland was used as a reference drug.
In the process of pharmaceutical development, guidelines ICH Q8, ICH Q9, ICH Q10, ICH Q11, and normative documents of CQA, CMA, and CPP were guided, ultimately increasing the effectiveness of research in the creation of the solid dosage form and its subsequent registration [13].
The following equipment used to produce of powders: electronic balanceMettler Toledo PB8001-S, rotor sieve GSF 60, container blender Glatt CML, roll compactor Alexandwerden WP120.
The following research methods used: technological, organoleptic, analytical, and statistical.
Bulk density was calculated by determining the book that has the fixed weight of powder. Tapped density was calculated by determining the volume that holds the set weight of powder after 1250 taps on tapped density testerERWEKA SVM 202. Carr's index calculated by the equation:
Carr's index is an indication of the compressibility of a powder [22]. The resulting index from 12 to 15 shows good compressibility, 16-24 - fair to passable, 25-35 - poor, 36-39 - very poor, and more than 40 - extremely poor. Flowability tested by flow tester ERWEKA GTB. Flowability is the speed of rash powder through a funnel with an opening diameter of 10 mm. The obtained results are the average for threesizes. This device also allows measuring the angle of repose by a laser. The obtained results are the average for 3 measurements. Loss on drying of the granulate was determined using a moisture analyzer Mettler Toledo HB 43 according to the Ph.Eur.method. The powder of 1 sachet was dissolved in of purified water and the pH of the solution was tested using a pH meter Mettler Toledo S220 Seven Compact according to the pharmacopoeial method [23].
Organoleptic properties (appearance of powdersand solutions, smell, and taste of the solution) were evaluated using a 5-score scale.
Analytical properties of the powder (assay, content uniformity) were tested according to pharmacopoeia[23]. The composition includes four active pharmaceutical ingredients with different physicochemical properties. Liquid chromatography with detection at wavelength 273 nmwas used for quantitative determination of paracetamol, phenylephrine hydrochloride, and pheniramine maleate. Titration method by direct iodometry was used for quantitative determination ascorbic acid.
Methods of mathematical and statistical planning of the experiment (dispersion analysis, random balance method) were used for setting up and conducting experiments [18]. Statistical processing of experimental results was conducted according to generally accepted methods using standard Excel computer programs [24].
In the course of pharmaceutical development, the excipient effect on the quality indicators of the powder and its solution is studied. For this purpose, excipients were grouped into five factors: alkaline fraction (factorA): - sodium bicarbonate, - calcium carbonate, - calcium phosphate; acid fraction (factorB): - citric acid anhydrous, - a mixture of citric acid anhydrous and malic acid (5:1), - malic acid; coloring (factorC): - iron oxide, - curcumin, - riboflavin; flavoring (factorD): - lemon, - lemon-lime, - orange, - grapefruit, - blackberry, - raspberry, - strawberries, - apple, - chocolate; filler (factorE): - fructose, - sorbitol 60, - sorbitol 450, - mannitol, - a mixture of sugar and xylitol (3:2), - dextrose hydrate, - sugar powder, - lactose monohydrate 200, - maltitol.
Experimental studies were carried out using the Latin cube of the second order (Table 1).
| Batch | A | B | C | D | E |
| 1 | a1 | b1 | c1 | d1 | e1 |
| 2 | a1 | b2 | c1 | d5 | e2 |
| 3 | a1 | b3 | c1 | d9 | e3 |
| 4 | a2 | b1 | c1 | d2 | e4 |
| 5 | a2 | b2 | c1 | d6 | e5 |
| 6 | a2 | b3 | c1 | d7 | e6 |
| 7 | a3 | b1 | c1 | d3 | e7 |
| 8 | a3 | b2 | c1 | d4 | e8 |
| 9 | a3 | b3 | c1 | d8 | e9 |
| 10 | a1 | b1 | c2 | d4 | e9 |
| 11 | a1 | b2 | c2 | d8 | e7 |
| 12 | a1 | b3 | c2 | d3 | e8 |
| 13 | a2 | b1 | c2 | d5 | e3 |
| 14 | a2 | b2 | c2 | d9 | e1 |
| 15 | a2 | b3 | c2 | d1 | e2 |
| 16 | a3 | b1 | c2 | d6 | e6 |
| 17 | a3 | b2 | c2 | d7 | e4 |
| 18 | a3 | b3 | c2 | d2 | e5 |
| 19 | a1 | b1 | c3 | d7 | e5 |
| 20 | a1 | b2 | c3 | d2 | e6 |
| 21 | a1 | b3 | c3 | d6 | e4 |
| 22 | a2 | b1 | c3 | d8 | e8 |
| 23 | a2 | b2 | c3 | d3 | e9 |
| 24 | a2 | b3 | c3 | d4 | e7 |
| 25 | a3 | b1 | c3 | d9 | e2 |
| 26 | a3 | b2 | c3 | d1 | e3 |
| 27 | a3 | b3 | c3 | d5 | e1 |
In addition, titanium dioxide was added to the composition, which provides anextended stay of substances in the stomach and increases their bioavailability [25].
The powder technology consisted in mixing by the trituration method 1/5 filler with titanium dioxide, phenylephrine hydrochloride, pheniramine maleate, and coloring. Ascorbic acid, acid fraction, flavoring, paracetamol, and alkaline fraction gradually added to the trituration mixture. It mixed and added the restof filler. The mixture passed through a sieve with a hole diameter of .
The obtained mass tested twice according to pharmaco-technological indicators, the solution characteristics of the sachet in of purified water studied. The experimental data subjected to statistical processing by the method of dispersion analysis and determined the influence of the nature of the investigated excipients on quality indicators.
The results of the dispersion analysis were summarized using the utility function. The best substances in the drug composition determined according to the most significant sum of the combined data of the ordinal numbers of the factor levels in the ranked series of advantages.
At the next stage of the research, amounts of selected excipients studied. For regulate the medium pH, sodium citrate was additionally introduced into the experimental plan. To choose the optimal content of titanium dioxide, its amount also studied. The list of factors and their levels in the study of the quantitative excipients characteristics in the formulation is given in Table 2.
| Marking | Factor | Factor level | ||
| Lower(-) | Basic (0) | Upper (+) | ||
| x1 | Quantity of calcium phosphate, g | 0.0820 | 0.7000 | 1.3180 |
| x2 | Quantity of citric acid anhydrous, g | 0.6500 | 0.9360 | 1.2220 |
| x3 | Quantity of malic acid, g | 0.0500 | 0.0900 | 0.1300 |
| x4 | Quantity of sodium citrate, g | 0 | 0.0605 | 0.1210 |
| x5 | Quantity of curcumin, g | 0.0213 | 0.0383 | 0.0400 |
| x6 | Quantity of lemon-lime flavoring, g | 0.1915 | 0.2000 | 0.2085 |
| x7 | Quantity of titanium dioxide, g | 0.0014 | 0.0032 | 0.0050 |
A research plan drawn using the random balance method (Table 3). The average weight of 22.13 g adjusted by the amount of sugar powder.
Technological properties of the powder and organoleptic characteristics of solution from the powder in of purified water studied.
| Batch | x1 | x2 | x3 | x4 | x5 | x6 | x7 |
| 28 | - | - | - | + | + | + | - |
| 29 | - | + | - | + | - | + | - |
| 30 | + | - | - | - | - | - | + |
| 31 | + | + | - | - | + | - | + |
| 32 | - | - | + | + | - | - | + |
| 33 | - | + | + | - | + | + | - |
| 34 | + | - | + | + | + | - | - |
| 35 | + | + | + | - | - | + | + |
| 36 | 0 | 0 | 0 | 0 | 0 | 0 | 0 |
| 37 | 0 | 0 | 0 | 0 | 0 | 0 | 0 |
Each batch of the drug were studied according to the pharmaco-technological and organoleptic indicators of the quality of powder masses and their solution. Scatter diagrams constructed based on the experimental results. Significant factors are taken from scatter diagrams, and their selection is proved by calculations [26, 27]. This made it possible to determine the influence of investigated quantitative factors on quality indicators.
The algorithm of the researched technologies is shown in Table 4. Schemes for the ingredients introduction differed in the components set for mixing and compaction and consisted of a stages different number (from 2 to 9).
| Factor | Batch | Factor level |
| A-product introduction scheme | 38 | a1- compacting of the mixture 1: paracetamol + phenylephrine hydrochloride + pheniramine maleate + ascorbic acid + sugarpowder; compacting of the mixture 2: sodium citrate + malic acid + citric acid anhydrous + calcium phosphate + curcumin + titanium dioxide + lemon-limeflavoring + sugarpowder; compacting of sugar and their mixing |
| 39 | a2- compacting of the mixture 1: paracetamol + calcium phosphate + curcumin + titanium dioxide + lemon-lime flavoring + sugar powder; compacting of sugar powder and their mixing with mixture 2: phenylephrine hydrochloride + pheniramine maleate + ascorbic acid + sodium citrate + malic acid + citric acid anhydrous | |
| 40 | a3- compacting of the mixture: phenylephrine hydrochloride + pheniramine maleate + ascorbic acid + paracetamol + sodium citrate + malic acid + citric acid anhydrous + calcium phosphate + curcumin + titanium dioxide + lemon-lime flavoring + sugar powder | |
| 41 | a4- compacting of the mixture 1: paracetamol + sodium citrate + malic acid + citric acid anhydrous + calcium phosphate + curcumin + titanium dioxide + lemon-lime flavoring + sugar powder and mixing with mixture 2: phenylephrine hydrochloride + pheniramine maleate + ascorbic acid + sugar powder | |
| 42 | a5- compacting of the mixture 1: phenylephrinehydrochloride+ pheniramine maleate + ascorbic acid + sugar powder + paracetamol; compacting of the mixture2: sodium citrate + malic acid + citric acid anhydrous + calcium phosphate + curcumin + titanium dioxide + lemon-lime flavoring + sugar powder; mixing them with sugarpowder | |
| 43 | a6- compacting of the mixture 1: paracetamol + sugarpowder; compacting of the mixture2: phenylephrinehydrochloride+ sugar powder; compacting of the mixture 3: pheniramine maleate + sugar powder; compacting of the mixture 4: sodium citrate + malic acid + citric acidanhydrous + calcium phosphate + sugar powder + curcumin + titanium dioxide + lemon-lime flavoring and mixing them with ascorbic acid | |
| 44 | a7- mixture 1: paracetamol + sugar powder; mixture 2: phenylephrine hydrochloride + pheniramine maleate + curcumin + titanium dioxide + sugar powder; mixing them with calcium phosphate and lemon-lime flavoring; compacting and mixing with mixture 3: ascorbic acid + sodium citrate + malic acid + citric acidanhydrous | |
| 45 | a8- compacting of the mixture1: paracetamol + curcumin + titanium dioxide + sugar powder + lemon-lime flavoring; compacting of the mixture 2: phenylephrine hydrochloride + pheniramine maleate + sugar powder + calcium phosphate; mixing them with mixture 3: ascorbic acid + sodium citrate + malic acid + citric acidanhydrous | |
| 46 | a9- compacting of the mixture1: paracetamol + curcumin + titanium dioxide + sugar powder + calcium phosphate + lemon-lime flavoring; mixing with mixture 2: phenylephrine hydrochloride + pheniramine maleate + sugar powder and mixture 3: ascorbic acid + sodium citrate + malic acid + citric acid anhydrous |
Each batch analyzed according to pharmacotechnological and analytical indicators. Experimental data were subjected to dispersion analysis and the optimal sequence of introducing the components is selected.
The powder is packed in sachets made of foil with a height of 11 cm and a width of 6 cm.
III. RESULTS
The reference drug Theraflu for cold and flu with lemon flavor, and powder for oral solution is presented in the form of free-flowing, large granules of white color with yellow inclusions and the smell of citrus fruits. One sachet contains paracetamol 0.325 g, pheniramine maleate 0.02 g, phenylephrine hydrochloride 0.01 g, ascorbic acid 0.05 g and excipients: sucrose, citric acid anhydrous, natural lemon flavoring, sodium citrate dihydrate, calcium phosphate, malic acid, titanium dioxide (E 171), sunset yellow dye (E 110), quinoline yellow tint (E 104). The drug is used for treating flu and cold symptoms and has an antipyretic, analgesic, and anti-allergic effect [28].
The drug Paracetamol phenylephrine pheniramine ascorbic acid , powder for oral solution is developed as a generic to the reference listed drug Theraflu for cold and flu with lemon flavor, powder for oral solution, Famar Orleans, France. The pharmaceutical form of the developed drug is identical to the reference one - powder for oral solution and has the same introduction method. The nature and number of the active pharmaceutical ingredients are the same for the developed and reference medicines.
When creating the developed drug in the form of a powder for the oral solution from of paracetamol, of phenylephrine hydrochloride, of pheniramine maleate, and of ascorbic acid, the ratio of active pharmaceutical ingredients and their physicochemical properties primarily taked into account. A small content of phenylephrine hydrochloride and pheniramine maleate can cause inhomogeneity of their distribution in the powder mixture, which requires their introduction by trituration. Paracetamol is an amorphous powder with poor flowability. So it is advisable to add a large number of fillers and use additional technological methods, which will prevent the caking of sachets [29, 30]. A feature of ascorbic acid is its high ability to oxidize at temperature.
During the development of the drug, the impact of the excipients physico-chemical characteristics included in the composition, their quantity on the critical quality indicators of the drug compared with the reference drug, and the regulatory requirements for this dosage form also studied.
Therefore, taking into account the above information and the results of the study of the reference drug Theraflu for cold and flu with lemon flavor, powder for oral solution, a target quality profile (QTPP) has been determined for generic paracetamol 325 mg, phenylephrine hydrochloride 10 mg, pheniramine maleate 20 mg, ascorbic acid 50 mg, powder for oral solution in the sachet. It is given in table 5.
| QTPP element | Purpose | Justification |
| Dosage form | Powder for oral solution | Pharmaceutical equivalence requirement: same dosage form |
| Route of administration | The oral route | Pharmaceutical equivalence requirement: same route of administration |
| Dose | 1 sachetcontains paracetamol 325 mg, phenylephrine hydrochloride 10 mg, pheniramine maleate 20 mg, ascorbic acid 50 mg | Pharmaceutical equivalence requirement: same strength |
| Stability | Shelf life is 2 years. Keep outin original packagingat a temperature not exceeding 25°C | Equivalent to or better than the reference listed drug shelf-life |
| Drug product quality attributes | Appearance | Pharmaceutical equivalence requirement: must meet the same Compendial or other applicable (quality) standards (i.e., identity, assay, purity) |
| Identification * | ||
| Average weight of the contents of the sachet | ||
| pH | ||
| Uniformity of dosage units | ||
| Loss on drying | ||
| Assay | ||
| Microbial purity * | ||
| Container/closure system | Sachet bag made of material similar to the reference listed drug | Necessary to achieve the target expiration date and ensure the stability of the drug during transportation |
| Administration | According to the SmPC for the reference listed drug | Equivalent to or better than the reference listed drug |
| Alternative method of use | Preliminary data is absent | Not applicable |
| Note: * - formulation and process variables are unlikely to impact the CQA. However, the CQA remains a target element of drug product profile and should be addressed accordingly | ||
To investigate the variability of the formulation and technology in the context of further studies, a risk assessment conducted. It includes previously acquired knowledge and experience in the development of similar drugs.
The initial risk assessment of formulation variables reflects the possible impact of the product formulation and the technological process of manufacturing the finished medicinal product on the established quality attributes.
In the process of risk assessment, quantitative factors were divided into three categories (high, medium, and low). The results of the initial risk assessment of composition variables are presented in table 6.
| Drug Product quality attributes | Formulation variability | Technology variability | ||||||||||
| Nature of alkaline fraction | Nature of acid fraction | Nature of coloring | Nature of flavoring | Nature of filler | Quantity of alkaline fraction | Quantity of acid fraction | Quantity of sodium citrate | Quantity of coloring | Quantity of flavoring | Quantity of titanium dioxide | Sequence of introduction of components | |
| Appearance | Medium | Medium | High | Medium | Medium | Medium | Medium | Medium | Medium | Medium | Medium | Low |
| pH | High | High | Low | Medium | Medium | High | High | Medium | Low | Medium | Medium | Low |
| Uniformity of dosage units | Low | Low | Low | Low | Low | Low | Low | Low | Low | Low | Low | High |
| Loss on drying | Low | Low | Low | Medium | Medium | Medium | Medium | Medium | Medium | Medium | Low | Low |
| Assay | Low | Low | Low | Low | Low | Low | Low | Low | Low | Low | Low | High |
| Batch | ||||||||||||||||||||||
| 1 | 4 | 3 | 0.5696 | 0.5729 | 0.6617 | 0.6627 | 13.92 | 13.54 | 9.1 | 9.1 | 37.8 | 38.0 | 0.95 | 0.95 | 1 | 1 | 5 | 4 | 4 | 5 | 5.57 | 5.57 |
| 2 | 2 | 2 | 0.6745 | 0.6735 | 0.7856 | 0.7765 | 14.14 | 13.27 | 10.7 | 10.3 | 38.0 | 38.0 | 0.70 | 1.24 | 2 | 2 | 4 | 5 | 5 | 4 | 6.83 | 6.83 |
| 3 | 4 | 5 | 0.4777 | 0.4725 | 0.5442 | 0.5443 | 12.22 | 13.19 | 13.7 | 12.6 | 40.0 | 41.7 | 0.91 | 0.91 | 2 | 2 | 4 | 3 | 4 | 5 | 4.93 | 4.93 |
| 4 | 5 | 5 | 0.5068 | 0.5054 | 0.7141 | 0.7121 | 29.03 | 29.03 | 25.3 | 28.3 | 45.6 | 45.4 | 0.37 | 0.37 | 2 | 2 | 5 | 5 | 5 | 5 | 5.00 | 5.01 |
| 5 | 5 | 5 | 0.8641 | 0.8632 | 0.9377 | 0.9318 | 7.85 | 7.37 | 6.6 | 5.9 | 37.1 | 38.3 | 0.73 | 0.73 | 2 | 2 | 5 | 4 | 5 | 5 | 5.98 | 5.98 |
| 6 | 3 | 4 | 0.6936 | 0.6907 | 0.8010 | 0.7976 | 13.40 | 13.40 | 8.3 | 8.6 | 36.2 | 34.8 | 7.29 | 7.29 | 2 | 2 | 4 | 4 | 5 | 4 | 4.83 | 4.83 |
| 7 | 5 | 5 | 0.7760 | 0.7742 | 1.0165 | 1.0141 | 23.66 | 23.66 | 39.4 | 40.0 | 36.9 | 34.8 | 0.51 | 0.51 | 3 | 2 | 5 | 5 | 5 | 5 | 3.89 | 3.89 |
| 8 | 5 | 5 | 0.5987 | 0.6000 | 0.8618 | 0.8636 | 30.53 | 30.53 | 114.5 | 110.0 | 45.5 | 47.1 | 0.38 | 0.38 | 3 | 3 | 4 | 3 | 4 | 4 | 4.67 | 4.67 |
| 9 | 4 | 5 | 0.6071 | 0.6087 | 0.7058 | 0.7000 | 13.98 | 13.04 | 9.7 | 10.0 | 38.2 | 37.6 | 0.75 | 0.75 | 2 | 2 | 3 | 3 | 5 | 5 | 4.02 | 4.02 |
| 10 | 5 | 5 | 0.5697 | 0.5657 | 0.7121 | 0.7000 | 20.00 | 19.19 | 10.0 | 10.1 | 37.7 | 37.4 | 0.61 | 0.61 | 5 | 5 | 4 | 3 | 4 | 5 | 5.44 | 5.44 |
| 11 | 5 | 5 | 0.6159 | 0.6134 | 0.8596 | 0.8623 | 28.35 | 28.87 | 39.0 | 46.0 | 44.9 | 45.1 | 0.47 | 0.47 | 5 | 5 | 4 | 4 | 5 | 5 | 6.75 | 6.75 |
| 12 | 5 | 5 | 0.5711 | 0.5684 | 0.8346 | 0.8308 | 31.58 | 31.58 | 22.6 | 21.4 | 46.8 | 47.5 | 0.56 | 0.56 | 3 | 4 | 4 | 5 | 4 | 5 | 4.64 | 4.64 |
| 13 | 5 | 5 | 0.4519 | 0.4516 | 0.5417 | 0.5385 | 16.58 | 16.13 | 14.6 | 14.8 | 39.3 | 39.3 | 1.23 | 1.23 | 3 | 3 | 4 | 5 | 5 | 4 | 4.98 | 4.98 |
| 14 | 5 | 5 | 0.5696 | 0.5670 | 0.6766 | 0.6707 | 15.82 | 15.46 | 9.9 | 9.7 | 38.5 | 38.0 | 0.98 | 0.98 | 3 | 2 | 4 | 3 | 4 | 3 | 5.99 | 5.99 |
| 15 | 5 | 5 | 0.6592 | 0.6563 | 0.7812 | 0.7778 | 15.63 | 15.63 | 10.4 | 10.1 | 38.2 | 37.4 | 1.14 | 1.14 | 3 | 4 | 5 | 4 | 5 | 5 | 4.94 | 4.94 |
| 16 | 5 | 5 | 0.7000 | 0.6979 | 0.8048 | 0.8072 | 13.02 | 13.54 | 15.9 | 9.0 | 35.9 | 36.1 | 7.47 | 7.47 | 4 | 3 | 5 | 5 | 5 | 4 | 3.86 | 3.86 |
| 17 | 5 | 5 | 0.5322 | 0.5269 | 0.7332 | 0.7313 | 27.42 | 27.96 | 54.8 | 79.0 | 42.5 | 40.1 | 0.37 | 0.37 | 3 | 4 | 5 | 5 | 5 | 4 | 4.79 | 4.79 |
| 18 | 5 | 5 | 0.9160 | 0.9140 | 1.0142 | 1.0119 | 9.68 | 9.68 | 6.7 | 6.8 | 38.6 | 35.2 | 0.32 | 0.32 | 3 | 4 | 5 | 5 | 5 | 5 | 3.96 | 3.96 |
| 19 | 5 | 5 | 0.8250 | 0.8191 | 0.9124 | 0.9059 | 9.57 | 9.57 | 7.3 | 7.4 | 39.2 | 39.5 | 0.73 | 0.73 | 5 | 5 | 4 | 5 | 5 | 5 | 5.42 | 5.42 |
| 20 | 5 | 4 | 0.6928 | 0.6947 | 0.7918 | 0.7857 | 12.50 | 11.58 | 9.9 | 10.0 | 35.8 | 35.0 | 7.65 | 7.65 | 5 | 5 | 5 | 4 | 5 | 5 | 6.64 | 6.64 |
| 21 | 5 | 5 | 0.4715 | 0.4688 | 0.6891 | 0.6923 | 31.58 | 32.29 | 19.1 | 21.3 | 48.7 | 48.8 | 0.41 | 0.41 | 5 | 5 | 5 | 4 | 5 | 4 | 4.69 | 4.69 |
| 22 | 5 | 5 | 0.6091 | 0.6044 | 0.8798 | 0.8730 | 30.77 | 30.77 | 98.2 | 109.6 | 47.7 | 47.8 | 0.35 | 0.35 | 3 | 3 | 4 | 5 | 4 | 3 | 4.78 | 4.78 |
| 23 | 5 | 5 | 0.5786 | 0.5745 | 0.6799 | 0.6750 | 14.89 | 14.89 | 10.2 | 10.6 | 37.7 | 36.9 | 0.65 | 0.65 | 3 | 3 | 5 | 5 | 4 | 3 | 5.91 | 5.91 |
| 24 | 5 | 5 | 0.6162 | 0.6105 | 0.8870 | 0.8788 | 30.53 | 30.53 | 52.6 | 61.4 | 42.4 | 44.8 | 0.58 | 0.58 | 3 | 3 | 4 | 3 | 5 | 4 | 4.67 | 4.67 |
| 25 | 4 | 4 | 0.7006 | 0.7021 | 0.8131 | 0.8148 | 13.83 | 13.83 | 11.7 | 11.8 | 36.1 | 36.9 | 0.78 | 0.78 | 3 | 4 | 4 | 5 | 3 | 4 | 3.99 | 3.99 |
| 26 | 4 | 5 | 0.4727 | 0.4731 | 0.5636 | 0.5641 | 16.13 | 16.13 | 14.1 | 14.2 | 42.1 | 41.8 | 0.79 | 0.79 | 3 | 3 | 5 | 5 | 3 | 4 | 4.86 | 4.86 |
| 27 | 5 | 5 | 0.5888 | 0.5938 | 0.6840 | 0.6867 | 13.92 | 13.54 | 9.7 | 10.1 | 37.3 | 37.8 | 1.16 | 1.16 | 3 | 4 | 5 | 5 | 4 | 3 | 3.94 | 3.94 |
Summary data of ordinal numbers of factor levels in the ranked series of advantages are given in table 8.
| Factor/indicator | a1 | a2 | a3 | b1 | b2 | b3 | c1 | c2 | c3 | d1 | d2 | d3 | d4 | d5 | d6 | d7 | d8 | d9 | e1 | e2 | e3 | e4 | e5 | e6 | e7 | e8 | e9 |
| y1 | 3 | 1 | 2 | 0 | 0 | 0 | 3 | 1 | 2 | 8 | 4.5 | 2 | 2 | 9 | 2 | 6.5 | 4.5 | 6.5 | 7 | 9 | 6 | 2.5 | 2.5 | 8 | 2.5 | 2.8 | 5 |
| y2 | 3 | 2 | 1 | 1 | 2 | 3 | 1 | 2 | 3 | 9 | 1 | 4 | 6 | 8 | 3 | 2 | 5 | 7 | 7 | 3 | 9 | 8 | 1 | 2 | 4 | 5 | 6 |
| y3 | 3 | 2 | 1 | 1 | 3 | 2 | 1 | 2 | 3 | 9 | 2 | 1 | 3 | 8 | 6 | 4 | 5 | 7 | 8 | 5 | 9 | 6 | 1 | 4 | 2 | 3 | 7 |
| y4 | 2 | 3 | 1 | 2 | 1 | 3 | 1 | 3 | 2 | 3 | 5 | 7 | 9 | 2 | 6 | 4 | 8 | 1 | 3 | 4 | 5 | 8 | 1 | 2 | 7 | 9 | 6 |
| y5 | 1 | 2 | 3 | 2 | 3 | 1 | 2 | 1 | 3 | 1 | 5 | 6 | 9 | 3 | 4 | 7 | 8 | 2 | 2 | 5 | 6 | 7 | 1 | 4 | 8 | 9 | 3 |
| y6 | 1 | 2 | 3 | 3 | 2 | 1 | 3 | 2 | 1 | 6 | 5 | 4 | 2 | 9 | 3 | 7 | 1 | 8 | 6 | 8 | 4 | 2 | 5 | 9 | 3 | 1 | 7 |
| y7 | 2 | 3 | 1 | 0 | 0 | 0 | 0 | 0 | 0 | 5 | 7 | 3 | 1.5 | 6 | 9 | 8 | 1.5 | 4 | 8 | 6 | 7 | 1 | 4 | 9 | 3 | 2 | 5 |
| y8 | 1 | 3 | 2 | 0 | 0 | 0 | 3 | 2 | 1 | 9 | 3 | 6 | 1 | 7 | 3 | 3 | 5 | 8 | 9 | 7 | 8 | 2.5 | 2.5 | 2.5 | 2.5 | 6 | 5 |
| y9 | 3 | 2 | 1 | 1 | 2 | 3 | 3 | 2 | 1 | 4 | 1.5 | 1.5 | 9 | 4 | 4 | 6 | 7.5 | 7.5 | 5.5 | 3.5 | 5.5 | 1 | 2 | 3.5 | 7.5 | 7.5 | 9 |
| y10 | 1 | 3 | 2 | 2 | 3 | 1 | 1 | 2 | 3 | 7 | 1 | 7 | 7 | 4.5 | 2.5 | 2.5 | 4.5 | 9 | 7.5 | 5.5 | 7.5 | 3.5 | 1 | 3.5 | 2 | 9 | 5.5 |
| y11 | 3 | 2 | 1 | 2 | 3 | 1 | 3 | 2 | 1 | 6 | 8 | 1 | 3 | 9 | 2 | 5 | 7 | 4 | 8 | 9 | 3 | 2 | 6 | 5 | 4 | 1 | 7 |
| Total | 2.09 | 2.27 | 1.64 | 1.27 | 1.73 | 1.36 | 1.91 | 1.73 | 1.82 | 6.09 | 3.91 | 3.86 | 4.77 | 6.32 | 4.05 | 5 | 5.18 | 5.82 | 6.45 | 5.91 | 6.36 | 3.95 | 2.45 | 4.77 | 4.14 | 5.03 | 5.95 |
The utility function shows that the ranked number of advantages the studied alkaline fraction is as follows: , so calcium phosphate received the advantages. The best-generalized indicators were observed when using citric acid anhydrous ( ) among the excipients group of the acid fraction. However, the lowest pH is provided by a mixture of citric acid anhydrous and malic acid (5:1) ( ). So a decision was made to study their optimal ratio further. Curcumin ( ) was the unequivocal leader among colorings (factor C). There is the advantages of excipients of natural origin over yellow iron oxide: . The ranked order of preference for factor D can be represented as an inequality: orange (3.86) > lemon-lime (3.91) > raspberry (4.05) > grapefruit (4.77) > strawberry (5.00) > apple (5.18) > chocolate (5.82) > lemon (6.09) > blackcurrant (6.32). Orange and lemon-lime flavorings have close overall results. Still, according to the main indicator for this factor ( - thetaste of the solution), advantages were obtained by lemon-lime ( ), which was selected for further research. The generalized inequality of the advantages of factor E is as follows: a mixture of sucrose with xylitol mannitol powdered sugar dextrose hydrate lactose monohydrate 200 sorbitol 60 maltitol sorbitol 450 fructose . Among the studied levels of factor A,a mixture of sucrose and xylitol was preferred. Considering the economic costs, other excipients based on sucrose should be considered as a filler, in particular, powdered sugar , with the use of additional technological techniques.
Therefore, according to the results of the trough function, it is advisable to introduce calcium phosphate , anhydrous citric acid , malic acid , curcumin , lemon-lime flavoring , and powdered sugar into the composition of the powder for oral solution .
The results of the tests in the study of the excipients quantities are given in table 9.
| Batch | |||||||||||
| 28 | 5 | 0.6086 | 0.8844 | 31.18 | 56.8 | 48.3 | 0.30 | 5 | 5 | 4 | 3.05 |
| 29 | 4 | 0.6403 | 0.8658 | 26.05 | 44.9 | 47.5 | 0.31 | 5 | 4 | 5 | 2.78 |
| 30 | 5 | 0.7403 | 1.0193 | 27.37 | 52.7 | 41.0 | 0.32 | 4 | 4 | 3 | 4.01 |
| 31 | 5 | 0.7393 | 1.0071 | 26.59 | 50.1 | 40.5 | 0.46 | 4 | 4 | 5 | 3.74 |
| 32 | 4 | 0.6502 | 0.8824 | 26.31 | 17.5 | 46.9 | 0.37 | 5 | 4 | 4 | 3.10 |
| 33 | 5 | 0.6187 | 0.8517 | 27.36 | 18.4 | 46.6 | 0.46 | 5 | 5 | 5 | 2.58 |
| 34 | 5 | 0.7246 | 1.0016 | 27.66 | 69.1 | 41.7 | 0.46 | 4 | 4 | 3 | 3.98 |
| 35 | 4 | 0.7444 | 1.0066 | 26.05 | 66.6 | 41.4 | 0.39 | 4 | 5 | 3 | 3.70 |
| 36 | 5 | 0.6944 | 0.9742 | 28.72 | 62.6 | 43.6 | 0.50 | 4 | 4 | 5 | 3.60 |
| 37 | 5 | 0.7075 | 0.9988 | 29.16 | 57.6 | 45.2 | 0.42 | 4 | 4 | 4 | 3.60 |
| Notes: appearance of the powder, score; bulk density, g/ml; tapped density, g/ml; Carr's index,%; flowability, s/100 g; angle of repose, °; loss on drying,%; appearance of the solution, score; smell of the solution, score; taste of the solution, score; pH of the solution | |||||||||||
To summarize the experimental data obtained, a table 10 was constructed.
| Factor/ indicator | x1 | x2 | x3 | x4 | x5 | x6 | x7 |
| y1 | +* | 0 | 0 | -* | +* | -* | 0 |
| y2 | +* | + | - | -* | - | -* | +* |
| y3 | +* | - | - | -* | - | -* | +* |
| y4 | - | +* | + | - | -* | + | +* |
| y5 | -* | + | +* | + | - | + | - |
| y6 | -* | - | 0 | +* | + | +* | -* |
| y7 | -* | -* | -* | +* | -* | +* | + |
| y8 | -* | 0 | 0 | +* | 0 | +* | -* |
| y9 | - | + | + | - | + | +* | - |
| y10 | -* | +* | -* | + | +* | +* | + |
| y11 | -* | + | 0 | +* | + | +* | -* |
| Total | - | + | - | + | 0 | + | 0 |
| Note: * - a significant factor | |||||||
Based on the total values of the generalized results, the levels of the studied factors selected: lower for factors , , upper for factors , , , and basic for factors and .
The conducted studies made it possible to establish the optimal composition of the powder for oral solution (Table 11).
| Ingredient | Quantity, g/sashet | Quantity,% |
| Paracetamol | 0.3250 | 1.47 |
| Ascorbic acid | 0.0500 | 0.23 |
| Phenylephrine hydrochloride | 0.0100 | 0.05 |
| Pheniramine maleate | 0.0200 | 0.09 |
| Calcium phosphate | 0.0820 | 0.37 |
| Sodium citrate | 0.1210 | 0.55 |
| Citric acid anhydrous | 1.2220 | 5.52 |
| Malic acid | 0.0500 | 0.23 |
| Curcumin | 0.0383 | 0.17 |
| Lemon-lime flavoring | 0.2085 | 0.94 |
| Titanium dioxide | 0.0032 | 0.01 |
| Sugar powder | 20.0000 | 90.38 |
| Total | 22.1300 | 100.00 |
The proposed composition of the powder for the oral solution had the following characteristics: bulk density , tapped density of , Carrs index , flowability , angle of repose pH of the solution 2.81 and satisfactory organoleptic properties.
Poor powder flowability can cause problems in the operation of the machine during packaging and inhomogeneity of dosage in sachets.
For improve the properties of the powder, the sequence of the introduction of the ingredients studied, and the optimal technology selected. A modern solution to the technical task is using the roller compaction method [31-35]. The results of the study of the pharmaco-technological and analytical indicators of the powder obtained by the proposed technologies are shown in table 12.
| Bat ch | ||||||||||||||||||||||||||
| 38 | 0.82 | 0.82 | 1.02 | 1.01 | 19. | 19. | 5. | 5. | 38 | 37 | 97.3 | 101. | 3.0 | 4.1 | 99.2 | 103. | 2. | 3. | 93.3 | 109. | 9. | 6. | 96.0 | 103. | 5.6 | 7.4 |
| 25 | 01 | 04 | 96 | 39 | 57 | 3 | 5 | .2 | .9 | 5 | 54 | 2 | 6 | 8 | 18 | 50 | 85 | 5 | 63 | 34 | 53 | 0 | 51 | 4 | 1 | |
| 39 | 0.77 | 0.77 | 1.01 | 1.02 | 24. | 24. | 6. | 5. | 39 | 40 | 102. | 98.7 | 2.1 | 3.4 | 103. | 96.8 | 3. | 4. | 74.5 | 121. | 8. | 9. | 105. | 103. | 13. | 18. |
| 02 | 12 | 97 | 03 | 47 | 41 | 3 | 9 | .3 | .0 | 81 | 6 | 2 | 8 | 47 | 5 | 40 | 12 | 5 | 04 | 59 | 25 | 30 | 84 | 74 | 29 | |
| 40 | 0.78 | 0.78 | 1.01 | 1.02 | 23. | 22. | 5. | 5. | 39 | 38 | 97.0 | 103. | 11. | 13. | 104. | 96.7 | 2. | 3. | 98.4 | 103. | 6. | 8. | 96.2 | 104. | 6.2 | 7.2 |
| 33 | 59 | 95 | 05 | 17 | 99 | 5 | 7 | .4 | .6 | 2 | 63 | 08 | 21 | 80 | 4 | 20 | 72 | 7 | 45 | 93 | 31 | 0 | 90 | 8 | 7 | |
| 41 | 0.78 | 0.77 | 0.98 | 0.97 | 20. | 20. | 4. | 5. | 41 | 39 | 102. | 101. | 1.4 | 2.8 | 100. | 100. | 2. | 1. | 102. | 99.2 | 5. | 3. | 102. | 103. | 3.6 | 3.6 |
| 28 | 45 | 23 | 61 | 31 | 65 | 8 | 6 | .3 | .2 | 88 | 49 | 9 | 4 | 94 | 55 | 20 | 60 | 62 | 6 | 33 | 63 | 80 | 10 | 2 | 3 | |
| 42 | 0.78 | 0.78 | 1.01 | 1.01 | 22. | 22. | 6. | 5. | 40 | 40 | 96.4 | 104. | 22. | 26. | 104. | 97.1 | 1. | 2. | 97.5 | 104. | 8. | 7. | 97.6 | 102. | 15. | 18. |
| 82 | 74 | 97 | 83 | 70 | 68 | 1 | 9 | .9 | .3 | 9 | 93 | 07 | 58 | 43 | 6 | 10 | 47 | 1 | 81 | 28 | 63 | 0 | 76 | 63 | 47 | |
| 43 | 0.78 | 0.78 | 1.05 | 1.05 | 25. | 25. | 6. | 6. | 38 | 39 | 94.1 | 97.2 | 4.4 | 3.3 | 106. | 99.6 | 2. | 3. | 110. | 105. | 3. | 4. | 99.8 | 104. | 3.5 | 4.1 |
| 09 | 17 | 17 | 30 | 75 | 76 | 3 | 0 | .7 | .2 | 0 | 6 | 3 | 7 | 12 | 3 | 00 | 41 | 98 | 79 | 77 | 12 | 0 | 42 | 9 | 5 | |
| 44 | 0.80 | 0.80 | 1.01 | 1.01 | 20. | 20. | 7. | 6. | 37 | 38 | 100. | 103. | 1.4 | 2.1 | 101. | 103. | 2. | 3. | 100. | 103. | 4. | 2. | 101. | 104. | 1.8 | 3.0 |
| 55 | 43 | 70 | 42 | 80 | 70 | 2 | 9 | .2 | .5 | 63 | 97 | 2 | 4 | 36 | 61 | 50 | 18 | 94 | 41 | 23 | 61 | 50 | 69 | 6 | 2 | |
| 45 | 0.77 | 0.78 | 1.01 | 1.01 | 23. | 22. | 6. | 6. | 38 | 39 | 100. | 104. | 1.7 | 2.8 | 101. | 102. | 2. | 2. | 101. | 104. | 4. | 3. | 101. | 103. | 1.4 | 2.4 |
| 92 | 18 | 69 | 49 | 37 | 97 | 8 | 5 | .7 | .4 | 80 | 59 | 9 | 1 | 70 | 93 | 20 | 16 | 21 | 53 | 48 | 04 | 50 | 15 | 3 | 5 | |
| 46 | 0.81 | 0.81 | 1.08 | 1.07 | 24. | 24. | 5. | 4. | 38 | 39 | 100. | 102. | 2.4 | 1.6 | 102. | 97.3 | 2. | 3. | 100. | 103. | 4. | 2. | 103. | 99.0 | 4.0 | 4.6 |
| 73 | 51 | 01 | 71 | 33 | 32 | 2 | 9 | .4 | .7 | 47 | 38 | 7 | 5 | 60 | 7 | 80 | 98 | 40 | 18 | 23 | 31 | 00 | 6 | 3 | 2 |
The results of the dispersion analysis of the research data on the technologies of the powder for oral solution show deviations of the pharmaco-technological indicators within the measurement error. They do not depend on the technology used. According to the results of the analysis of the quantitative content of the active pharmaceutical ingredients and the uniformity of the dosage units, it established that the technology meets the pharmacopoeial requirements, therefore, this method of introducing the ingredients chosen as optimal. It included the following stages. Compacting of the mixture 1: paracetamol + curcumin + titanium dioxide + sugar powder + calcium phosphate + lemon-lime flavoring; mixing with mixture 2: phenylephrine hydrochloride + pheniramine maleate + sugar powder and mixture 3: ascorbic acid + sodium citrate + malic acid + citric acid anhydrous.
Based on study results, the risk assessment of variability of the formulation and technology was revised.
The risk of all variables belong to the low risk.
IV. DISCUSSION
a) Selection of the nature of excipients
The results of the dispersion analysis showed that the influence of the factors on the appearance of the powder is expressed as follows: . It was experimentally confirmed that dyes have the most significant influence on the appearance of the powder. With the addition of curcumin, the powders had a uniform yellowish color, and their appearance was rated at 5 points.
The use of riboflavin provided an intense yellow-hot homogeneous color (4.78 points), and the introduction of iron oxide was accompanied by nonuniform distribution in the mass and obtaining powders with dark brown spots on a white background (4.22 points). The ranked series for factor E (fillers) is as follows: powdered sugar = lactose monohydrate 200 = mannitol = mixture of sucrose with xylitol (5 points) > maltitol (4.83 points) > sorbitol 450 (4.67 points) > fructose (4.5 points) > dextrose hydrate (4.33 points) > sorbitol 60 (3.67 points). Among the excipients of the alkaline fraction, calciumphosphate is slightly inferior to calcium carbonate in terms of its effect on the appearance of the powder (4.78 points versus 4.83 points, respectively). With the addition of sodium bicarbonate, the powders were rated at an average of 4.39 points. The ranked order for flavors is as follows: ( ; ) ( points) > ( ) ( points) > ( ) ( points) > ( points) > ( points). The greatest value of the appearance of the powder was obtained when using orange, grapefruit, and raspberry flavorings.
The results of data on bulk density showed the influence of factors that were ranked as follows: . The ranked series for factor looks as follows: (Fig. 1).
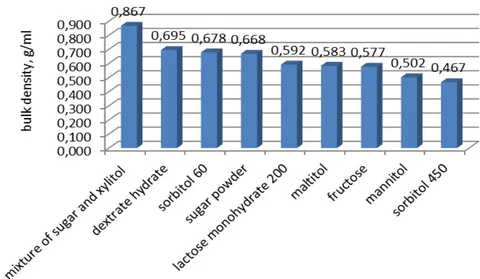
The ranked series for flavors is as follows: lemon-lime (0.7050 g/ml) > strawberry (0.6817 g/ml) > raspberry (0.6783 g/ml) > orange (0.6400 g/ml) > apple (0.6100 g/ml) > grapefruit (0.5933 g/ml) > chocolate (0.5817 g/ml) > black currant (0.5717 g/ml) > lemon (0.5667 g/ml). Calcium phosphate (0.6544 g/ml) had the greatest impact on bulk density, calcium carbonate (0.6150 g/ml) differed significantly in its positive influence, masses containing sodium hydrogen carbonate (0.6067 g/ml) had the worst bulk density ml). The ranked series for dyes is as follows: (0.6406 g/ml)
. The anhydrous citric acid is the leader among excipients of the acid fraction in terms of bulk density. A mixture of anhydrous citric and malic acids (5:1) has slight advantages over malic acid and 0.6211 g/ml, respectively).
The results of the variance analysis showed that the influence of the factors on tapped density is expressed as follows: . The ranked series for factor C looks as follows: (Fig. 2).
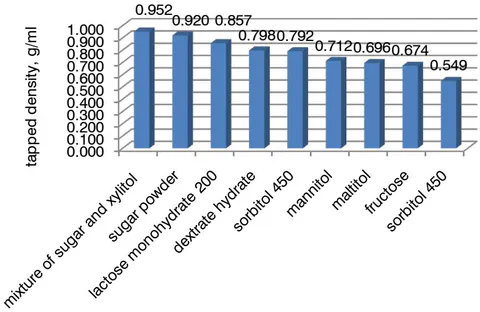
The rank order for factor D is as follows: orange (0.8418 g/ml) > lemon-lime (0.8383 g/ml) > grapefruit (0.8172 g/ml) > strawberry (0.8136 g/ml) > apple (0.8134 g/ml) > raspberry (0.8105 g/ml) > chocolate (0.6773 g/ml) > black currant (0.6688 g/ml) > lemon (0.6685 g/ml). Calcium phosphate (0.7995 g/ml) was preferred among the excipients of the alkaline fraction in terms of tapped density. It is inferior to calcium carbonate (0.7641 g/ml) and sodium bicarbonate
(0.7529 g/ml). The influence of the acid fraction on tapped density is expressed by the following inequality: . So, anhydrous citric acid has advantages. The ranked order of preference for factor C illustrates the ranked order of preference: ferric oxide (0.7795 g/ml) > curcumin (0.7716 g/ml) > riboflavin (0.7654 g/ml).
The flowability of the powder was expressed using Carr's index . The results of dispersion analysis showed that the influence of factors on this indicator is expressed as follows: . Fillers can be ranked in the following sequence by their influence on Carr's index: (8.95%) (12.91%) (14.37%) (14.39%) (15.06%) (16.00%) (27.60%) (29.55%) (30.96%). It shows the advantages of amixture of sucrose and xylitol on Carr's index of the powder. The ranked series for flavorings looks like this: (14.06%) (14.60%) (15.16%) (16.89%) (16.92%) (17.61%) (23.38%) (24.30%) (26.89%). So, chocolate flavoring has the greatest influence on flowability. Among colorings, iron oxide provides an average Carr's index of 17.54%, which is dominated by riboflavin (19.27%) and curcumin (19.78%). The leader of the alkaline fraction in terms of influence on Carr's index is calcium phosphate (18.00%), followed by sodium bicarbonate (19.27%) and calcium carbonate (19.32%). The mixture of citric acidanhydrous and malic acid (18.54%) exhibits dominant properties on Carr'sindex among the acid fraction. The use of citric acid anhydrous providesCarr's index of 18.87% and malic acid - 19.19%.
The results of flowability data showed the influence of the factors that ranked in this way: . The influence of the investigated fillers on flowability reflects inequality: a mixture of sucrose with xylitol fructose maltitol dextrose hydrate sorbitol 60 sorbitol 450 mannitol powdered sugar lactose monohydrate 200 . The ranked series of advantages of flavorings on flowability has the following form: . Lemon flavoring preferred. Sodium bicarbonate has the dominant flowability properties. It is inferior to calcium carbonate and calcium phosphate
s/100 g). Based on the results of statistical processing of the experimental data, a ranked series of the acid fraction for flowability obtained: (17.5 s/100 g) > (26.2 s/100 g) > (31.4 s/100 g), which shows the advantage malic acid. Curcumin (21.7 s/100 g) is the leader among colorings in flowability. According to this indicator, iron oxide has slight advantages over riboflavin (26.2 s/100 g and 27.2 s/100 g, respectively).
When studying the angle of repose , the influence of all the studied factors were established, which were ranked as follows: . Among the fillers, powdered sugar provided the optimal values of this indicator at the level of . High angle of repose results were characterized by mannitol and lactose monohydrate 200 . A decrease in the values of angle of repose was observed in the powder, which included dextrose hydrate , sorbitol 60 , maltitol , fructose , a mixture of sucrose with xylitol and sorbitol 450 . Among alkaline fraction, calcium phosphate is the leader and has advantages over calcium carbonate and sodium bicarbonate . The ranked order for flavorings is as follows: . According to the effect on the angle of repose, the colorings were placed in the following sequence: iron oxide , curcumin , and riboflavin . Among the acid fraction, citric acid anhydrous has advantages over a mixture of citric acid anhydrous and malic acid and malic acid .
An important indicator of the quality of the powder, which can affect the stability of the drug, is the loss of drying . The influence of the studied factors on this indicator reflects the inequality: . The ranked number of advantages of fillers for weight loss during drying is as follows: (Fig. 3).
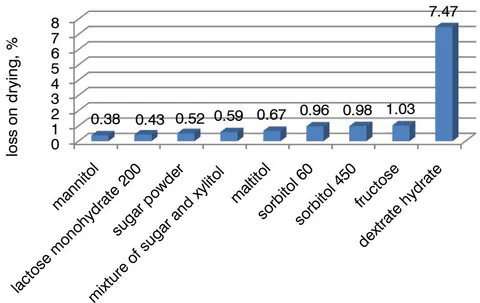
The dependence of flavorings on the loss on drying illustrates the inequality: grapefruit (apple) (0.52%) > orange (0.57%) > chocolate (0.89%) > lemon (0.96%) > black currant (1.12%) > lemon-lime (2.78%) > strawberry (2.80%) > raspberry (2.87%). Calcium phosphate (1.39%) has the leading properties among alkaline fraction, which is dominated by sodium bicarbonate (1.47%) and calcium carbonate (1.48%).
The powder for the oral solution as a dosage form must meet not only pharmacopoeial requirements but also consumer characteristics. Since patients take the powder in dissolved form, the organoleptic characteristics of the solution, which evaluated on a 5-point scale, were studied during development. According to the appearance of the solution , the tested mixtures differed in transparency and color intensity. The influence of experimental factors on the appearance of the solution can be ranked as follows: (E). On average, riboflavin and curcumin provided the appearance of the solution with 3.78 points and 3.67 points, respectively, compared to iron oxide - 2.06 points. Among the alkaline fraction, sodium bicarbonate provided the best results of this indicator (3.72 points). It was inferior to calcium phosphate (3.11 points) and calcium carbonate (2.67 points). The ranked number offlavoring advantages is as follows: (3.67 points) ( ) (3.50 points) (3.33 points) (3.00 points) (2.83 points) (2.67 points) (2.50 points). The influence of fillers on the appearance of the solution reflects inequality: ( ) (3.50 points) (3.33 points) (3.17 points) (3.00 points) (2.67 points) (2.33 points).
The results of statistical processing of experimental data show that not only flavorings affect the smell of the solution . According to the impact on this indicator, the investigated factors can placed in the following sequence: (C) . The ranked number of preferences of flavorings for smell of the solution is as follows: lemon-lime (orange) (4.83 points) lemon (blackcurrant; raspberry) (4.67 points) strawberry (4.50 points) apple (chocolate) (3.83 points) grapefruit (3.50 points). Among the acid fraction, citric acid anhydrous improves the odor of the solution by an average of 4.56 points, a mixture of citric acid anhydrous and malic acid by 4.39 points, and malic acid by 4.17 points. Riboflavin (4.56 points) is the leader among colorings in terms of impact on the smell of the solution. Curcumin (4.39 points) has advantages over iron oxide (4.17 points). The dependence of the studied indicator on the nature of the filler reflects a ranked number of advantages: (4.83 points) (4.67 points) ( ) (4.50 points) ( ) (4.33 points) ( ) (4.17 points) (3.83 points). In terms of impact on the smell of the solution, calcium phosphate exhibits dominant properties (4.56 points). It is somewhat inferior to calcium carbonate (4.33 points) and sodium bicarbonate (4.22 points).
The taste characteristics of the solution made it possible to reflect the influence of factors in the form of the following inequality: . Among the dyes, the leader was iron oxide (4.67 points), which had slight advantages over curcumin (4, 56 points) and riboflavin (4.17 points). The ranked number of advantages of fillers is as follows: (5.00 points) (4.83 points) ( ) (4.67 points) ( ) (4.33 points) ( ) (4.17 points) (4.00 points). The effect of the acid fraction on the taste of the solution can be represented as follows: malic acid (4.67 points) citric acid anhydrous (4.44 points) mixture of citric acid anhydrous and malic acid (4.28 points). The advantages of the lemon-lime flavoring are shown by inequality: (5.00 points) ( ) (4.67 points) ( ) (4.50 points) ( ; ) (4.33 points) (3.83 points). The dependence of the taste of the solution on the alkaline fraction shown by the expression: sodium bicarbonate (4.67 points) calcium phosphate (4.39 points) calcium carbonate (4.33 points).
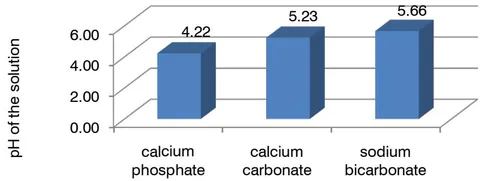
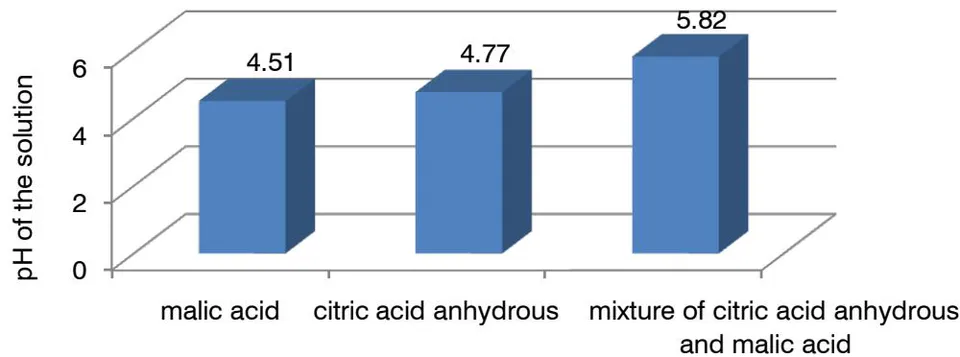
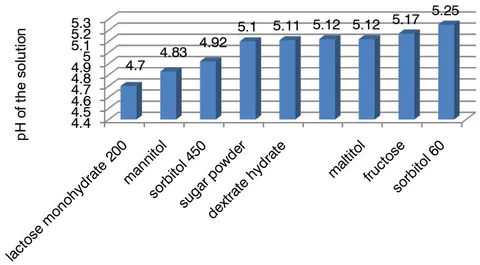
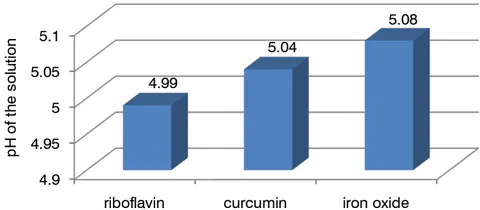
One of the most important indicators of the powder was the pH of the solution . The solubility of the dosage form depended on it. At low pH values, the powder wholly dissolved and did not leave a residue. The influence of the investigated factors on the pH of the solution was significant for all factors, which were ranked as follows: A > B > E > D > C. Fig. 4 shows the advantages of calcium phosphate over calcium carbonate and sodium bicarbonate.
Among acid fraction excipients, malic acid shows dominant properties in the pH of the solution (Fig. 5).
The ranked number of advantages of fillers on pH of the solution is as follows: ( (Fig. 6)).
The effect of flavorings on pH of the solution reflects inequality: (Fig. 7).
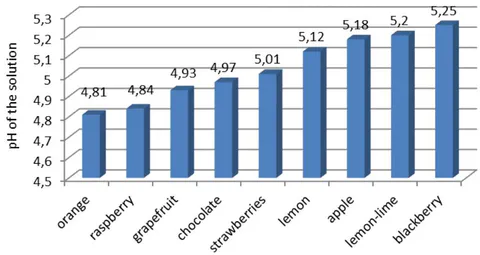

Figure 8 shows the dependence of the pH of the solution on the nature of coloring. Natural colorings have advantages over synthetic iron oxide[36].
b) Study of the quantities of excipients
The influence of quantitative factors on the appearance of the powder (y1) is shown in Figure 9.
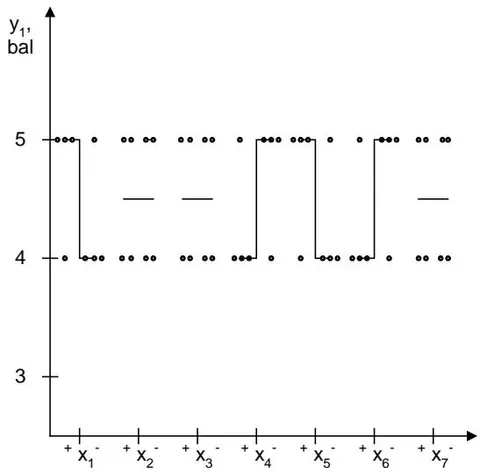
The analysis of the scattering diagram of the study of the influence of quantitative factors on the appearance of the powder showed that the most significant of this indicator is infused with calcium phosphate, sodium citrate, curcumin, and lemon-lime flavor. The intensity of color and appearance of the powder is significantly increased, with an increase in the quantity of calcium phosphate and curcumin, and the study of the lower levels of factors and . The analysis of the influence of other factors showed their insignificant effect on this indicator.
The influence of quantitative factors on the bulk density and the density after shrinkage is given in Fig. 10.
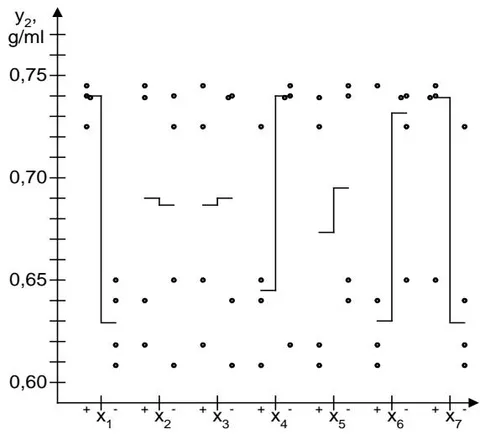
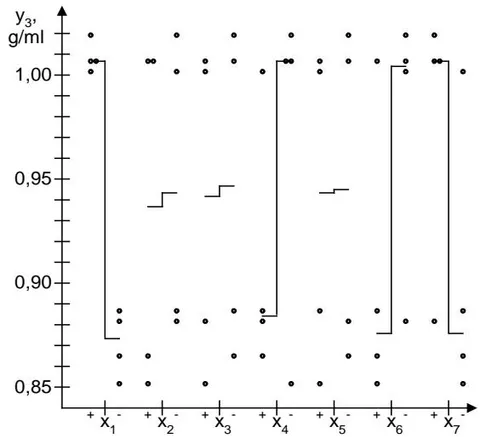
The diagrams show that the significant factors are , and . Increasing the quantities of calcium phosphate and titanium dioxide, as well as reducing the content of sodium citrate and flavor of lemon-lime, is accompanied by an improvement in the studied parameters.
Analysis of the scattering diagram of Carr's index showed that the results of the study are most influenced by the factors , and . With an increase in the content of lemon acid anhydrous and titanium dioxide, the bulk density of the powder mass improves from to . The adding greater quantity of curcumin is accompanied by an increase in Carr's index from to , which indicates deterioration of mass flowability and may cause damage of filling in the packaging stage.
An illustration of the influence of quantitative factors on flowability is shown in Figure 11.
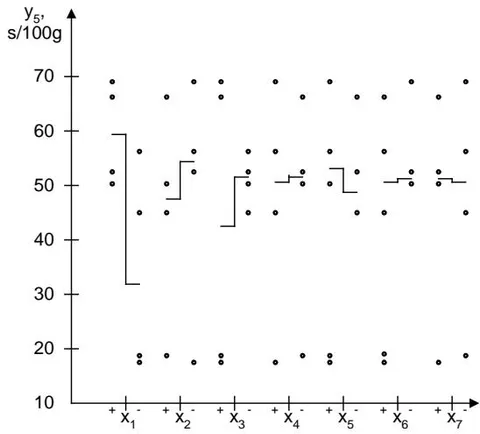
The analysis of the scattering diagram of the study of the effect of quantitative factors on flowability showed that the experimental values most significantly depend on the quantity of calcium phosphate. The increase in the factor is accompanied by a deterioration of the powder flowability from 32.0 s/100 g to 59.0 s/100 g. This indicator is somewhat improved (varies in the range from to ) with the administration of a greater quantity of malic acid due to the crystalline structure of its particles.
The scatter diagram of the influence of quantitative factors on the angle of repose is shown in Fig. 12.
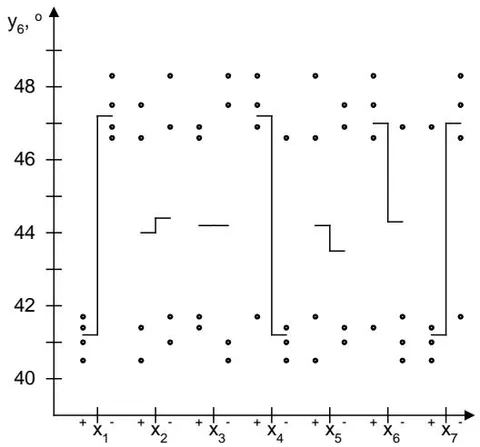
In assessing the influence of quantitative factors on the angle of repose, using the scatter diagram, it noted that the factors , , and are the most significant. At the same time, when the quantity of calcium phosphate and titanium dioxide decreases, the difference in the average is from to . However, the introduction of more sodium citrate is accompanied by opposite changes. It should be noted that the increase in the quantity of lemon-lime flavor improves the angle of repose from to .
Loss in mass during drying is an essential indicator of quality, especially in storing powder in sachet packs. High moisture content can cause the powders to soften and impair their characteristics. The influence of quantitative factors on mass loss during drying is shown in Fig. 13.
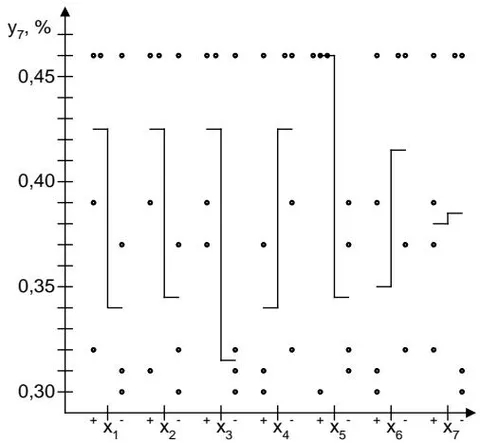
It can seen from the diagram that the factors and show the most significant influence on the mass loss index during drying. The lowest values of this index were observed with the addition of 0.0213 g of curcumin. The introduction of malic acid at the lower investigated level also significantly reduces the moisture content of the powder. Reducing the quantities of calcium phosphate and anhydrous citric acid leads to an improvement in the investigated index. However, an increase in sodium citrate content and a lemon-lime flavor can reduce the loss of mass in mass during drying.
For the powder for oral solution, essential parameters are also organoleptic characteristics of the solution from the content of the sachet pack. To quantify their contents, one packet of powder was dissolved in of purified water, and the solution analyzed in terms of appearance, smell, taste, and pH. The appearance of the obtained solutions is shown in Figure 14.
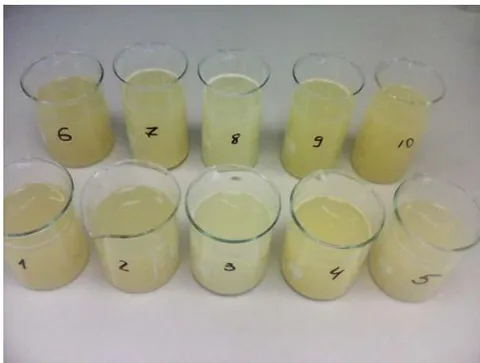
It can seen from the figure that the solutions differed in color intensity and transparency. The influence of quantitative factors on the appearance of the solution is shown in Fig. 15.
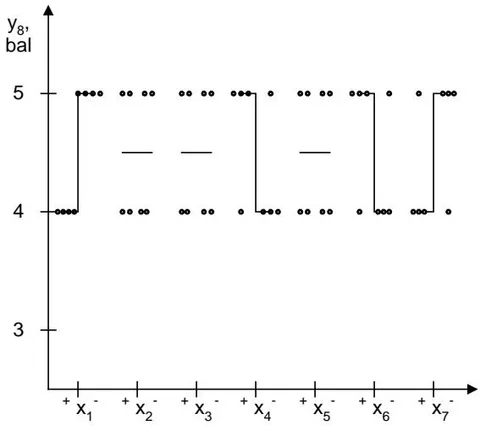
Based on of the scattering diagram of the appearance of the solution, the determining influence of the factors , and is established. With increasing quantities of sodium citrate and lemon-lime flavor, transparent solution with intense coloration obtained. Administration of higher contents of calcium phosphate and titanium dioxide causes turbidity of the solution.
The influence of quantitative factors on the smell of the solution is shown in Figure 16.
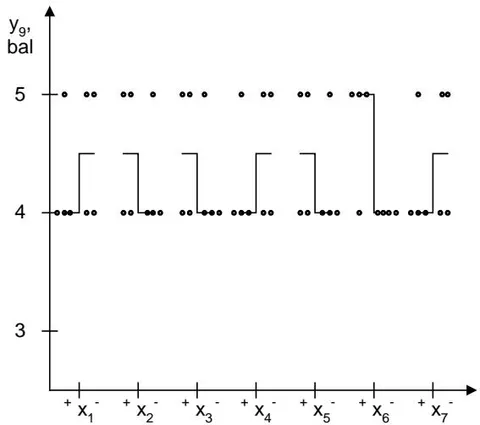
The significance of the quantity of lemon-lime flavor on the smell of the solution, and with the increase in its content, the results improve. There is also an insignificant influence of other factors on the smell of the solution.
The influence of quantitative factors on the taste of the solution is shown in fig.17.
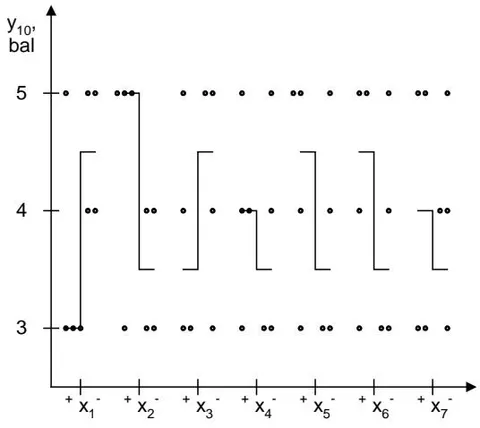
Analysis of the scattering diagram of the taste of the solution showed that the most significant are the factors and . With an increase in the quantity of acid citric anhydrous, there is a pleasant sour taste, and an increase in calcium phosphate content contrary effect on the taste of the solution. Adding more malic acid also causes unpleasant taste sensations. An increase in the quantities of curcumin and lemon-lime flavor adds a sour taste, allowing some improvement in the investigated parameter.
One of the most important characteristics was the pH of the solution . It depended on the solubility of the content of the sachet package. At low values, the pH of the powder was dissolved entirely and left no residue. The influence of quantitative factors on the pH of the solution is shown in Fig. 18.
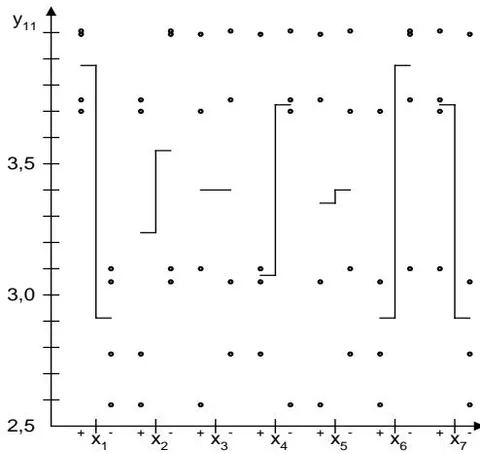
The diagram shows that the most significant factors are and . Significant influence is demonstrated by the factors and . The lowest pH values were observed with the addition of 0.0820 g of calcium phosphate, 0.1210 g of sodium citrate, 0.2085 g of lemon-lime flavour, and 0.0014 g of titanium dioxide[37].
V. CONCLUSIONS
A combined generic drug in the form of a powder for oral solution in sachets has been developed.It includes paracetamol, ascorbic acid, phenylephrine hydrochloride, and pheniramine maleate.
The quality target product profile described; the critical quality attributes defined. A risk assessment of formulation and technology variability was performed. Considering the development study results, the risks of all variables were reduced to the low risk.
The influence of 27 excipients from 5 functional groups on 11 quality attributes studied for the production of powder for oral solution. Statistical processing of the experiment results performed by the dispersion analysis. A significant influence of the pH of the solution on the solubility of the investigated powder was noted. Excipients were selected by using the utility function from the groups: alkaline and acid fractions, coloring, flavoring, and filler.
The influence of the quantities of 7 excipients on the pharmaco-technological properties of the powder and the physical characteristics of the solution was studied using the random balance method. A scatter plot plotted using the study results; significant factors were identified on as the basis of median values. Amounts of excipients that ensure the best quality attributes were selected. The optimal composition of the powder for oral solution is proposed: of paracetamol, of ascorbic acid, of phenylephrine hydrochloride, of pheniramine maleate, of calcium phosphate, of sodium citrate, of anhydrous citric acid, of malic acid, of curcumin, of lemon-lime flavoring, of titanium dioxide and of powdered sugar.
For the preparation of powder for oral usetechnology the method of roll compaction is proposed. The sequence of input of ingredients by nine algorithms was studied using dispersion analysis. The optimal component input scheme is selected: compacting of the mixture 1: paracetamol + curcumin + titanium dioxide + sugar powder + calcium phosphate + lemon-lime flavoring; mixing with mixture 2: phenylephrine hydrochloride + pheniramine maleate + sugar powder and mixture 3: ascorbic acid + sodium citrate + malic acid + citric acid anhydrous.
GRATITUDE
Grateful to Farnak Joint-Stock Company for providing raw materials and equipment for experimental researches.