I. INTRODUCTION 1
Decades of observations have shown us in the Northeast Australian Region that the convection (thunderstorms) in the inner core of tropical cyclones initially develops in an asymmetric pattern which under the right conditions may form an axisymmetric ring of convection as it reaches peak intensity. Researchers (see below) believe that the axisymmetric model of tropical cyclone structure fails to explain convection initiation in the inner core. The concept on Vortical Hot Towers(VHTs) has been developed to understand how this convection can develop. In this paper the roles of winds turning in an anticyclonically fashion between the 850hPa level up to 500hPa is presented as an explanation of the structure of VHTs.
II. GENERATION OF VORTICAL HOT TOWERS IN THE INNER CORE OF TROPICAL CYCLONES 2
The term Hot Towers has been applied to tall cumulonimbus clouds that are horizontally small with their greatest extent is in the vertical, reaching altitudes as high as . They can efficiently transport heat from the lower troposphere to the stratosphere. When they are thought to form within areas of rotation in rotating updrafts and are known as Vortical Hot Towers(VHTs). The role of hot towers in tropical weather was first formulated by the legendary scientist Joanne Simpson(nee Malkus) in (Riehland Malkus1958).
We have looked at the role of a certain wind structures producing these VHTs. In Section 3 of Callaghan (2021) is a detailed review (including climatology) of how winds turning anticyclonic from the level up to the level are associated with tropical cyclone intensification and extreme rainfall both in the tropics and in higher latitudes. Due to this wind structure, being like Quasi Geostrophic warm air advection (Holton 2004), for brevity we call it Warm Air Advection (WAA). Examples of this wind structure causing extreme rainfall and being associated with tropical cyclone intensification are shown in Tory 2014, Callaghan and Tory 2014, Callaghan and Power 2016 and Callaghan 2017a, 2017b, 2018, 2019a, and 2019. Such WAA has a wind structure that produces streamwise vorticity (Davies-Jones 1985) encouraging rotating updrafts which separate updrafts from the destructive effects of downdrafts. The opposite structure of winds turning cyclonic through this layer can cause convection with rotating updrafts when in an environment of low static stability but mostly this wind structure suppresses convection and here is called cold air advection (CAA).
The common summer wind pattern off the Northeast Australian Coast is a CAA wind structure which contributes to convective suppression. This was illustrated in Figure 2 of Callaghan (2021) which shows the winds turning clockwise (cyclonic) with height over the area on average through January, February, and March. The rainfall associated with this pattern is light rain with the heavy rain further north in the monsoon trough across the Gulf of Carpentaria and Cape York. The author spent the active La Nina 1973/1974 summer on Willis Island Meteorological station in the Coral Sea and with monotonous regularity the radar balloon flight showed low level southeast winds turning clockwise with height through southerly winds up to south-westerly at . During this time only light rainfall was observed. It was only when a vortex developed, or an upper trough system extended up into the tropics (see example Appendix I Callaghan 2021) that a pattern conducive to heavy rainfall was observed. In those cases, because the most common 850 to vertical wind shear was westerly a dipole structure was produced with WAA and ascent in the east and CAA and descent in the west.
In the Queensland Severe Weather Section of the Bureau of Meteorology a diagnostic for heavy rain and TC intensification was developed using , and winds from the European Model. This became possible from the 1990s when computer forecasting models became freely available. This clearly showed us the relationship between WAA and heavy rain and TC intensification. Callaghan and Tory 2014 used data from Holland (1984) to show that intensifying tropical cyclones in the Australian/southwest Pacific region had an asymmetric convective structure associated with WAA when considering the climatological winds at and .
From Callaghan 2017b the most rapid intensification cases had asymmetric inner core convection early in a six- hour period where the Central Pressure dropped . The more intense TCs developed an axisymmetric convective pattern at peak intensity and an example of this is shown with Hurricane Michael (Callaghan 2019a). From this study an important case examined which models could not forecast the RI of was severe tropical cyclone Marcia as recently as February 2015. In this case throughout the RI convection was formed more vigorously on the western flank under the influence of a warm air advection process and this needs to be understood on its influence on the model failures. Below we present two recent forecasting failures involving Super Typhoon Rai.
III. ELIASSEN VORTEX 3
Eliassen (1951) derived an equation for an axisymmetric vortex circulation The Primary circulation refers to the tangential or swirling flow rotating about the central axis, and the secondary circulation refers to the "in-up-and-out circulation" (low and middle level inflow, upper-level outflow).
If the vortex is axisymmetric and in approximate gradient wind and hydrostatic balance, Eliassen derived an equation for the circulation in a vertical plane obtaining a diagnostic expression for mass-flow in the radius-height plane. From Willoughby (1988) the secondary circulation controls the distribution of hydrometeors and radar reflectivity. The ascending motion occurs in numerous individual convective updraft cores. These cover of the area in the vortex core and of the eye wall. The vertical velocities in the strongest of the updraft cores averages .
Smith and Montgomery (2008) found from these axisymmetric models that in an intensifying tropical cyclone (TC) the azimuthally averaged field has negative unbalanced buoyancy, which they defined here as buoyancy relative to the reference density of the balanced state. Therefore, they concluded it could not support an intensifying circulation by itself. As a result, they decided that this circulation must be driven by VHTs. Nguyen et al. (2008) examined tropical-cyclone intensification and predictability in the context of an idealized three-dimensional numerical model and in the prototype amplification problem starting with a weak axisymmetric tropical storm-strength vortex, they showed that the emergent flow becomes highly asymmetric and is dominated by deep convective vortex structures, even though the problem as posed is axisymmetric. They also referred to these structures as VHTs.
The above studies concluded that there was a fundamental difference between the axisymmetric paradigm for tropical-cyclone intensification and the asymmetric paradigm, in which the VHTs are key elements of the evolution. Indeed, they found that these VHTs are the only coherent structures that have positive local buoyancy. As a result, it was concluded that this circulation must be driven by the local buoyancy in the VHTs. Hence WAA plays a crucial role in the intensification of TCs via its development of VHTs.
IV. DATA 4
- Much of the data comes from The Bureau of Meteorology website bom.gov.au however the following web sites were used to obtain data after the event: -
- Archived synoptic weather observations from www.meteomanz.com/?l=1;
- Archived upper wind observations from the University of Wyoming web site: - at weather.uwyo.edu/upperair/sounding.html.
- Ocean Heat Content (OHC) data was obtained from RAMMB: TC Real-Time: Currently Active Tropical Cyclones (colostate.edu).
- The NOAA HYSPLIT model for air parcel trajectory analyses using he Global Data Assimilation System (GDAS) 0.5degree global model September 2007 to June 2019 at the following site: - https://www.ready.noaa.gov/HYSPLIT.php
- Numerical Model upper wind analyses were obtained from the Weathernerds web site at: - Weathernerds
These provided the source of the events which had the wind structure to generate inner core convection on Tropical Cyclones (TCs). This wind structure (winds turning anticyclonic from 850hPa through 700hPa to 500hPa) could be assessed by a series of 850hPa, 700hPa and 500hPa wind charts and then highlighting the 700hPa wind charts which fell into this category. An easier way was to overlay the 850hPa winds on the 500hPa winds. The advantage of this latter chart was it was much easier to determine whether the wind backed or veered. However, it slightly exaggerated the anticyclonic turning area of winds from 850hPa to 500hPa as in a few cases there was no anticyclonic turning between the 700hPa up to the 500hPa levels. We present both methods here but mostly used the charts showing the 850hPa to 500hPa shear.
V. EXAMPLES OF TROPICAL CYCLONES WITH WAA IN THE INNER CORE 5
a) Severe tropical cyclone Batsirai 5.1
Batsirai is the first of a series of recent tropical cyclones making landfall with very destructive winds. It is shown in these examples how the WAA in the inner core was associated with ascent enabling convection to develop there. Hysplit trajectory analysis are employed to validate the ascent observed WAA. The trajectories are those taken by air parcels whereas some of these parcels will be involved in the development of convection and will circulate around the centre of the cyclone.
TC Batsirai struck Madagascar on 5 February 2022. According to the Madagascar National Disaster Management Agency this resulted in 121 fatalities with 19,000 homes being destroyed (8,364), flooded (7,098) or damaged (3,236). The main wind damage and thirty-four fatalities caused by Batsirai was concentrated around the coastal town of Mananjary while eighty-seven people died following landslides in the mountainous district of lkongo to its south-southwest.
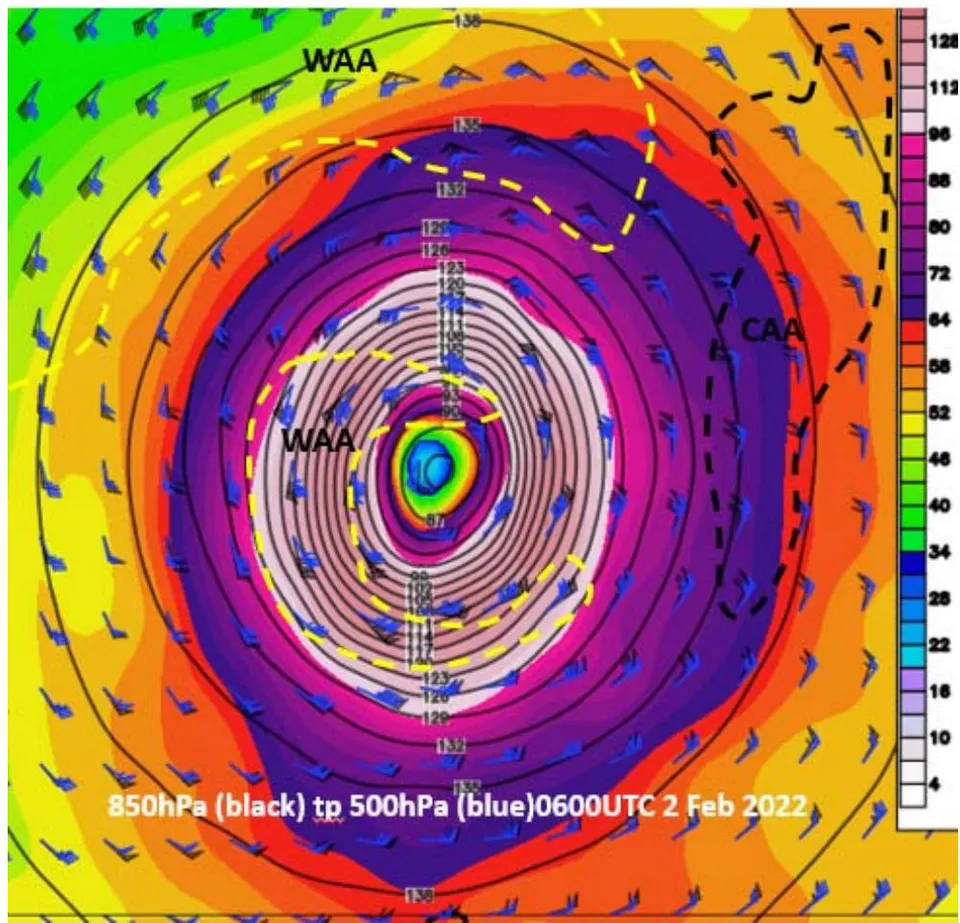
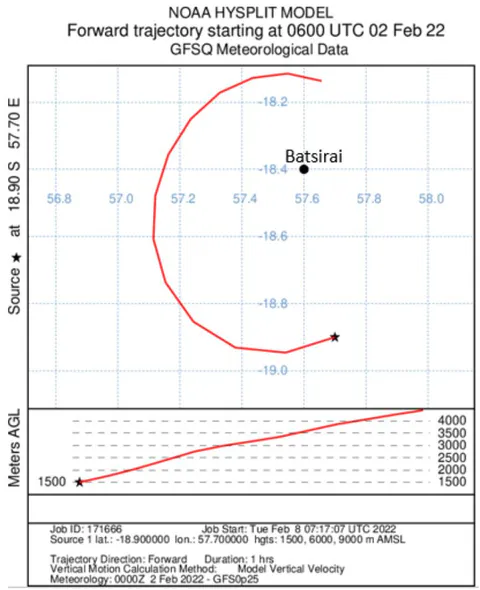
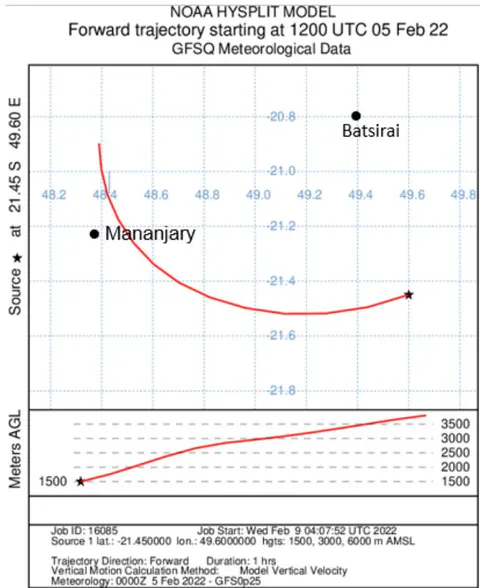
By examining Figure 1 (left frame) it can be seen, that at 0600UTC 2 February 2022 WAA (from 850hPa winds turning anticyclonic up to 500hPa) in the inner core of Batsirai was associated with ascent from the Hysplit trajectory analysis (Figure 2). This ascent existed from the 1500metre elevation up to 4500metres elevation in one hour or just under vertical velocity. The trajectories (not shown) reached the outflow layers (above 200hPa) after 5 hours. Trajectory from 500m elevation rose to just over 3000m elevation in one hour so the whole low-level layer was lifted. Trajectories (not shown) starting at 1500km east northeast of the centre at this time show little ascent from 1500km elevation as would be expected from the lack of WAA advection in that segment. In time the trajectories would differ from the movement of individual convective cells which develop in the rising motion provided by the WAA. For instance, after 4 hours the air parcels were moving in easterly winds in the outflow layer at 200hPa.
From Black et al 1996, studying seven Atlantic Hurricanes using Doppler radar data, more than of the vertical velocities range from to . The broadest distribution of vertical motion is in the eye wall region where around of the vertical motions are m s . Averaged over the entire dataset, the mean vertical velocity was upward at all altitudes. Mean downward motion occurred only in the lower troposphere of the stratiform region.
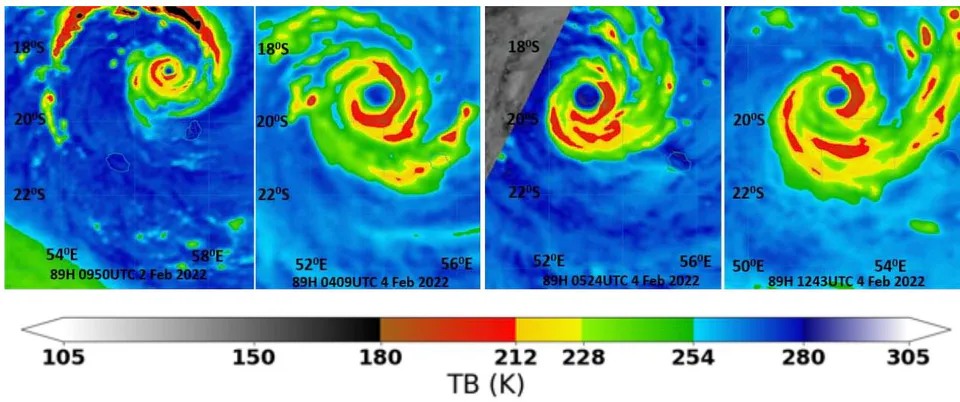
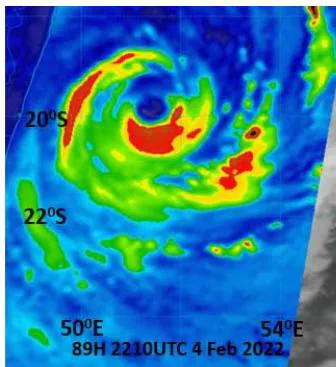
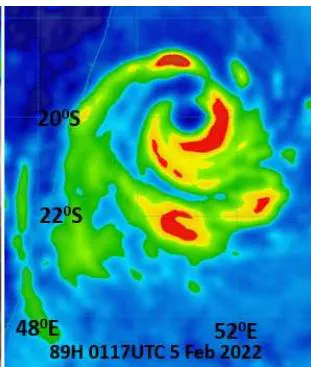
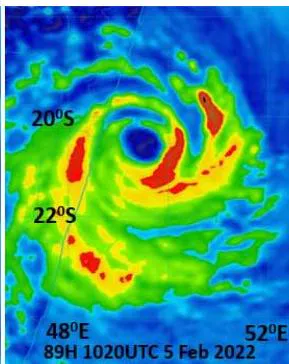
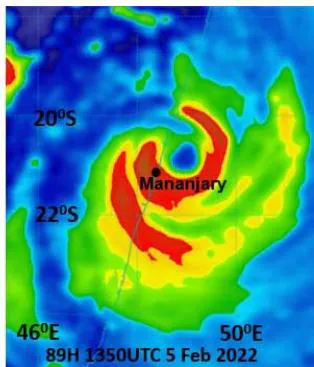
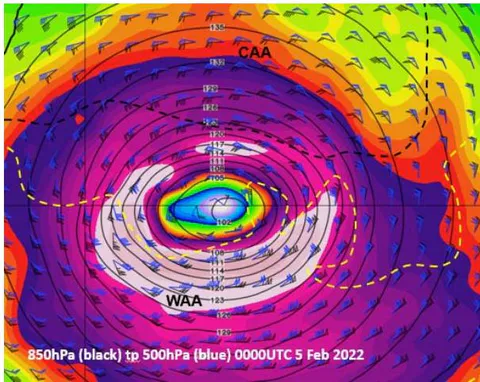
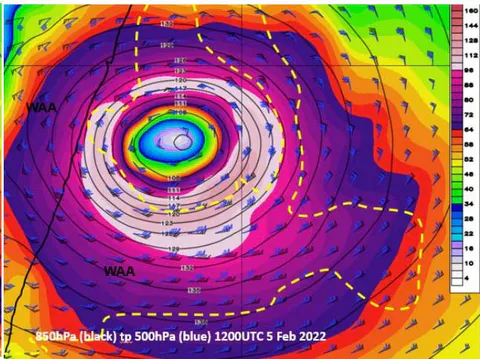
The top left microwave image in Figure 3 at 0950UTC 2 February was when from Dvorak analysis near peak intensity with a small compact eye and by the next image at 0409UTC 4 February it had a much larger eye having just gone through an eye wall replacement cycle. By 1243UTC 4 February 2022 (top right frame Figure 3) the eye has slowly reduced in size as the eye wall contracts to complete the cycle. From the first three lower frames in Figure 3 convection weakens in the northern sector near the eye of Batsirai as CAA take hold there (see left frame in Figure 4 where a large area of CAA had developed north of the centre by 0000UTC 5 February 2022. By 1350UTC 5 February 2022 bands of strong convection (red areas) wrapped around the centre onto the coast over Mananjary and south of southwest of the town. The eye had contracted by then indicating intensification at landfall. Coincident with this intensification WAA at 1200UTC 5 February 2022 (right frame Figure 4) dominated the circulation with little CAA present.
Hysplit trajectory analysis at this time (Figure 5) shows ascent from elevation up to just under elevation near Mananjary. Observations (winds read from an anemometer) were available from Mananjary around this time at: -
- 1200UTC 5 February Average wind from the south at 70knots mean sea level (msl) pressure 987.0hPa 54mm of rain past 6hours.
1500UTC 5 February Average wind from the south at 90knots msl pressure 976.9hPa 81mm of rain past 6hours.
Sea surface temperatures (SSTs) were around leading up to landfall while the Ocean Heat Content (OHC) was around 15-35 kJ/cm 2 (where greater than 50 kJ/cm 2 have been shown to promote greater rates of intensity change).OHC data was obtained from RAMMB: TC Real-Time: Currently Active Tropical Cyclones (colostate.edu).
The worst of the wind damage and loss of life from the wind occurred in the Mananjary area while the second rain band further south is associated with the large loss of life from landslides in the mountainous district of Ikongo.
b) Severe tropical cyclone Seroja 5.2
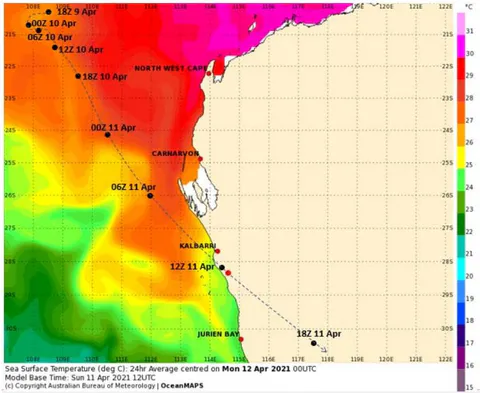
Seroja despite making landfall on the subtropical coast it remained a very destructive storm as it crossed the coast. It followed a tongue of warmer water onto the coast (Figure 6) with Ocean Heat Content (OHC) of .
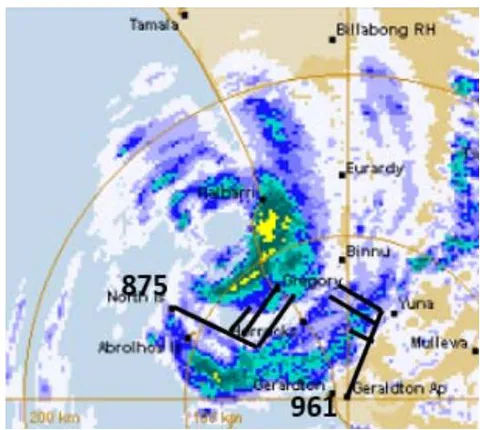
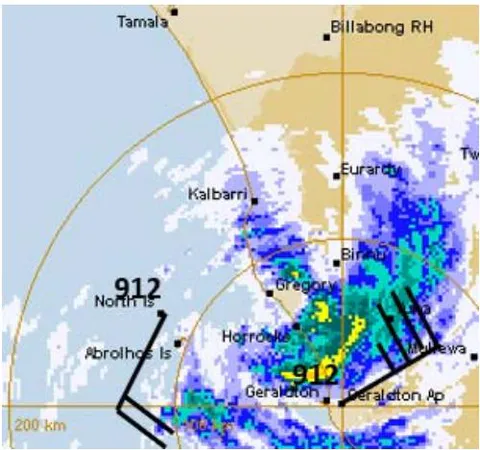
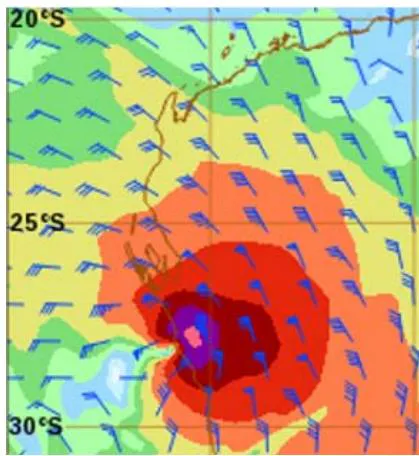
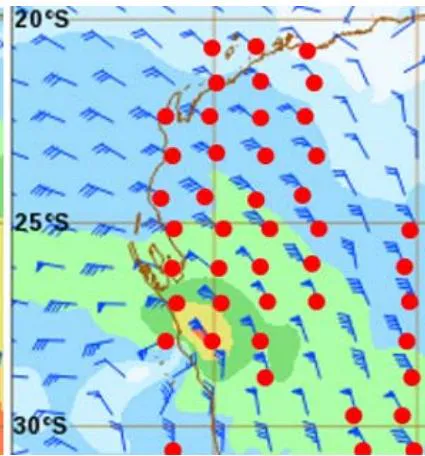
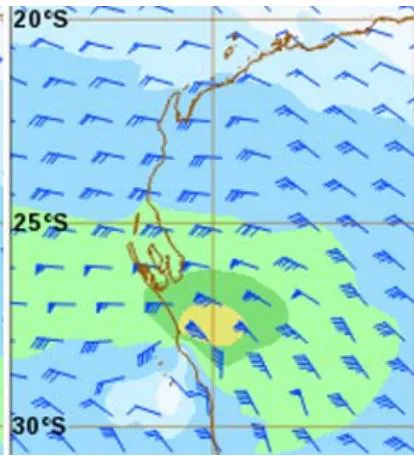
The radarimages of Seroja at landfall show Kalbarri under the eyewall in Figure 7 (left frame) while town of Northampton lay under the eyewall north of Geraldton in the right frame of Figure 7. In Figure 8 are the 850hPa, 700hPa and 500hPa wind analyses with red circles highlighting where winds turned anticyclonic from the 850hPa level through 700hPa up to 500hPa that is WAA for 1200UTC 11 April 2021.
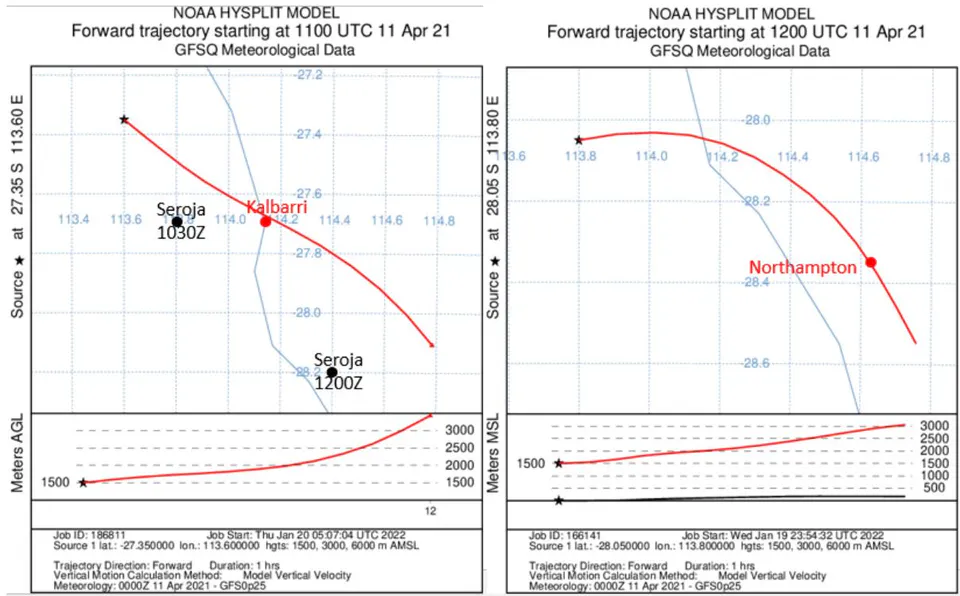
Impacts at Kalbarri and Northampton were severe with around of buildings sustaining severe damage, mostly consisting of lost roofs but with many structures destroyed. Many locations recorded maximum wind gusts more than with the highest being from Meanarra Tower near Kalbarri. Trajectories of air parcels from WAA near Seroja (Figure 9) show areas of strong ascent over both Kalbarri and Northampton.
c) Severe Tropical Cyclone Harold 5.3
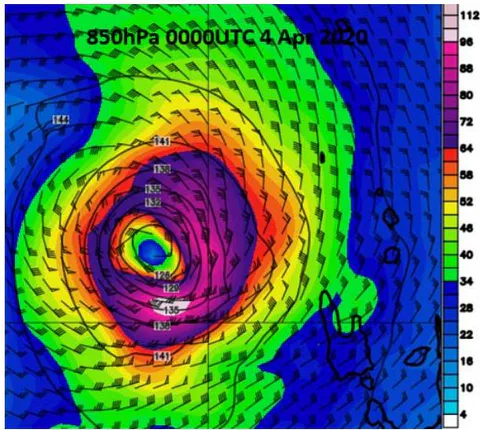
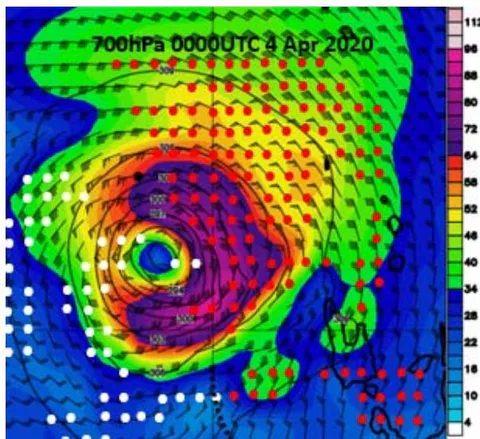
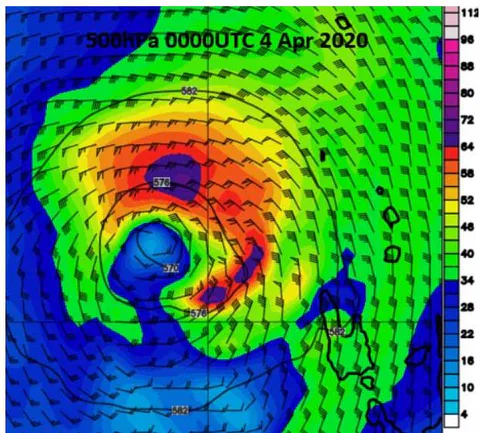
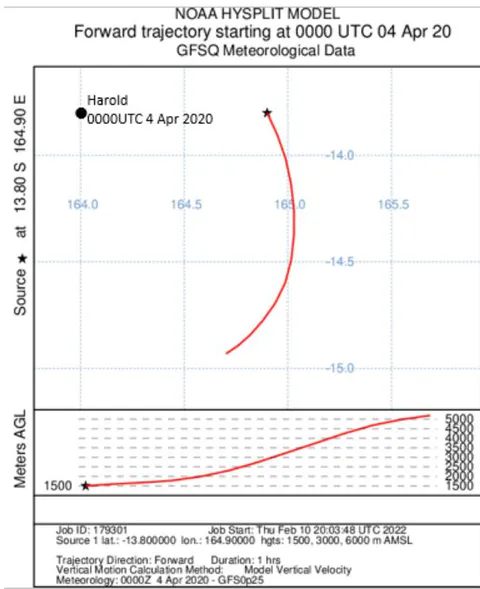
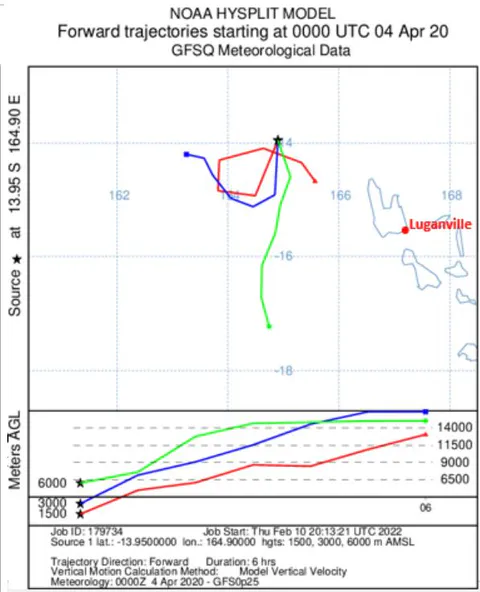
Harold at 0000UTC 4 April 2020 with the circulation dominated by strong WAA over much of its western inner core and beyond(Figure 10). By 1200UTC damage was experienced around Lugarville and Pentecost Island. The trajectories resulting from this strong WAA are shown in Figure 11. The trajectories after 1hour (left frame) show air parcels at elevation lifted to with parcels lifted even after 6hours up to and above. With different starting elevations and therefore different wind directions (due to the anticyclonic turning of the wind) the trajectories showed a strong upper outflow pattern.
As it moved towards Lugarville it passed over waters with strong Ocean Heat Content (OHC) of 50- .
d) Super Typhoon Rai 5.4
Typhoon Rai caused severe and widespread damage throughout the Southern Philippines, killing at least 409. Rai unexpectedly underwent rapid intensification on December 15. The Joint Typhoon Warning Centre (JTWC) forecast from 1200UTC 15 Dec 2021 had 75 knot peak average winds for Rai as it approached the northern tip of Mindanao in the Philippines at 1200UTC 16 Dec. Their analysis at 1200UTC 16 Dec had peak winds of 130 knots as Rai was about to make landfall (see JTWC forecasts at NRL Monterey). On December 16, the typhoon made landfall over Surigao Island in the province of Surigao del Norte 1:30 PM local time (05:30UTC).
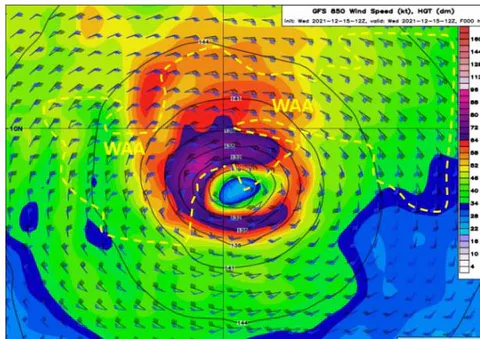
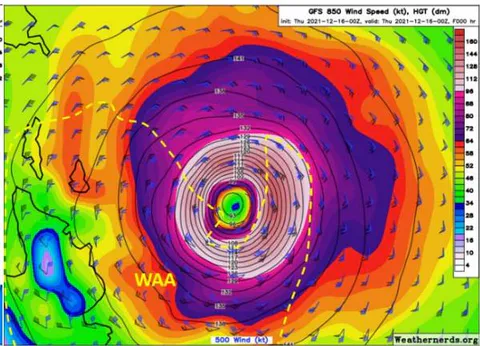
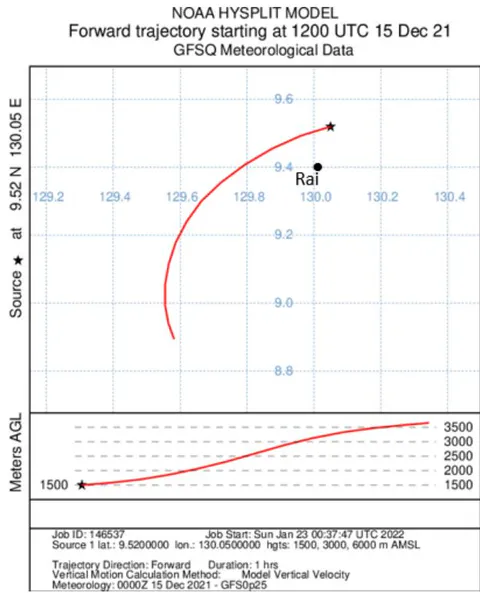
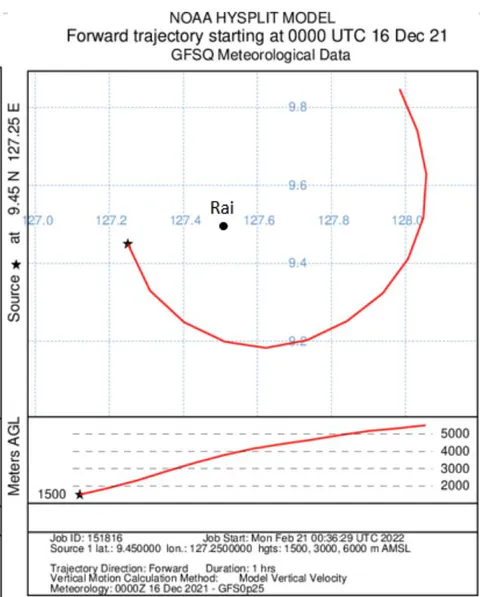
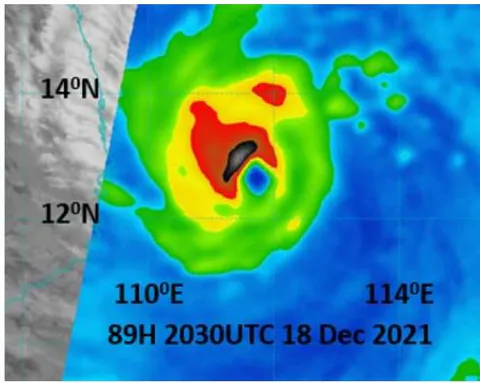
From Figure 12 WAA at 1200UTC 15 December 2021 was located mostly north and west in the inner core of Rai. From Figure 13 this caused ascent to just over from the level in one hour. By 0000UTC 16 December the WAA extended right around the southern semicircle of the inner core of Rai (Figure 12) with Hysplit (Figure 13) showing ascent up to in one hour around to the northeast of the centre as convection becomes strong in the northeast quadrant (red to black area in Figure 14) and therefore wraps around the eye (Figure 14) to completely enclose it.
As Rai moved towards Surigao Island it passed over waters with strong OHC of
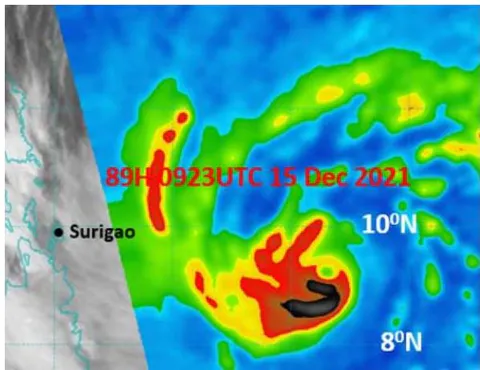
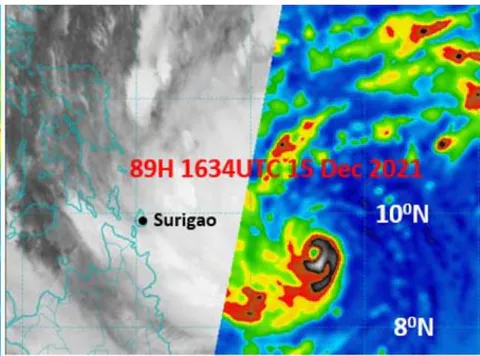
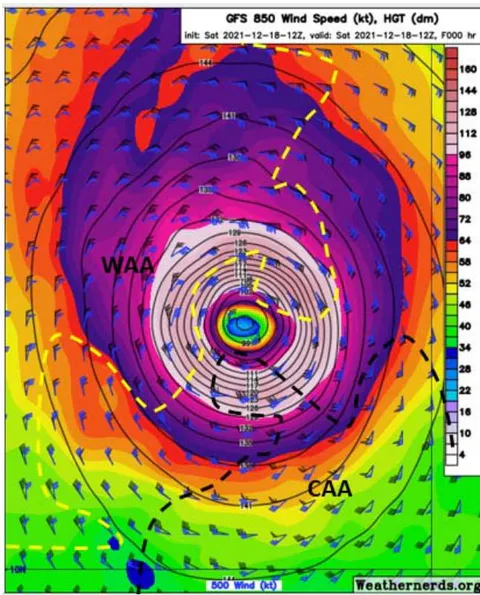
Rai crossed over the Philippine Archipelago weakening as it did so and with the expectation from computer models and the JTWC it would move into the South China Sea and moved northwards as a much weaker system. However, it underwent rapid intensification in the South China. At 1800UTC 18 December it was analysed by the JTWC to have a peak sustained winds of 145knots whereas earlier at 1200UTC 17 Dec it was forecast by JTWC to have a peak wind speed of 95knots in this area.
From Wikipedia Rai wreaked havoc across Vietnamese-held isles in the Spratly Islands. An observation tower in Southwest Cay recorded sustained winds up to (110 mph) and a gust of
(120 mph) during the afternoon of December 18 before being knocked down. The storm destroyed five hundred square meters (5,400 sq ft) of civilian house tiles, twenty-seven solar batteries, four hundred square meters of farmland, and knocked down of the trees on the island; no casualties were reported there. As it passed seawards of Vietnam Rai began to batter the Central Vietnamese coast, with severe winds and rainfall up to 300mm. On December 19, one person (fisherman) was reported dead in Tuy Phong, five ships were capsized, and three others were damaged off the coast.
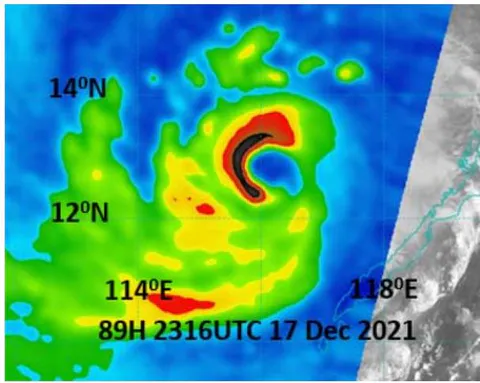
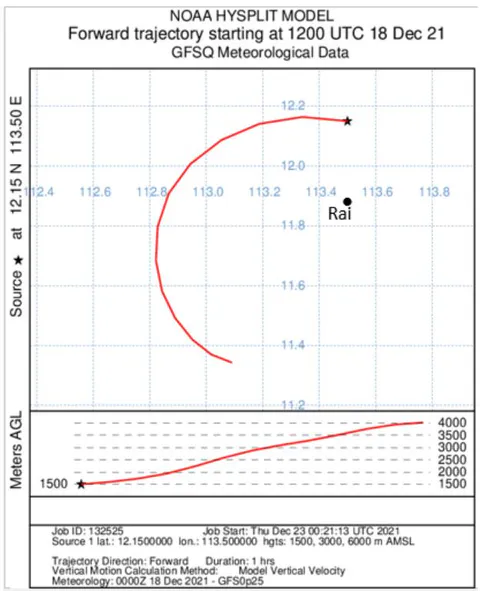
Over this period microwave images (Figure 15) show the intensification of Rai where an elongated eye at 2316UTC 17 December 2021 (left frame) contracts into a circular compact eye by 2030UTC 18 December 2021 (right frame). At 1200UTC 18 December 2021 (halfway between these two images) GOES analyses (Figure 16) shows a large area of WAA occupying the northwest inner core semicircle of Rai while a smaller area of CAA was located around the southeast semicircle. Hysplit trajectories (Figure 17) show strong
ascent in the WAA area from 1500m elevation up to 4000m in one hour.
As Rai moved out into the South China Sea it passed over waters in the first 12 hours with small Ocean Heat Content (OHC) of and then over waters with negligible OHC.

e) Michael 5.5
Reconnaissance aircraft measured a central pressure of 955hPa in Hurricane Michael at 2307UTC 9 October 2018 while it was moving north towards the Florida Panhandle. By 1309 10 October 2018 the aircraft calculated it had deepened to 934hPa and then it made landfall east of the Tyndall Airforce Base which recorded a mean sea level pressure of 922.4hPa at 1720UTC 10 October 2018 and measured a gust of (Bevan et al 2019). Mexico beach area, southeast of Tyndall felt the full force of Michael and suffered the greatest loss of the thirty-nine lives so far accounted for as having been lost in the United States. Mexico Beach is a small town (population of only 1,072 in the 2010 census).
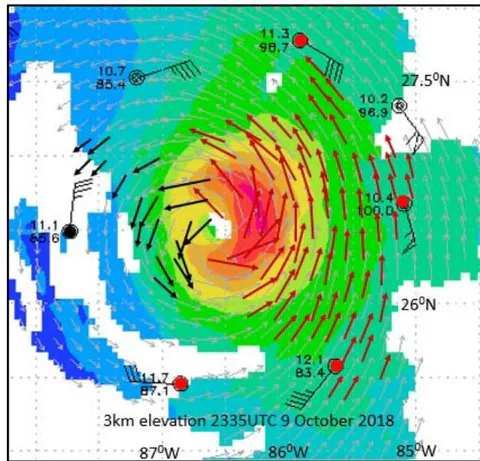
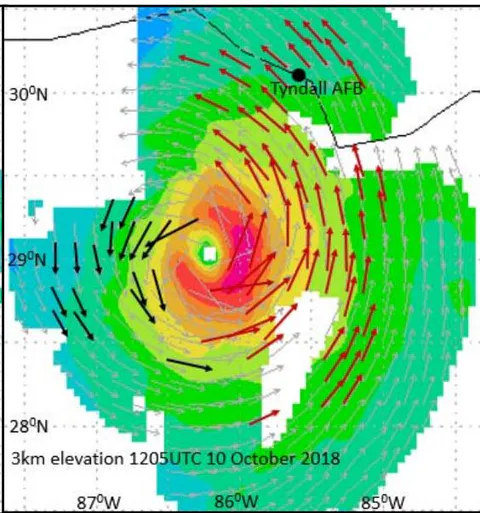
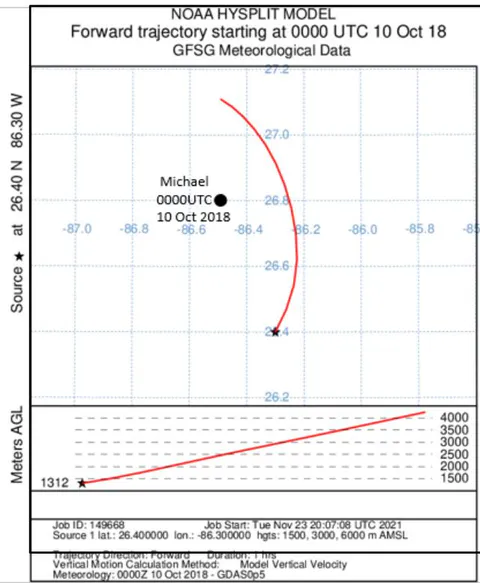
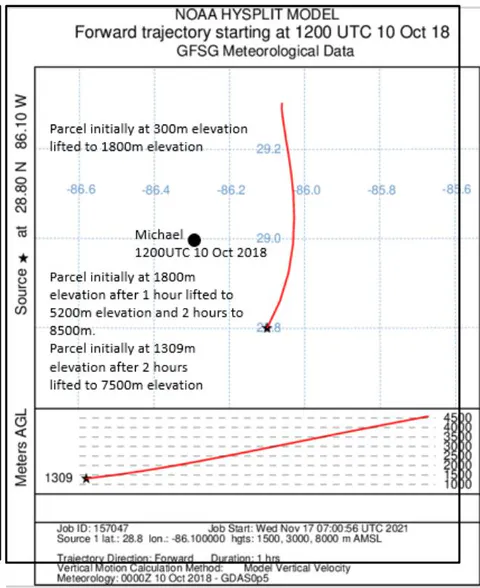
Michael developed extensive WAA areas at 2355UTC 9 Oct 2018 and 1205UTC 10 October 2018 Figure18. These are taken from Callaghan 2019a where the winds are analysed between and to determine the turning winds. Hysplit trajectories for both cases show strong ascent with the circulation rising from an elevation of around up to well above . Though not shown in both cases over longer periods (9 and 6 hours) the trajectories from three levels rise well above into the outflow area of Michael. As Michael approached the coast it moved through water with OHC of
f) Dorian 5.6
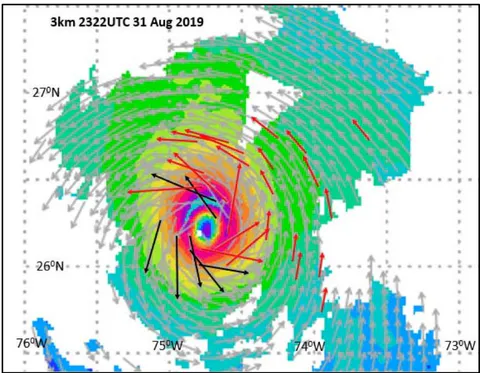
A WAA region about the inner core of Hurricane Dorian at 2322UTC 31 August 2019 is displayed in Figure 20. At the time Dorian was moving west towards the Bahamas with a central pressure of 939hPa and peak winds of 135knots. Twelve hours later it had a central pressure of 927hPa and peak winds of 155knots (1minute average winds) (Avilla et al 2020).
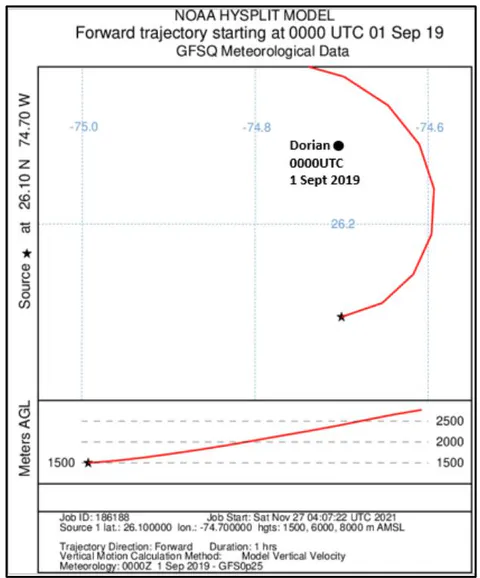
WAA areas at 2322UTC 31 August 2019 were less extensive than with Michael and in the first hour Hysplit trajectories (Figure 21) show weaker ascent with the circulation rising from an elevation of around up to about . After 12hours the trajectories from the three levels rose above 12kmelevation into the outflow area of Dorian which is not shown. As Dorian approached the Bahamas it moved through waters with OHC of . Comparing this with Michael the weaker ascent supplied by the WAA was compensated by the much stronger OHC.
g) Laura 5.7
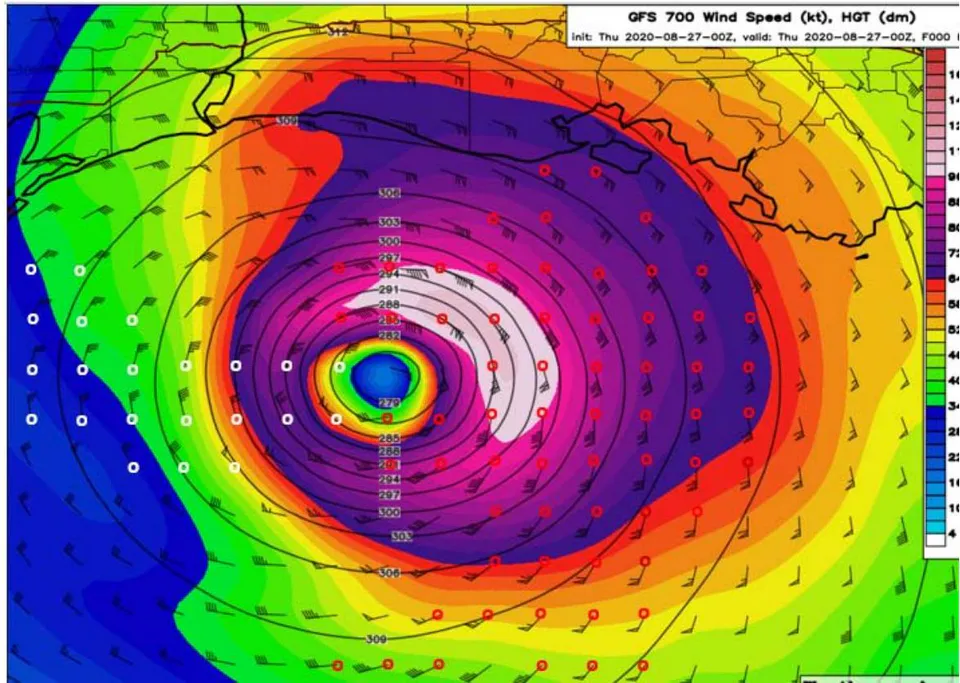
In Figure 22 strong WAA is evident in the inner core of Hurricane Laura at 0000UTC 27 August 2020 approaching landfall when the peak wind speed was 130knots having increased from 100knots over the previous 12 hours. The strength of the hurricane levelled off for a few hours before landfall, and the well-defined eye of this devastating category four hurricane crossed the coast near Cameron, Louisiana, around 0600 UTC 27 August (Pasch 2021). Laura was the strongest hurricane to strike Louisiana since Hurricane Camille of 1969 (which produced category five conditions over the southeastern part of the state).
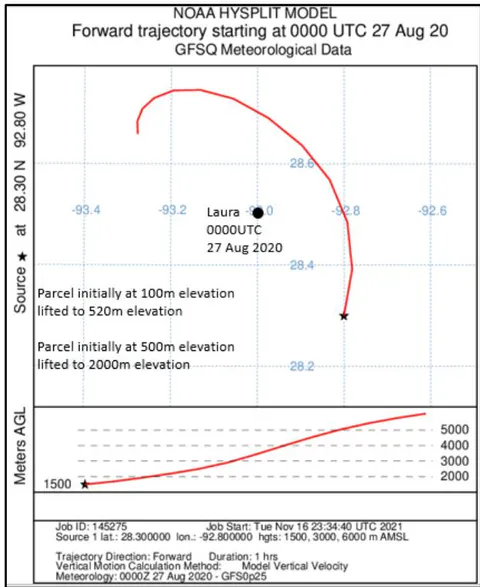
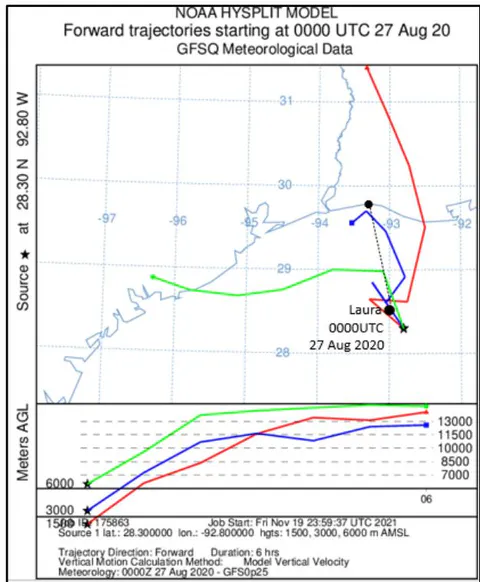
Hysplit trajectories from this strong WAA area rose from 1500m elevation up to above 6000m (Figure 23). After 6hours the trajectories from the three levels rose above 12km elevation into the outflow area of Laura. As Laura approached landfall it passed over waters with OHC 35-50 kJ/cm^2 with small area 15-35 near the coast.
h) Hurricane Ida 5.8
The National Hurricane Centre (NHC) reported at 1755UTC 29 August 2021 that Hurricane Ida made landfall as an extremely dangerous category four hurricane near Port Fourchon Louisiana with maximum sustained winds of 130knots (242km/h) and a minimum central pressure of 930hPa. NHC assessed it reached this intensity at 1200UTC 29 August 2021 having intensified from 100knots at 0600UTC 29 August and 89knots at 0000UTC 29 August 2021. Reconnaissance Aircraft Observations over this period are shown in Table 2.
| Time Date | Central Pressure | Flight level winds |
| 0035UTC 29 August 2021 | 967hPa | 700hPa level 91knots |
| 0613UTC 29 August 2021 | 950hPa | 700hPa level 133knots |
| 1018UTC 29 August 2021 | 936hPa | 700hPa level 145knots |
| 1047UTC 29 August 2021 | 936hPa | 700hPa level 146knots |
| 1156UTC 29 August 2021 | 932hPa | 700hPa level 138knots |
| 1224UTC 29 August 2021 | 932hPa | 700hPa level 138knots |
| 1410UTC 29 August 2021 | 933hPa | 700hPa level 136knots |
| 1602UTC 29 August 2021 | 931hPa | 700hPa level 127knots |
| 1650UTC 29 August 2021 | 932hPa | 700hPa level 127knots |
Throughout its path of destruction in Louisiana, more than a million people in total had no electrical power. Widespread heavy infrastructural damage occurred throughout the southeastern portion of the state, as well as extremely heavy flooding in coastal areas. There was also substantial plant destruction in the state. As of September 15, the following deaths were confirmed in relation to Ida in the United States with thirty-three deaths in Louisiana, thirty in New Jersey, eighteen in New York, five in Pennsylvania, three in
Mississippi, two in Alabama, two in Maryland, one in Virginia, and one in Connecticut.
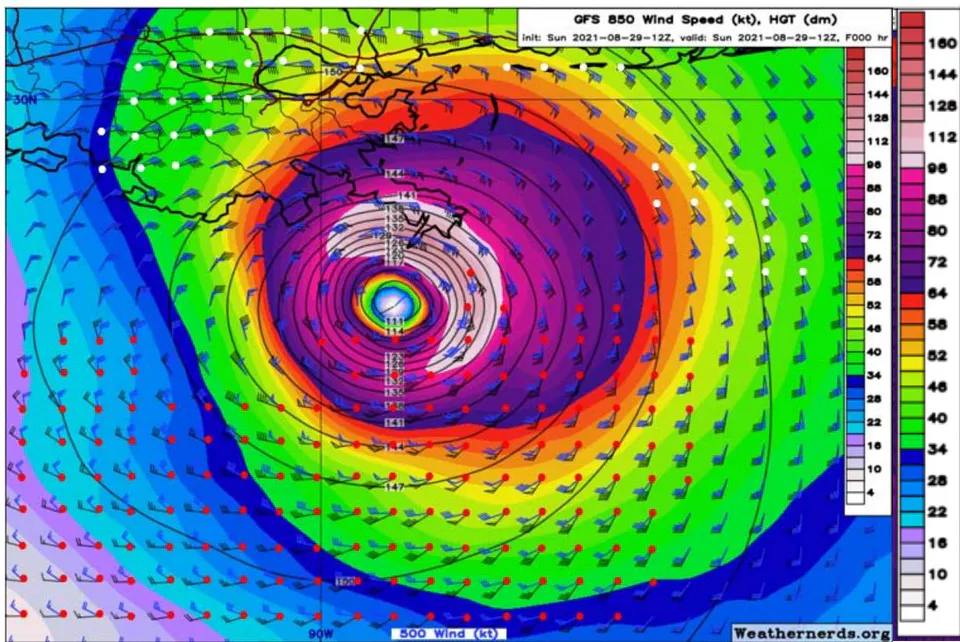
GFS WAA winds in the inner core of Ida (Figure 24) turning anticyclonically from 850hPa to 500hPa in the southern eye wall of Ida at 12Z 29 August approaching landfall.
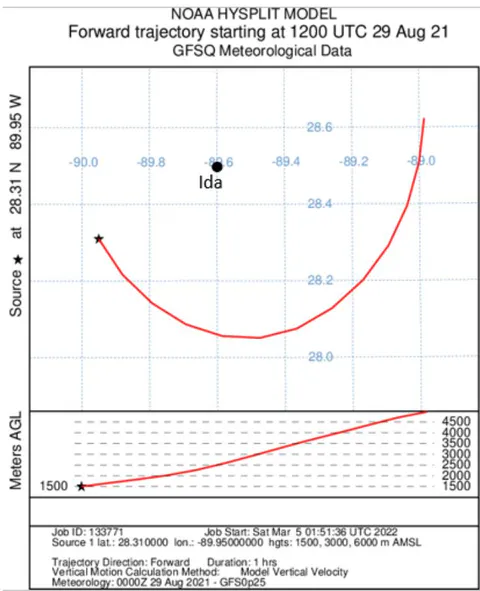
In Figure 25 the Hysplit trajectories show the WAA forcing strong ascent from 1500metres over one hour up to around 5000m elevation.
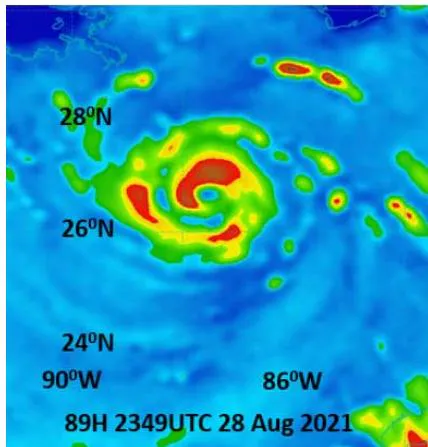
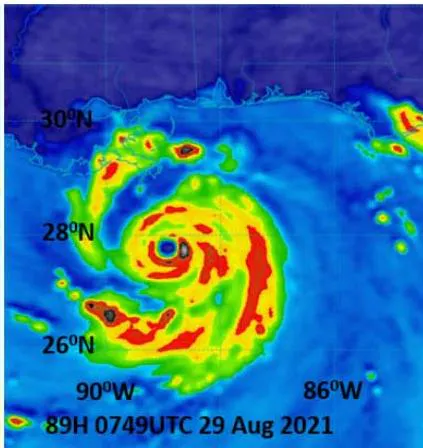
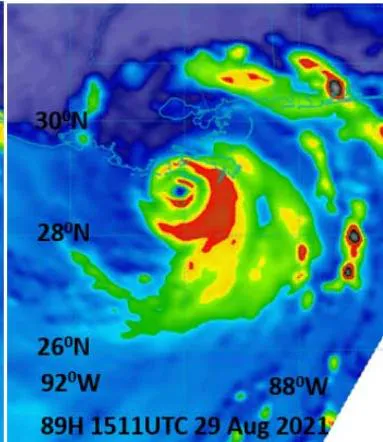
Microwave imagery(Figure 26) shows a decrease in eye size from 2349UTC 28 August 2021 to form a small compact just before landfall at 1511UTC 29 August 2021. The effect of the strong WAA convection on the southern side at 1200UTC 29 August 2021 can be seen from the red areas developing there. As Ida approached landfall it passed over waters with OHC 35- with small area 15-35 near the coast. This was like Laura as was the strong ascent generated by the WAA convection in the inner core in both cases.
ACKNOWLEDGEMENT 6
Permission from Matt Onderlinde to use Computer weather charts from the Weathernerds site is greatly appreciated.
VI. CONCLUSION 7
Recent very destructive tropical cyclones approaching landfall around the Globe have been examined. Sectors of the inner core of these cyclones were surveyed to identify pronounced regions of low to mid-level WAA. These regions were then analysed for evidence of ascent using Hysplit trajectory analysis. The results showed that regions of WAA produced ascent in the core where convection developed verified by microwave data. Little ascent was evident in other areas away from the WAA.
Two identical hurricanes which devastated the same part of Louisiana were compared. Both Hurricanes approached landfall over oceans with similar OHTs. The WAA with Laura produced strong ascent reaching 6000m after one hour while with Ida the ascent was strong but a little less reaching 5000m elevation. However, the whole structure of Ida had less CAA in the inner core circulation making the potential for intensification up to landfall similar.
All cyclones examined had WAA producing moderate to strong ascent in the inner cores and four which had strong ascent from WAA were Super Typhoon Rai, Severe tropical cyclone Batsirai, Hurricane Michael and severe tropical cyclone Harold. Comparing two US Category Five Hurricanes, Michael and Dorian, Michael had much stronger inner core WAA and ascent however Dorian passed over waters with much stronger OHC.