1. Introduction
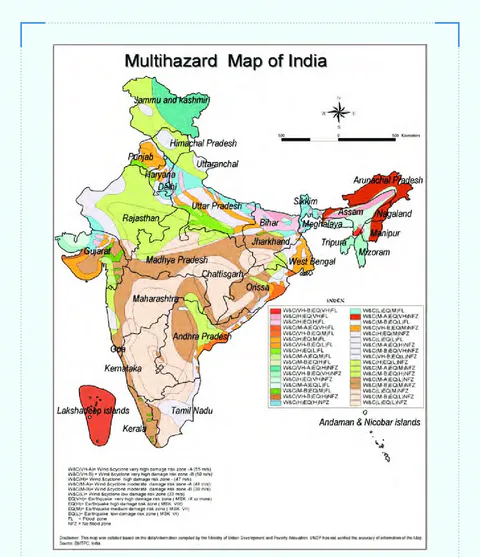
The research on catastrophe resilience in India’s mountainous regions is presented in this paper. We start by presenting the overall picture of India, displaying its multi-hazard map, and reviewing the categorization of disasters. Next, we address the susceptibility and vulnerability of mountainous regions to calamities. We then describe India’s disaster management policies, framework, and institutional mechanism. Two case studies of catastrophes in mountainous regions are then presented, based on two questionnaire-based surveys. By doing this, we provide light on the chosen process. The outcomes, their implications, and the overall resilience capability follow suit. Lastly, we provide recommendations for disaster management in the mountainous regions.
We show below the general profile of India covering dimensions such as area, location, borders, major rivers, forest, coastline, desert, population, states, union territories, sex ratio, population density, annual exponential population growth rate, population share, and climate (see Table 1).
Table 1. India: General Profile
| No. | Feature | Description |
|---|---|---|
| 1 | Area | 3.3 million sq. km |
| 2 | Location | Situated in southern Asia, the Indian peninsula is separated from mainland Asia by the Himalayas; lying entirely in the northern hemisphere, India lies between latitudes 8° 4’ North and 37° 6’ North; longitudes 68° 7’ East and 97° 25’ East |
| 3 | Borders / Neighboring Countries | North: China, Bhutan, and Nepal; Himalayan Mountain ranges. Northwest: Afghanistan and Pakistan. South: Sri Lanka and Maldives; Indian Ocean, Palk Strait and the Gulf of Mannar. East: Myanmar and Bangladesh; Bay of Bengal. West: Arabian Sea |
| 4 | Major Rivers | Twelve with a total catchment area of 252.8 million hectares |
| 5 | Forest | 692,027 sq. km (21.5 percent of the total geographical area) |
| 6 | Coastline | 7,517 km encompassing the mainland, Lakshadweep Islands, and the Andaman and Nicobar Islands |
| 7 | Desert | 442,289 sq. km |
| 8 | Population | 1.2 billion (Census 2011) |
| 9 | States | 29 |
| 10 | Union Territories | 7 |
| 11 | Sex Ratio | 940 females per 1,000 males (Census 2011) |
| 12 | Population Density | 382 persons per sq. km (Census 2011) |
| 13 | Annual Exponential Population Growth Rate | 1.64 percent in 2001–2011 (Census 2011) |
| 14 | Population Share | Rural: 69%; Urban: 31% (Census 2011) |
| 15 | Climate | Tropical monsoon; tropical climate marked by relatively high summer temperatures and dry winters. Main seasons: a) Winter (December–February), b) Summer (March–June), c) South-West monsoon (June–September), and d) Post monsoon (October–November) |
Source: https://nidm.gov.in/easindia2014/err/pdf/country_profile/India.pdf
1.1. Multi-Hazard Map
Multi-hazard map of India includes key hazards such as earthquakes, landslides, floods, cyclones, droughts, and avalanches. Based on these variables, we show below the multi-hazard map of India (see Figure 1). The map shows the various zones impacted by hazards and their severity as given below:
Wind and cyclone very high damage risk zone-A
Wind and cyclone very high damage risk zone-B
Wind and cyclone high damage risk zone
Wind and cyclone moderate damage risk zone-A
Wind and cyclone moderate damage risk zone-B
Wind and cyclone low damage risk zone
Earthquake very high damage risk zone
Earthquake high damage risk zone
Earthquake medium damage risk zone
Earthquake low damage risk zone
Flood zone
No flood zone
1.2. Disaster Categorization in India
We show below the broad types of disasters that occur in India and also disasters specific to the mountainous region (see Table 2).
Table 2. Disaster Categorization in India
| Broad Type of Disaster | Disasters Specific to Mountainous Region |
|---|---|
| Water and Climate related Disasters | Floods and Drainage Management |
| Cyclones | |
| Hailstorm | |
| Cloud burst | |
| Geological related Disasters | Landslides and mudflows |
| Earthquakes | |
| Dam failures / dam bursts | |
| Chemical, Industrial and Nuclear related Disasters | Chemical and Industrial Disasters |
| Accident related Disasters | Forest Fires |
| Urban Fires | |
| Mine Flooding | |
| Major Building Collapse | |
| Boat Capsizing | |
| Biological related Disasters | Biological Disasters and Epidemics |
| Pest Attacks |
Source: Ministry of Home Affairs, Government of India and UNDP, Disaster Management in India—A Status Report, 2017.
Disaster resilience in the mountainous regions of India is a critical issue due to the unique challenges posed by the geography and climate of these areas. Key points and strategies relevant to enhancing disaster resilience in these regions include:
1.2.1. Earthquakes:
The Himalayan region is highly seismic due to the collision of the Indian and Eurasian tectonic plates.
Frequent earthquakes cause significant damage to infrastructure and pose risks to human lives.
1.2.2. Landslides:
Steep slopes and heavy monsoon rains contribute to frequent landslides.
Deforestation and unplanned construction exacerbate the risk.
1.2.3. Floods:
Glacial melting and heavy rainfall can lead to flash floods and river floods.
The rapid flow of water from the mountains can cause downstream flooding, affecting both mountainous and plain areas.
1.2.4. Climate Change:
Increasing temperatures are causing glacial retreat and altering precipitation patterns.
This impacts water resources, and agriculture, and increases the frequency of extreme weather events.
1.3. Vulnerability
India has been vulnerable, in varying degrees, to a large number of natural, as well as, human-made disasters on account of its unique geo-climatic and socioeconomic conditions. It is highly vulnerable to floods, droughts, cyclones, earthquakes, landslides, avalanches, and forest fires. Out of 36 states and union territories in the country, 27 of them are disaster-prone. Almost 58.6 percent of the landmass is prone to earthquakes of moderate to very high intensity; over 40 million hectares (12 percent of land) are prone to floods and river erosion; of the 7,516 km long coastline, close to 5,700 km is prone to cyclones and tsunamis; 68 percent of the cultivable area is vulnerable to drought and hilly areas are at risk from landslides and avalanches. Each time a disaster hits the country, it results in huge losses both in terms of human losses and economic impact. According to a World Bank study on National Disasters conducted in 2010, India faces losses of up to 2 percent of its GDP due to natural disasters. These disasters immensely impact the poor and vulnerable sections of society. India lost approximately $79.5 billion USD to natural disasters in 20 years (United Nations, Economic Losses, Poverty and Disasters 1998–2017, United Nations Office for Disaster Risk Reduction, Geneva, 2018).
Table 3. India’s Deadliest Disasters (1993–2023)
| Sl. No. | Name of Event | Year | State and Area |
|---|---|---|---|
| 1 | Latur Earthquake | 1993 | Latur, Marathwada region of Maharashtra |
| 2 | Odisha Super Cyclone | 1999 | Odisha |
| 3 | Gujarat Earthquake | 2001 | Bhuj, Bhachau, Anjar, Ahmedabad, and Surat in Gujarat |
| 4 | Tsunami | 2004 | Coastline of Tamil Nadu, Kerala, Andhra Pradesh, Puducherry, Andaman and Nicobar Islands |
| 5 | Maharashtra Floods | 2005 | Maharashtra |
| 6 | Kashmir Earthquake | 2005 | Kashmir |
| 7 | Kosi Floods | 2008 | North Bihar |
| 8 | Cyclone Nisha | 2008 | Tamil Nadu |
| 9 | Cyclone | 2012 | Tamil Nadu |
| 10 | Uttarakhand Flash Floods | 2013 | Uttarakhand |
| 11 | Kashmir Floods Disaster | 2014 | Kashmir |
| 12 | COVID-19 | 2020 | All over India |
| 13 | COVID-19 | 2021 | All over India |
| 14 | COVID-19 / Chardham Area Breaches | 2022 | Delhi, Tamil Nadu, Maharashtra, Telangana, and West Bengal |
| 15 | Landslides, Cloudbursts, Floods, Earthquakes, High Temperatures | 2023 | Himachal Pradesh, Punjab, Delhi, Uttarakhand, Telangana, Uttar Pradesh, Maharashtra, Gujarat |
Source: India Ministry of Home Affairs, Annual Reports, 1993–2023 and World Bank, Annual Report 2012–2022.
The vulnerability of disaster resilience in the mountainous regions of India can be attributed to several interrelated factors. These vulnerabilities impact the capacity of these regions to withstand and recover from disasters effectively. Here is an in-depth analysis of the key vulnerabilities:
India has been hit hard by several disasters. We show in Table 3 the occurrence of India’s deadliest disasters from 1993 to 2023.
1.3.1. Geographical and Environmental Vulnerabilities
Terrain and Topography:
Steep Slopes: Increase the risk of landslides and make construction of resilient infrastructure challenging.
Remote and Inaccessible Areas: Hinder timely disaster response and relief efforts.
Climatic Conditions:
Extreme Weather: Harsh winters, heavy monsoon rains, and increasing climate variability contribute to disasters like avalanches, landslides, and floods.
Glacial Dynamics: Glacial melting and the formation of glacial lakes increase the risk of glacial lake outburst floods (GLOFs).
1.3.2. Socio-Economic Vulnerabilities
Poverty and Livelihood Dependence:
Economic Dependency: Communities rely heavily on agriculture, tourism, and natural resources, which are highly susceptible to disaster impacts.
Low-Income Levels: Limited financial resources reduce the ability to invest in disaster-resilient infrastructure and preparedness measures.
Education and Awareness:
Limited Awareness: Insufficient knowledge about disaster risks and preparedness measures among local populations.
Educational Barriers: Lower levels of education hinder the dissemination and understanding of disaster-related information.
1.3.3. Infrastructure Vulnerabilities
Inadequate Infrastructure:
Non-resilient buildings: Many structures are not built to withstand earthquakes, landslides, or heavy snowfall.
Poorly Maintained Roads: Essential roads and bridges are often in poor condition, exacerbating isolation during disasters.
Critical Infrastructure:
Healthcare Facilities: Limited and inadequately equipped healthcare facilities hamper effective medical response during disasters.
Communication Networks: Inconsistent or weak communication infrastructure can delay emergency response and coordination.
1.3.4. Institutional and Governance Vulnerabilities
Policy and Implementation Gaps:
Inadequate Policies: Disaster management policies may not fully address the unique challenges of mountainous regions.
Implementation Challenges: Even where policies exist, enforcement and implementation at the local level can be inconsistent.
Coordination and Planning:
Fragmented Coordination: Poor coordination among various government agencies, NGOs, and community organizations.
Planning Deficiencies: Lack of integrated and long-term planning for disaster risk reduction.
1.3.5. Environmental and Ecological Vulnerabilities
Deforestation and Land Degradation:
Soil Erosion: Deforestation and unsustainable land use practices lead to soil erosion, increasing landslide risks.
Habitat Loss: Disrupts local ecosystems and reduces natural buffers against disasters.
Water Management Issues:
Water Scarcity: Erratic water supply due to climatic changes affects agriculture and drinking water availability.
Glacial Melt and River Management: Poor management of glacial resources and rivers increases the risk of floods.
1.4. Disaster Management Policies and Framework in India
Disaster management systems, processes, and policies in India can be traced back to 1871–74, during British rule, when the Indian administrative system was undergoing a change and it was the Collector at the District level who was made responsible for carrying out relief work during emergencies and disasters.
In the post-independence period, at the federal level, the Revenue Department was established as a specialized department and made responsible for relief and rehabilitation activities, including disaster management. A system was established that when a disaster occurs, a senior Indian Administrative Service Officer is designated as a Relief Commissioner and coordinates work with the Central Relief Commissioner at the federal level. Over the past sixty years, the approach to disaster management in India has undergone substantive changes. India witnessed major disasters such as the Latur Earthquake (1993), the Malpa Landslide (1994), the Odisha Super Cyclone (1999), and the Bhuj Earthquake (2001), which led to drawing up a systematic, comprehensive, and holistic approach towards disasters (India National Institute of Disaster Management, 2013).
Various strategies for managing natural disasters and facilitating effective planning for safe national development have been brought up for consideration by the Tenth Plan document (2002–2007) by the Planning Commission. The policies have further evolved over the years, and the National Disaster Management Plan released by the Government indicates the vision to make India on the path of becoming disaster-resilient, achieve substantial disaster risk reduction, and significantly decrease the losses of life, livelihoods, and assets—economic, physical, social, cultural, and environmental—by maximizing the ability to cope with disasters at all levels of administration as well as among communities.
In the year 2005, the Government of India established a legal framework and passed the Disaster Management (DM) Act to promote a culture of prevention and preparedness in the context of disaster management in India. The nature of disasters was spelled out in the Act to include Floods, Cyclones, Earthquakes, Epidemics, Chemical Disasters, Industrial Disasters, Rail Accidents, Air Accidents, Fire, Nuclear Incidents, and Mine Disasters. The Act encourages the mitigation of disasters with the help of the latest technology. Key highlights of the DM Act are to:
Mainstream disaster management concerns into the development planning process and strengthen regulatory structures through a robust techno-legal framework,
Involve the people of this country in the planning and implementation of disaster management systems,
Provide an institutional mechanism for drawing up and monitoring the implementation of plans for responding to disasters, and
Involve various wings of the Government in the prevention and mitigation of disasters.
India through its continuous efforts has significantly improved its preparedness to deal with natural calamities. The Disaster Management Act 2005 articulates the need for mainstreaming Disaster Risk Reduction (DRR) into development planning. The National Policy and National Plan on Disaster Management seeks to build a safe and disaster-resilient India. The measures taken by the central and state governments have significantly improved disaster management practices, preparedness, prevention, and response mechanisms resulting in a significant reduction in casualties during natural calamities, including cyclones, in the country.
1.5. Institutional Mechanisms for Managing Disasters in India
Institutional mechanisms have been created under the Disaster Management Act for strategizing, coordinating, implementing, and monitoring disaster management activities (see Table 4).
Table 4. Institutional Mechanisms for Dealing with Disasters
| No. | Name | Composition |
|---|---|---|
| 1 | Cabinet Committee on Security (CCS) | Prime Minister, Minister of Defence, Minister of Finance, Minister of Home Affairs, and Minister of External Affairs |
| 2 | National Crisis Management Committee (NCMC) | Cabinet Secretary (Chairperson), Secretaries of Ministries/Departments and agencies with specific DM responsibilities |
| 3 | National Disaster Management Authority (NDMA) | Prime Minister (Chairperson), Members (not exceeding nine, nominated by the Chairperson) |
| 4 | National Executive Committee (NEC) | Union Home Secretary (Chairperson), Secretaries to the GOI in the Ministries/Departments of Agriculture, Atomic Energy, Defence, Drinking Water and Sanitation, Environment, Forests and Climate Change, Finance (Expenditure), Health and Family Welfare, Power, Rural Development, Science and Technology, Space, Telecommunications, Urban Development, Water Resources, River Development, and Ganga Rejuvenation, The Chief of the Integrated Defence Staff of the Chiefs of Staff Committee, ex officio as members. Secretaries in the Ministry of External Affairs, Earth Sciences, Human Resource Development, Mines, Shipping, Road Transport and Highways and Secretary, NDMA are special invitees to the meetings of the NEC. |
| 5 | National Disaster Response Force (NDRF) | The specially trained force is headed by a Director General. Structured like paramilitary forces for rapid deployment |
| 6 | National Institute of Disaster Management (NIDM) | Union Home Minister; Vice Chairman, NDMA; Members including Secretaries of various nodal Ministries and Departments of Government of India and State Governments and heads of national-level scientific, research, and technical organizations, besides eminent scholars, scientists, and practitioners. |
Source: National Disaster Management Plan, 2016.
The State Disaster Management Authorities (SDMAs) under the Chairmanship of the state Chief Ministers, as well as the District Disaster Management Authorities (DDMAs) under the Chairmanship of Collectors/District Magistrates/Deputy Commissioners have also been put in place to manage situations at the state and local levels.
1.5.1. National Disaster Management Authority (NDMA)
The NDMA was created under an administrative order notified in 2005 under the Disaster Management Act. The main responsibilities of the NDMA are to:
Lay down policies on disaster management,
Approve plans prepared by the Ministries or Departments of the Government of India in accordance with the National Plan,
Lay down guidelines to be followed by the State Authorities in drawing up State Plans,
Lay down guidelines to be followed by the different Ministries or Departments of the Government of India to integrate measures for the prevention of disasters or mitigation of their effects in their development plans and projects,
Coordinate the enforcement and implementation of policies and plans for disaster management,
Recommend the provision of funds for mitigation,
Provide such support to other countries affected by major disasters as may be determined by the Central Government,
Take such other measures for the prevention of disasters, or the mitigation, or preparedness and capacity building for dealing with threatening disaster situations or disasters as it may consider necessary, and
Lay down broad policies and guidelines for the functioning of the National Institute of Disaster Management.
The National Executive Committee (NEC) assists the NDMA in the performance of its functions.
1.5.2. State Disaster Management Authorities (SDMAs)
State Disaster Management Authorities have been set up to lay down policies and plans for disaster management in their respective states. The Act envisages the establishment of a State Executive Committee, to be headed by the Chief Secretary of the State Government, with four other Secretaries of such departments as the State Government may think fit. It has the responsibility for coordinating and monitoring the implementation of the National Policy, the National Plan, and the State Plan.
1.5.3. District Disaster Management Authorities (DDMAs)
District Disaster Management Authorities have been set up in each district of a state as planning, coordinating and implementing bodies for disaster management and to take all measures in the district in accordance with the guidelines laid down by the National and State Authorities. The District Magistrate / District Collector / Deputy Commissioner heads the Authority as Chairperson, with an elected representative of the local authority as Co-Chairperson, except in the tribal areas where the Chief Executive Member of the District Council of Autonomous Districts is the Local Authority.
1.5.4. National Institute of Disaster Management (NIDM)
The National Centre for Disaster Management, established in 1995, was upgraded to the National Institute of Disaster Management (NIDM) after the transfer of responsibility for disaster management to the Ministry of Home Affairs. The main responsibility of the institute is human resource development through the development and implementation of human resource plans, capacity building and training, research, documentation, and policy advocacy in the field of disaster management. NIDM works in tandem with the NDMA and Central, State, and local governments as well as various other stakeholders to build their capacities toward promoting a culture of prevention and preparedness at all levels.
1.5.5. Other Training Institutions
In addition to the above, the following institutions have been established by the Government to train and equip personnel on aspects of disaster management:
National Fire Service College (NFSC): The NFSC at Nagpur is a national-level institution mandated to train the personnel of state fire services/brigades in all spheres of fire engineering.
National Civil Defence College (NCDC): The NCDC at Nagpur is one of the main centers for disaster relief and management training and a nodal center for radiological, nuclear, biological, and chemical emergency response.
1.5.6. National Disaster Response Force (NDRF)
The National Disaster Response Force is a disaster response agency under the National Disaster Management Authority (NDMA) created by the Ministry of Home Affairs, Government of India. It was established in 2009 in Delhi for disaster management and specialized response to natural and man-made disasters. Functioning at the state and central levels under the NDMA based in Delhi, it consists of ten battalions of the Central Armed Police Forces, including two that have been set up in each of the Border Security Force (BSF), Central Reserve Police Force (CRPF), Central Industrial Security Force (CISF), and Indo-Tibetan Border Police (ITBP) trained in various types of natural, man-made and non-natural disasters. All the battalions are being trained to respond to natural disasters while four of them are being specially trained for handling radiological, nuclear, biological, and chemical disasters.
2. Case Studies
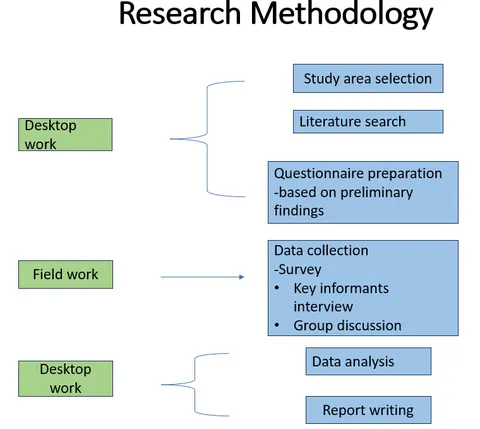
The research methodology for conducting the case studies is illustrated in Figure 2.
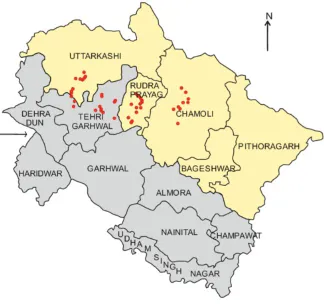
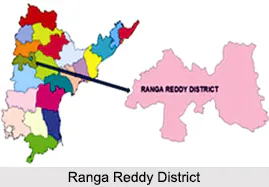
Two field case studies have been conducted, relating to Uttarakhand and Telangana. For Uttarakhand, representing a high-altitude Himalayan mountainous region, the study was carried out in Garhwal, Rudraprayag, and Chamoli. For Telangana, the study was carried out in Madhurapur; the rationale for including Telangana is to compare a high-relief mountainous region with a non-mountainous region characterized by Deccan Plateau topography.
As an exploratory pilot field survey, the questionnaire was administered to 7 households in Uttarakhand and 13 households in Telangana (total 20 households). While this pilot sample provides valuable qualitative ground-level insights into community vulnerabilities and resilience practices, we acknowledge the sampling limitations for broad statistical generalizations, and a larger sample is planned for subsequent investigations. These study locations were decided based on disaster exposure criteria such as landslides, cloudbursts, floods, and seismic activity. The location of the places visited can be seen on the maps given in Figure 3 and Figure 4.
We now present the data collected from Uttarakhand and Telangana. We consider dimensions such as demographics including age, size of family, fuel for cooking, fuel collection source, and water provision. The information provided by 7 households in Uttarakhand and 13 households in the Telangana region is given in Table 5.
Table 5. Responses to Questionnaire by Households
| S. No. | Age of Head | Family Members | Cooking Fuel | Fuel Collection Source | Water Source |
|---|---|---|---|---|---|
| 1 | 70 | 5 | Biogas | Village outskirts including forests | Piped water (piped into dwelling) |
| 2 | 76 | 2 | Biogas | Village outskirts | Piped water (piped into dwelling) |
| 3 | 66 | 5 | Biogas | Village outskirts | Piped water (piped into dwelling) |
| 4 | 55 | 2 | Biogas | Village outskirts | Piped water (piped into dwelling) |
| 5 | 67 | 5 | Biogas and Wood | Forest / Purchase | Piped water (piped into dwelling) |
| 6 | 76 | 6 | Biogas | Village outskirts | Piped water (piped into dwelling) |
| 7 | 67 | 5 | LPG | Retail outlets of Petroleum and Gas Companies | Piped water (piped into dwelling) |
| 8 | 69 | 6 | LPG | Retail outlets of Petroleum and Gas Companies | Piped water (piped into dwelling) |
| 9 | 60 | 10 | LPG | Retail outlets of Petroleum and Gas Companies | Piped water (piped into dwelling) |
| 10 | 55 | 8 | LPG | Retail outlets of Petroleum and Gas Companies | Piped water (piped into dwelling) |
| 11 | 43 | 5 | LPG | Retail outlets of Petroleum and Gas Companies | Piped water (piped into compound, yard/plot) |
| 12 | 48 | 4 | LPG | Retail outlets of Petroleum and Gas Companies | Piped water (piped into compound, yard/plot) |
| 13 | 57 | 6 | LPG | Retail outlets of Petroleum and Gas Companies | Piped water (piped into compound, yard/plot) |
| 14 | 70 | 10 | LPG | Retail outlets of Petroleum and Gas Companies | Piped water (piped into compound, yard/plot) |
| 15 | 55 | 6 | LPG | Retail outlets of Petroleum and Gas Companies | Piped water (piped into compound, yard/plot) |
| 16 | 60 | 10 | LPG | Retail outlets of Petroleum and Gas Companies | Piped water (piped into compound, yard/plot) |
| 17 | 48 | 6 | LPG | Retail outlets of Petroleum and Gas Companies | Piped water (piped into compound, yard/plot) |
| 18 | 68 | 8 | LPG | Retail outlets of Petroleum and Gas Companies | Piped water (piped into compound, yard/plot) |
| 19 | 51 | 4 | LPG | Retail outlets of Petroleum and Gas Companies | Piped water (piped into compound, yard/plot) |
| 20 | 60 | 4 | LPG | Retail outlets of Petroleum and Gas Companies | Piped water (piped into compound, yard/plot) |
Note: S.No. 1–7 represent Uttarakhand households; S.No. 8–20 represent Telangana households.
3. Discussion
It is now proposed to analyze the data collected from 20 families comprising 7 from Garhwal and 13 from Madhurapur as under.
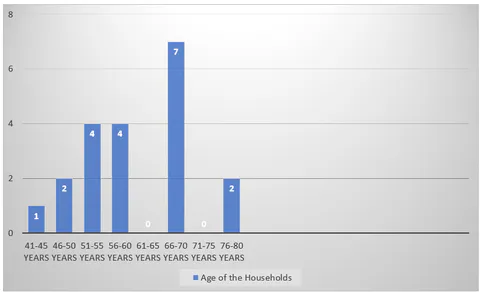
The age of the head of the household varied between 41 and 80 years (see Figure 5). The age group having the highest number of the head of the household was between 66 and 70 years with 7 heads of the household falling in this bracket. The lowest age group between 41 and 45 years had only 1 household; in the highest age group of 76 and 80 years, there were 2 households.
3.1. Number of Family Members
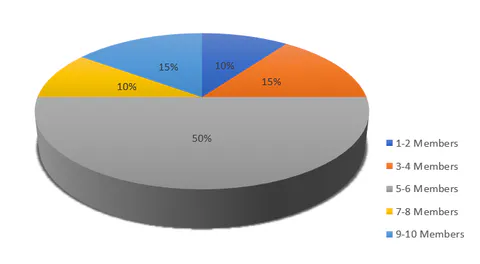
The number of family members differed in the various distribution cycles from a minimum of 1–2 in the first group to 9–10 members in the last group (see Figure 6).
3.2. Impact of Hazards
Impact on Daily Lives: The hazards faced by the locals have significantly impacted their daily lives.
Landslides: Frequent landslides make it difficult for locals to travel and access healthcare and education outside the village.
Lack of Opportunities: Younger generations lose opportunities to grow, develop, and get engaged in various trades and jobs in the village.
Floods: Monsoon season floods damage homes and infrastructure, leaving families without shelter and basic amenities.
Economic and Social Impact: The hazards have negatively affected the local economy. The hazards obstruct participation in socio-economic activities and events such as Gauchar Mela, Auli Festival, Nanda Raj-Jat, Binsar Mela, Chandrabadni Fair, Kunjapuri Fair, Mahashivratri, Dussehra, and Diwali.
Decline in Productivity: Destruction of crops and farmland has resulted in a decline in productivity and income for families.
Challenges for Sustainability: The hazards pose challenges for families to sustain themselves and meet their basic needs.
3.3. Health Services
All the respondents indicated the availability of health services as under:
ASHA and Anganwadi Workers deliver elementary health services at the doorstep, especially childcare and women-related healthcare.
Primary Health Centers attend to the basic health needs referred by the village-level health workers.
The main source of fuel varied from biogas to LPG. The biogas was procured from the nearby forest and areas where cattle were housed. The survey disclosed that the inhabitants had access to drinking water supplied through pipelines with connections extended to inside compounds or dwellings.
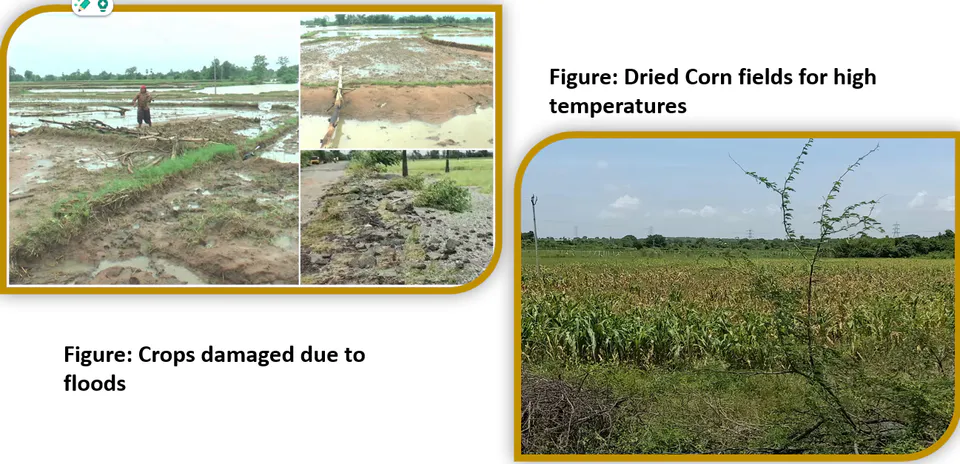
Due to high temperatures and the occurrence of frequent floods in Madhurapur, Telangana, the crops suffered severely causing unprecedented loss year after year.
Many districts in the two states received rainfall much higher than the average levels breaching the reservoirs and dams. The situation was accentuated further by cloudbursts resulting in the loss of human lives, cattle, and property.
The government agencies swung into action but the relief followed the lead-lag pattern. The remedial action was awaiting permanent relief.
3.4. Agriculture, Farming, and Animal Rearing
Major agricultural productions include:
Paddy
Corn
Various Vegetables
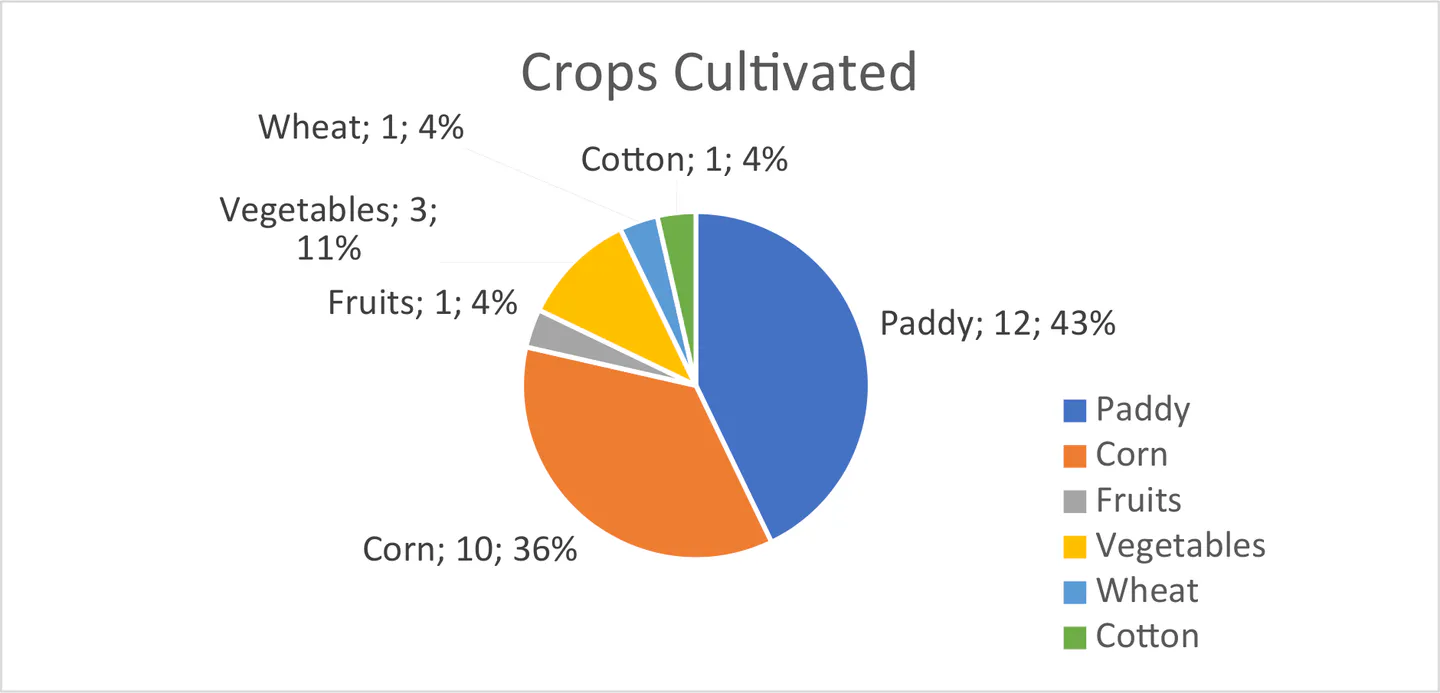
The major agricultural production includes paddy, corn, and various vegetables (see Figure 7). Paddy tops with 43 percent, followed by corn at 36 percent, vegetables at 11 percent, and fruits at 1 percent of respondents.
Animal rearing is a common practice in the area, but limited only to rearing to hybrid cows. The respondents do not rear buffaloes and chicken.
3.5. Field Visits and Floods Data
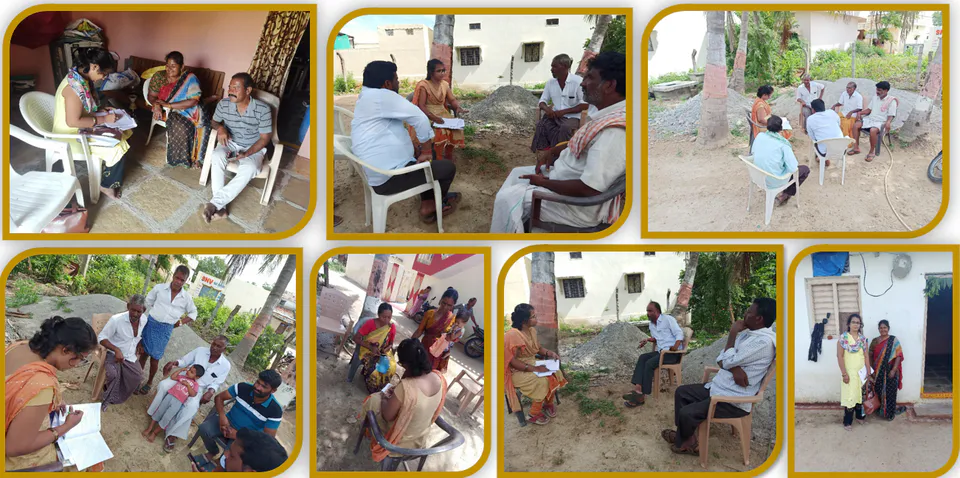
Pictures captured during the field visits and floods are displayed in Figure 8 and Figure 9.
3.6. Educational Background
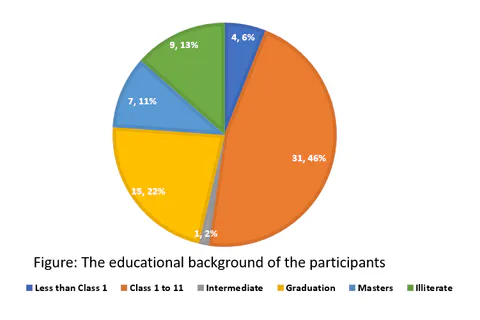
The educational background of respondents is presented in Figure 10:
Most of the respondents have been to school. Only 13 percent of respondents were illiterate.
46 percent of respondents have attended school up to Class 1–10.
22 percent of respondents were graduates.
11 percent of respondents were postgraduates.
3.7. Occupational Background
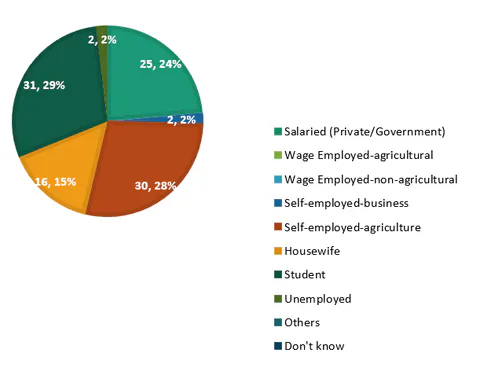
The occupational distribution of respondents is shown in Figure 11:
The respondents are engaged in various types of occupations including self-employment, formal employment, and farming.
Farming engaged 28 percent of respondents.
Students accounted for 29 percent of the respondents.
The data showcases a mix of occupations such as traditional agriculture, employment, and homemaking. Such diversity can enhance community resilience by drawing upon different skill sets during disasters.
15 percent of respondents were housewives engaged as homemakers.
Only 2 percent of the respondents were unemployed.
Reliance on agriculture suggests a strong connection to local resources.
3.8. Quality of Constructed Houses
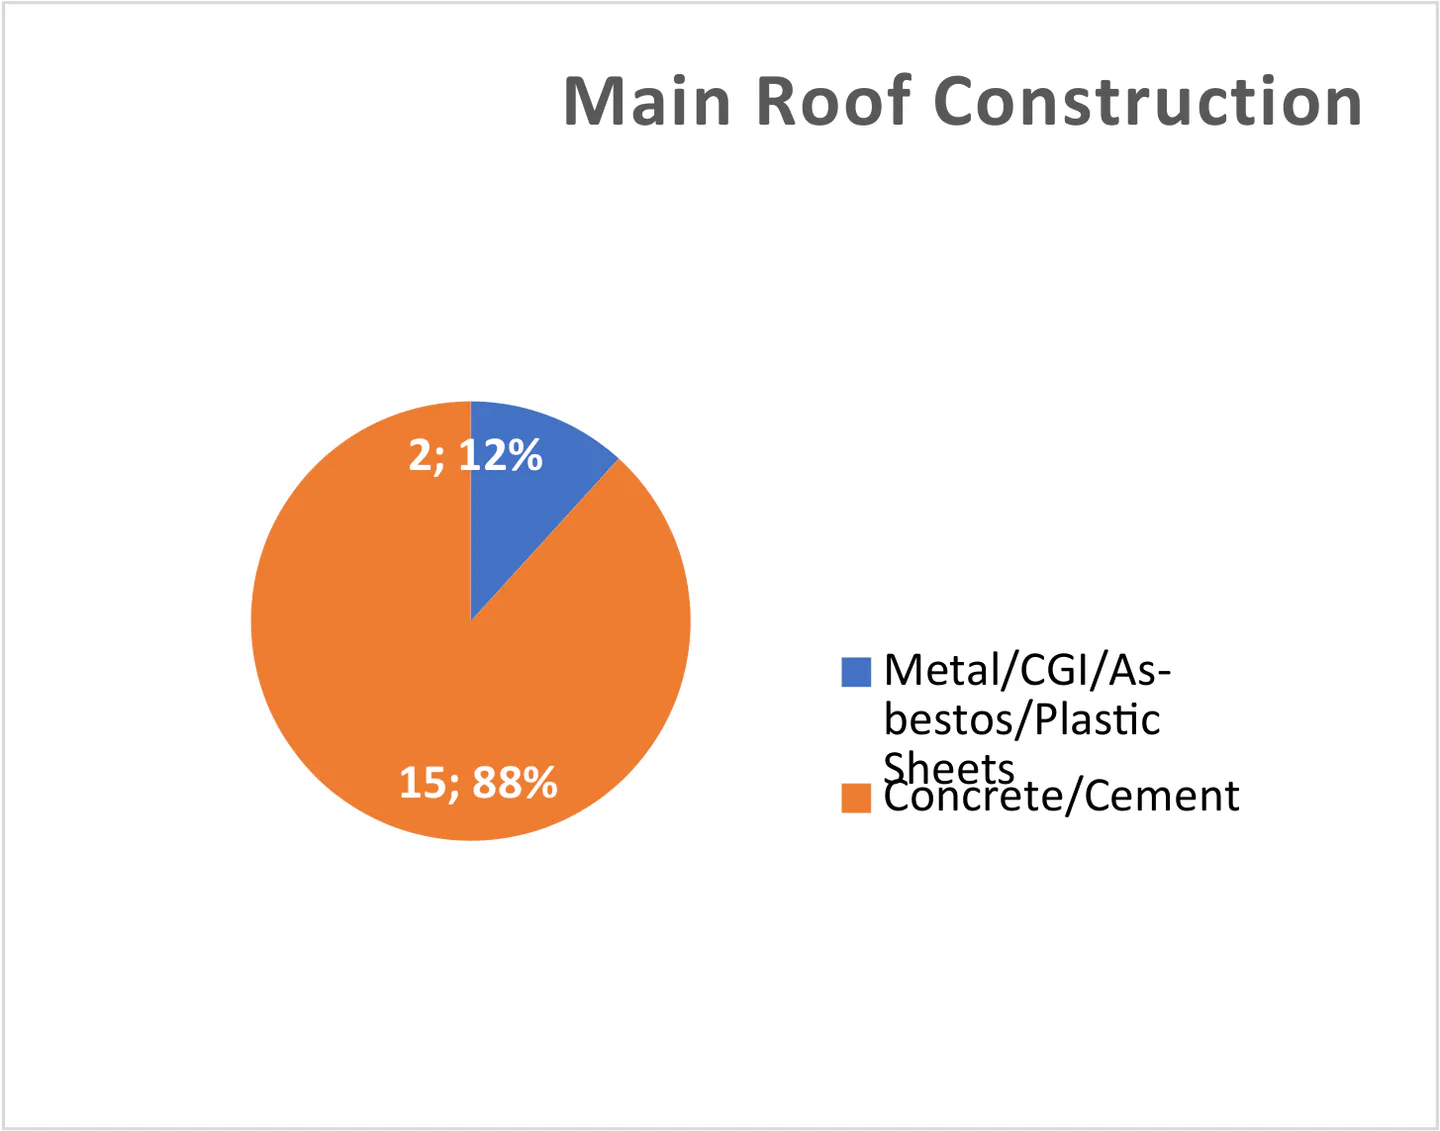
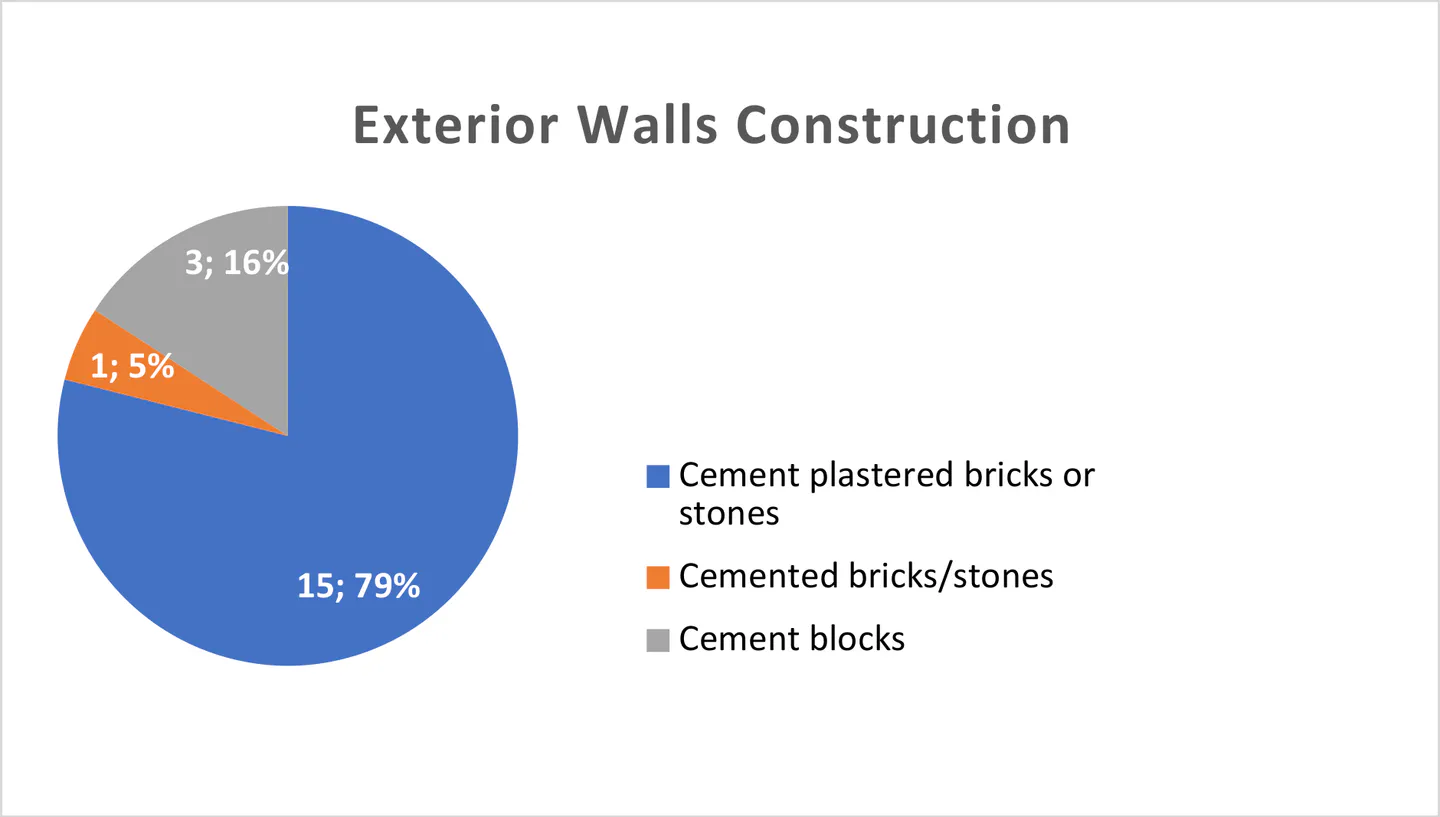
The quality of constructed houses depicts the quality of roof construction and exterior wall construction (see Figure 12 and Figure 13):
Most of the respondents (88 percent) used cement and concrete for casting roofs.
Very few (12 percent) chose asbestos sheets for constructing roofs.
79 percent of respondents used cemented plastered bricks or stones for exterior walls to ensure longer durability against disasters.
Raw and scratchy plastered bricks, broken stones, and cement blocks were used by 5 percent and 16 percent respectively.
3.9. Water Safety Practices
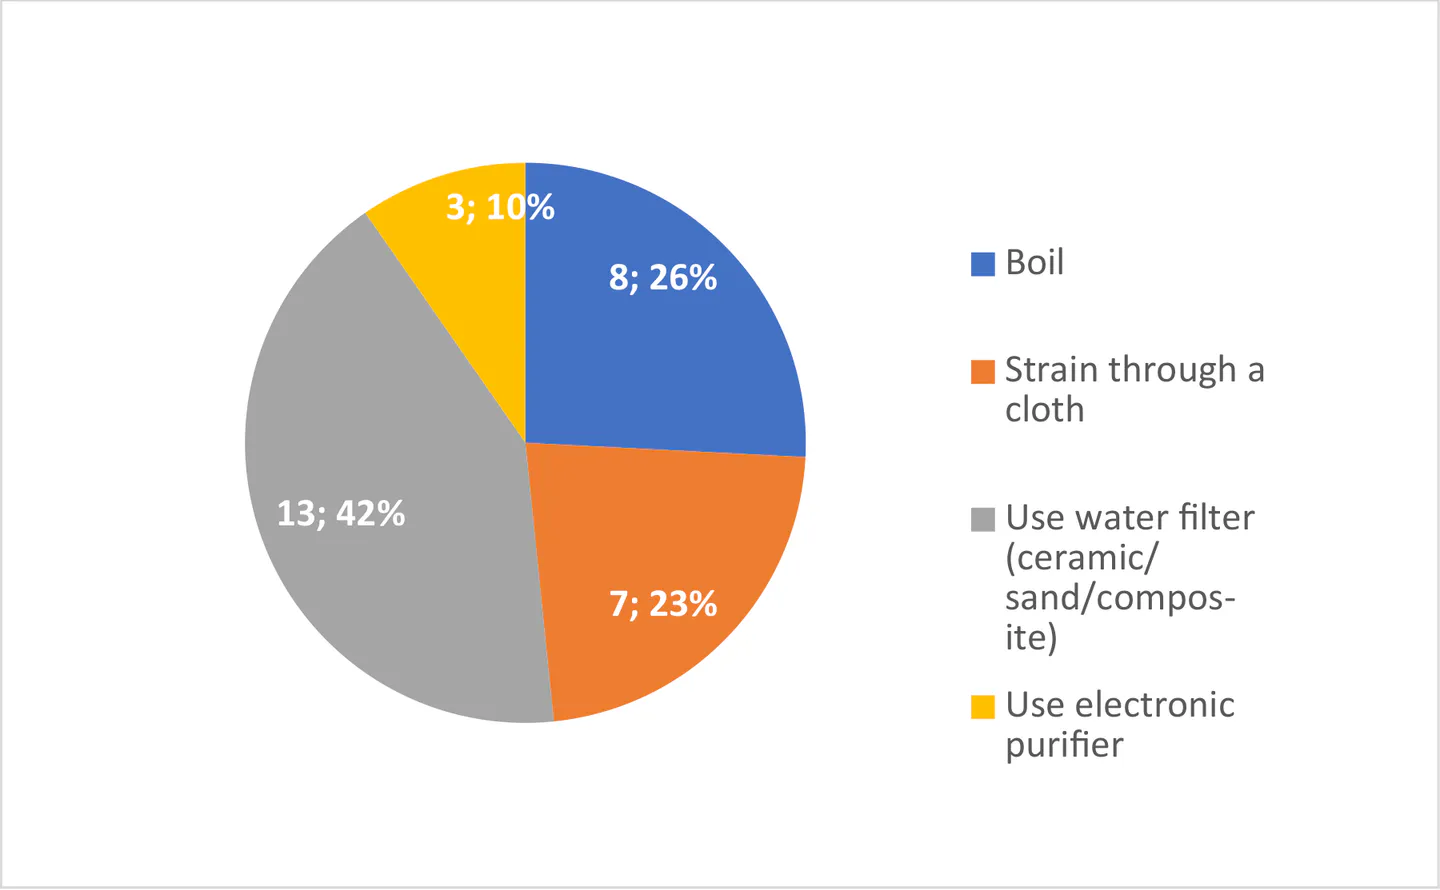
Incidence of Ensuring safe drinking water is crucial for disaster resilience.
The variety of water treatment practices suggests a range of awareness levels about water safety. Boiling, filtering, straining through a cloth, and using electronic purifiers appear to be more robust methods for enhancing water resilience, crucial during disasters when clean water sources may be compromised (see Figure 14).
3.10. Toilet Facilities
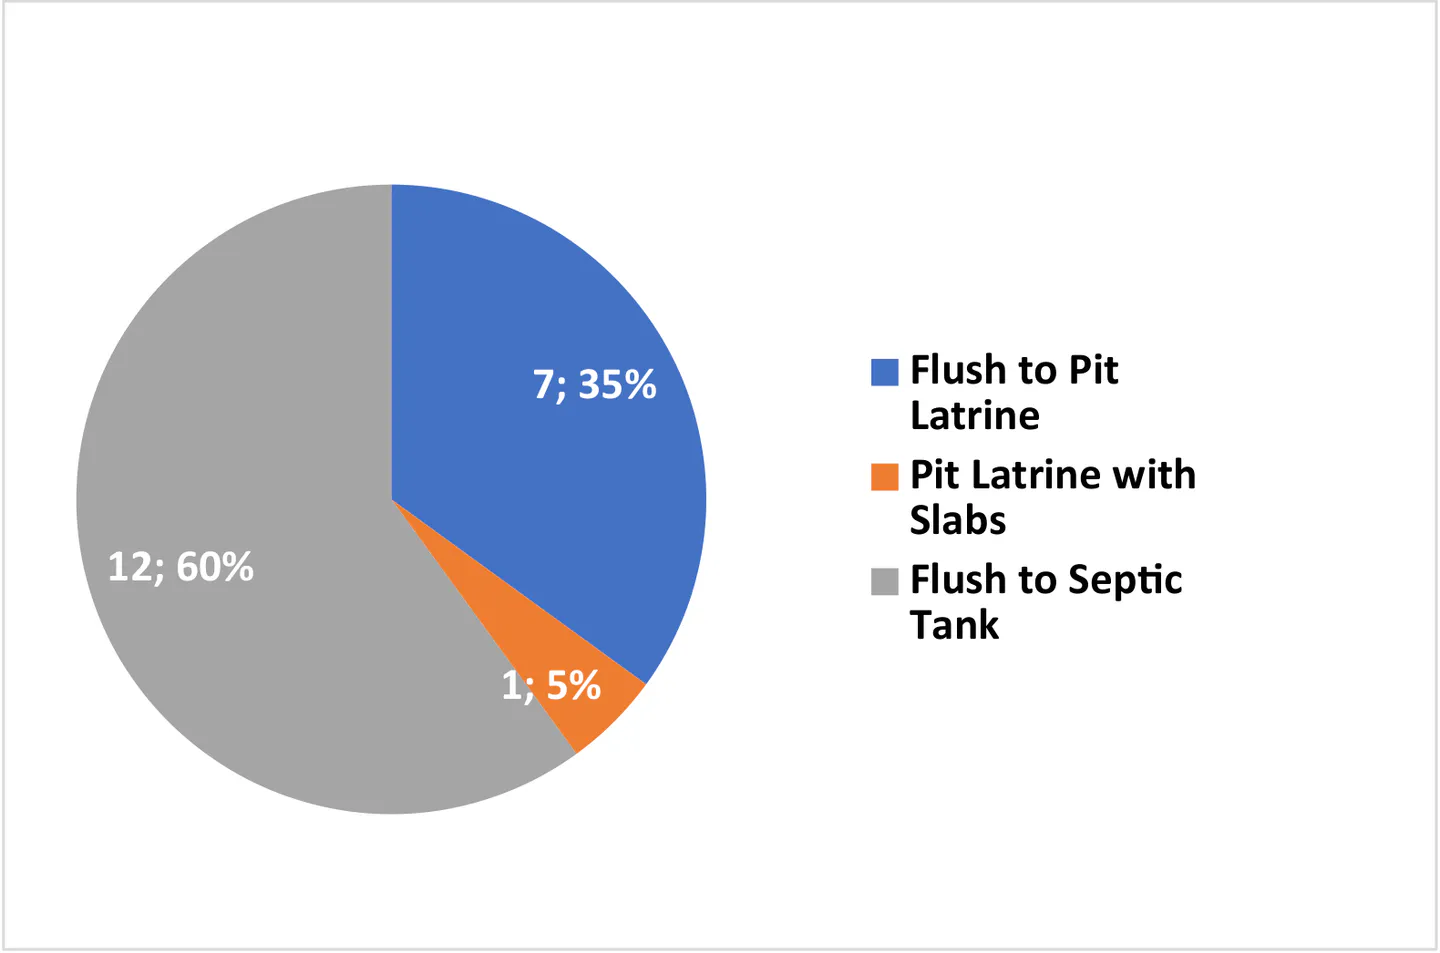
The distribution of toilet types among respondents is presented in Figure 15:
5 percent of respondents have pit latrines with slabs.
35 percent have flush-to-pit latrines.
60 percent have flush to septic tanks.
Toilets have been constructed by the Government for all households lacking facilities.
3.11. Irrigation Practices
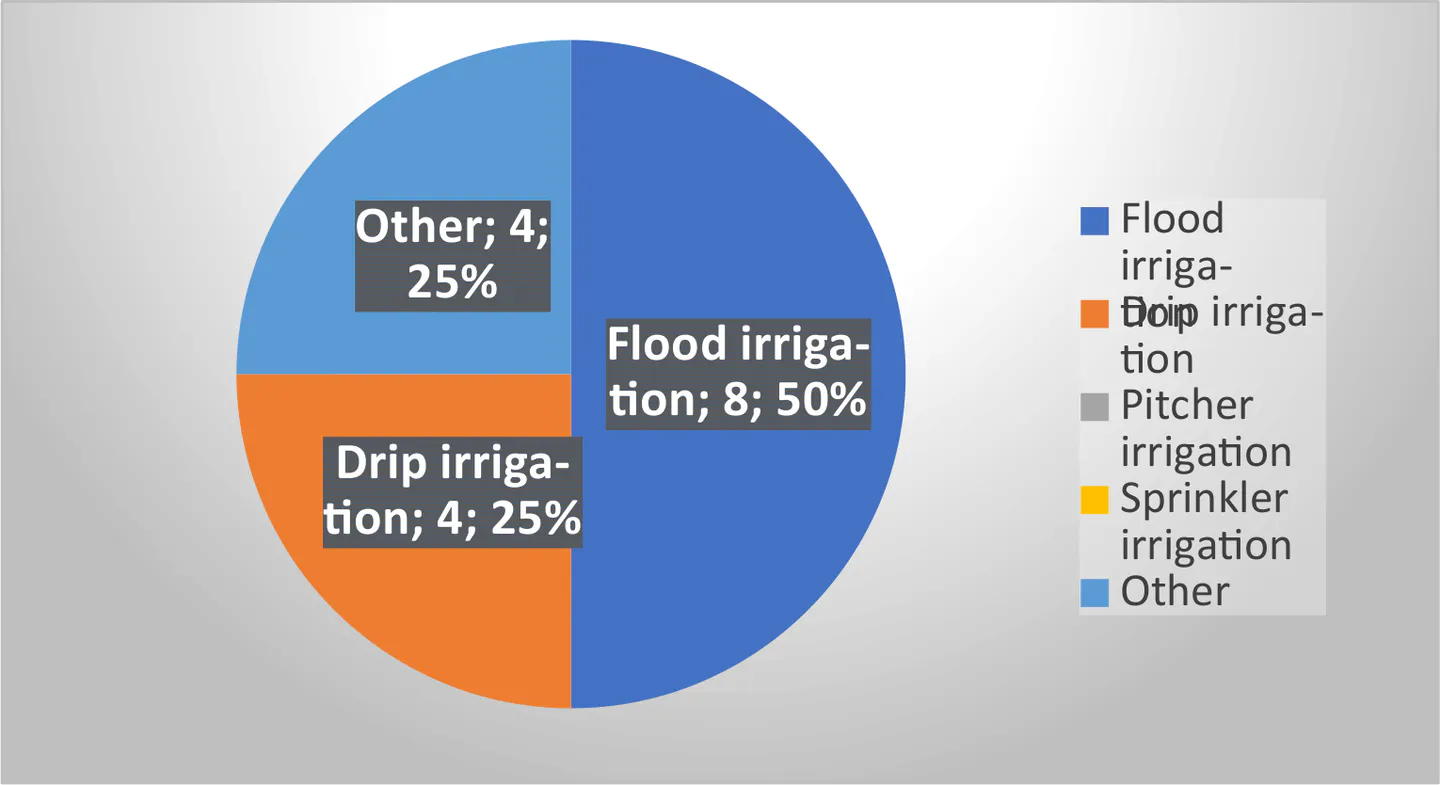
The irrigation practices of respondents are illustrated in Figure 16:
50 percent of respondents depend on flood irrigation.
25 percent of respondents depend on drip irrigation.
The remaining 25 percent use wells, ponds, and rain channels for irrigating fields.
3.12. Weather and Climate Variability (2013–2023)
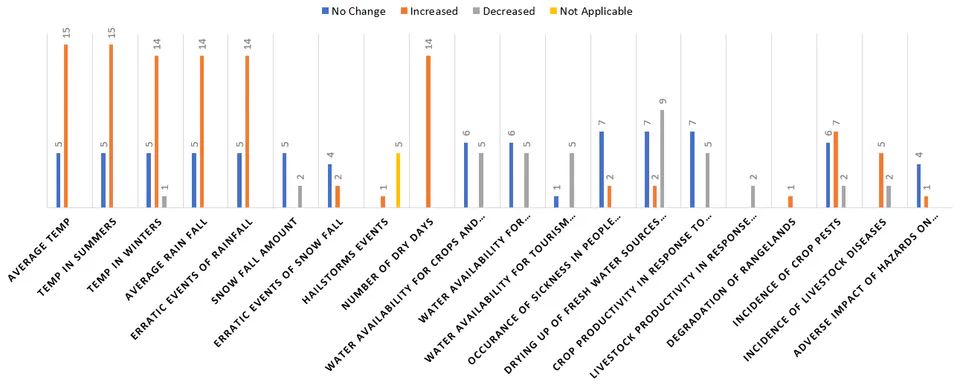
The survey displays the following trends relating to weather and climate variability (see Figure 17):
Average temperatures in summer and winter remained unchanged according to 5 respondents, whereas 15 respondents revealed high variability.
Average rainfall variability was noted by 5 respondents, while 14 respondents reported no change.
Erratic events, snowfall, and hailstorms affected the inhabitants.
Water availability decreased according to 50 percent of respondents for drinking, irrigation, and tourist needs.
Crop productivity decreased as per 25 percent of respondents.
Climate change affected livestock productivity severely as disclosed by 18 respondents.
Rangelands decreased according to 19 respondents.
Pesticide usage increased in 7 cases, decreased in 2 cases, and remained unchanged in 11 cases.
Tourist activities were mostly related to Uttarakhand and remained static.
4. Findings
The broad findings from Garhwal, Chamoli, Rudraprayag (Uttarakhand) and Madhurapur (Telangana) are presented below:
Uttarakhand
Respondents were engaged in small-scale cultivation.
Employed in government jobs, private sector jobs, and small-scale businesses.
Children were studying in Dehradun, Rishikesh, Roorkee, and Delhi.
Did not maintain large cattle herds at houses; they hardly had one cow for milk.
Gas cylinders are widely used for cooking.
Inhabitants do not go to the forest for wood/grass for cooking purposes.
Lifestyles have been undergoing a significant modernization.
Warning systems are in place to caution about impending disasters.
Rehabilitation facilities are extended as first-aid relief.
Telangana
All respondents are engaged in cultivation. Crops are frequently damaged by floods. Many respondents deploy tractors and harvesting cutter machines on a rental basis.
Children study in Shadnagar, a nearby town.
Maintain buffaloes and cows at houses for dairy purposes.
Gas cylinders provided under government schemes are used for cooking.
Lifestyles have been gradually changing. Face limited connectivity to the mainland, depending largely on personal transport.
Warning systems regarding disasters are limited to newspapers, radio, TV news, and social media.
Lack of adequate local health facilities; rehabilitation facilities are primarily extended as first-aid.
Drinking water is adequately available, but water for irrigation is in short supply.
4.1. Some More Case Studies
We present below additional case studies from northeastern hill and flood-prone regions (Assam, Arunachal Pradesh, and Nagaland) that broadly corroborate the results obtained from Uttarakhand and Telangana. These supplementary studies strengthen the case by demonstrating how infrastructure vulnerability, ecological degradation, and shifting hydrological patterns compound disaster risk across varied vulnerable terrains.
Dhemaji District, Assam
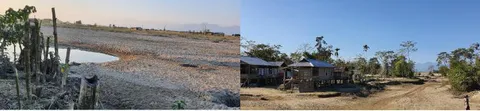
Observations from the 2020 floods in Mas Dihiri village, Dhemaji district:
The village has shifted by 3 kilometers along with the Kumutiya River since 1960.
28 houses in Kekuri village were washed away by the Jiadhal River floods in 2020.
Large swathes of rice fields were covered with sand, rendering them uncultivable for a prolonged period (see Figure 18).
West Kameng, Arunachal Pradesh
Key impacts in West Kameng district (see Figure 19):
Construction of a highway in the district has affected the health of natural springs.
Human interventions exacerbate the impacts of climate change.
At least ten springs from Bhalukpong at the Assam–Arunachal Pradesh border to Morgung village in West Kameng have dried up.
Singchung village is witnessing major changes in its biodiversity and climate indicators due to climate change.
Wokha, Nagaland
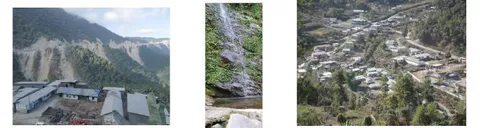
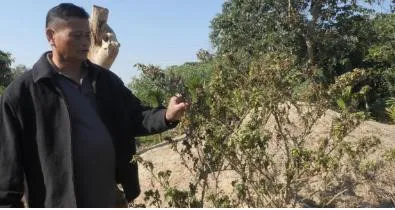
Disaster and ecological observations in Wokha district (see Figure 20):
In 2018, many villages in the district witnessed floods for the first time in a generation; flood waters could still be seen in December 2020.
New pests and insects are attacking vegetables and other crops.
Butterflies and various small and large animal species have decreased in numbers over the years.
Fish populations and aquatic diversity have notably declined.
We now conclude the main findings of the study and suggest the way forward.
5. Conclusions
Based on the empirical investigations and analysis, the study draws the following conclusions:
Disaster Risk Reduction (DRR) needs to move up to scientific and sophisticated levels by putting in place robust early warning systems.
Disaster Risk Reduction machinery must be proactive to thwart the adverse impact of impending disasters.
More trained human resources and dedicated teams are required to combat disasters effectively.
Capacity building has to travel down to grass-roots communities and local governance tiers.
Post-disaster rehabilitation and compensation must be comprehensive and timely.
Deforestation and unsustainable slope destabilization need to be arrested forthwith.
Disaster Risk Reduction should be integrated with formal and informal education at all levels.
The recurring hazards faced by locals significantly impair daily life, livelihoods, and youth employment prospects.
Frequent landslides restrict mobility, healthcare access, and schooling outside rural clusters.
Primary health services and rural connectivity require substantial strengthening.
Disaster management must be interwoven with local democratic leadership and community participation.
5.1. Way Forward: Strategies for Disaster Resilience
The strategic recommendations for enhancing disaster resilience based on the field case studies are outlined below:
5.1.1. Early Warning Systems:
Implementing advanced seismic monitoring and early warning systems across vulnerable Himalayan zones.
Installing automated rain gauges, river level sensors, and landslide detection systems in critical catchments.
5.1.2. Infrastructure Development:
Constructing earthquake-resistant buildings and systematically retrofitting existing public and private structures.
Developing robust road networks equipped with proper cross-drainage and slope stabilization systems to mitigate landslide disruptions.
5.1.3. Community Awareness and Training:
Educating local communities on disaster preparedness, evacuation routes, and rapid response protocols.
Conducting regular mock drills and structured training programs for community-first responders.
5.1.4. Sustainable Land Use Planning:
Enforcing strict techno-legal regulations on construction and hillside zoning in high-risk zones.
Promoting large-scale afforestation and bio-engineering soil conservation practices to stabilize steep slopes.
5.1.5. Water Resource Management:
Implementing continuous glacial lake monitoring and sustainable catchment management practices.
Constructing check dams, retaining structures, and decentralized reservoirs to regulate torrential runoff and attenuate flash flood impacts.
5.1.6. Collaboration and Policy Implementation:
Strengthening institutional coordination among central and state agencies, district administrations, NGOs, and community organizations.
Ensuring stringent, accountable implementation of disaster management policies, environmental protection guidelines, and building codes.