Rajasthan, a land of promises has received ₹ 1549.10 crore FDI inflows in 2019-20 and ₹ 6259.48 crore in 2022-23 which is about a 304 per cent increase in FDI inflows in the last four years. FDI inflows have grown at a Compound Annual Growth Rate (CAGR) of 33.23 percent in Rajasthan in the post-liberalization period in India. While the states are competing to attract more FDI inflows organize investor’s summit and initiate policy reforms to facilitate investment opportunities in their region. This study aims to analyse determinants of FDI inflow in Rajasthan state which is a land-locked state with an abundance of natural resources and skilled manpower. Foreign Direct Investment (FDI) a non-debt-creating capital inflow stimulates employment generation, and fills the gap between domestic saving and investment. It is found that there is a direct relation between FDI inflows and the Gross Domestic Product growth of the host state.
## I. INTRODUCTION
Equity was one of the prime objectives of the planning period in India (1950-1991). However, due to the policy implementation efficiency of a few regions, land reforms and green revolution could succeed only in a few states of India, especially in Punjab, Andhra Pradesh and Tamilnadu. Eventually, these states strengthened their economy fairly well. On the other hand, due to various limitations, other states could not grow at the same pace. Subsequently, there exists a regional imbalance in the Indian economy.
Table 1: Table showing Rajasthan's position in the production of various items
<table><tr><td>Rank</td><td>Production</td></tr><tr><td>1stLeading producer</td><td>Rapeseed, pearl millet (Bajra), mustard, and wool productionCement, 21 plants, an abundance of precious stones, cutting and polishing diamonds, gem industryMetallic and minerals; marble, sandstone, rock phosphate, limestone and lignite, gold, copper and silver</td></tr><tr><td>2ndlargest</td><td>National Highways Network in the stateOilseeds and spices, milksoya bean and coarse cereals</td></tr><tr><td>2nd3rd4thlargest</td><td>Power generation capacity</td></tr><tr><td>7thlargest</td><td>State wise contribution to India's GDP</td></tr></table>
Rajasthan is the largest state of India with a strategic location, availability of Freight Corridor DMIC (Delhi-Mumbai Industrial Corridor) of which 39 percent part passes through the state, covering three big districts i.e Jaipur Ajmer and Jodhpur districts of Rajasthan. In Alwar District (Khushkhera Bhiwadi-Neemrana) industrial region, a model of a future city in about 165 sq kms is proposed namely Greenfield Integrated Township (GIT) and SNB Global City (Shahjahanpur-Neemrana-Behro) in Neemrana and Bhiwadi Tapukada Industrial complex. Presence of unicorns in Jaipur, Car Dekho has become Rajasthan's first unicorn company raised $250 million.

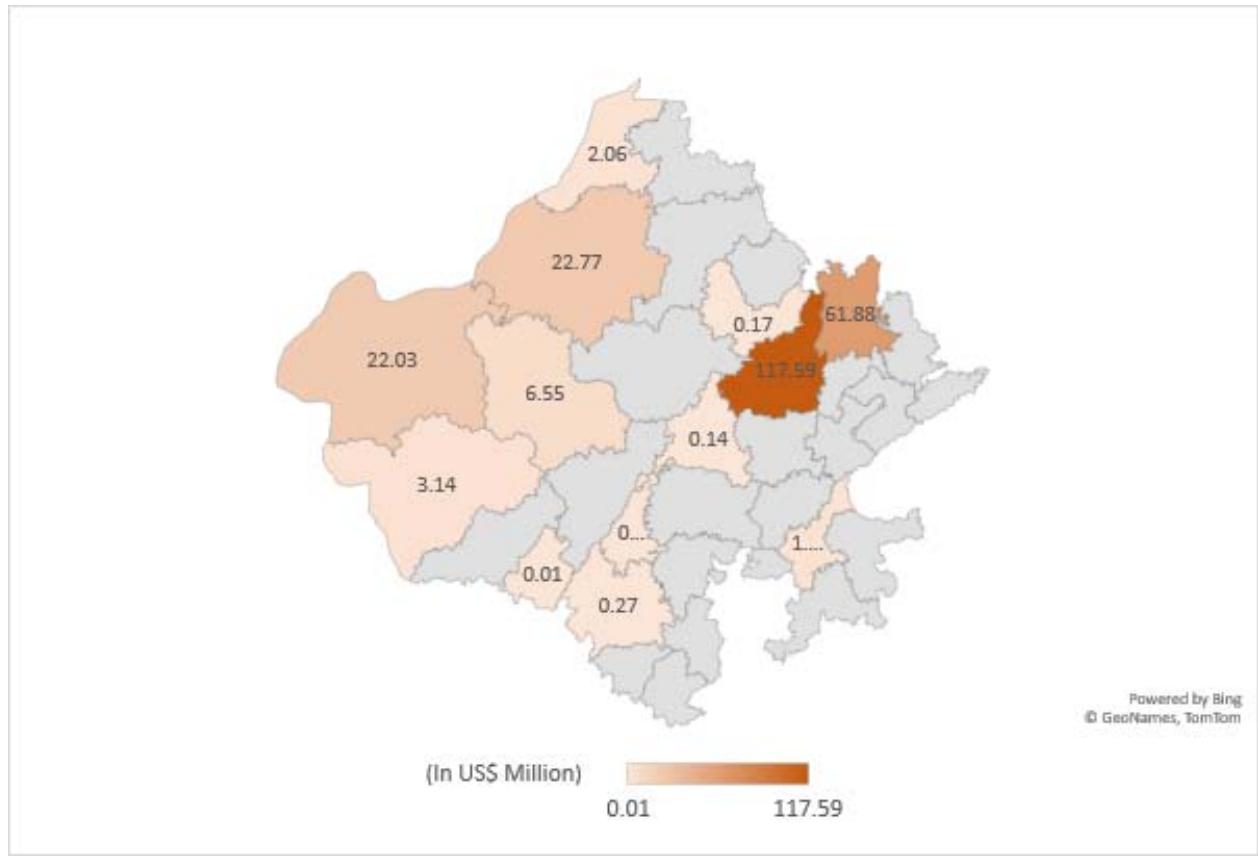
Figure 1: District wise FDI inflow in Rajasthan
Source: Author's presentation with the help of MS Excel 2019
The Pink city of India and state capital Jaipur receives maximum FDI. Alwar district, the host district of Japanese industrial zone attracts second highest FDI inflows in the state. Bikaner, known for its snacks, sweets and wool production also marks its position in FDI inflows. Jaisalmer, with a lot of potential for mineral
oriented industries, handlooms and renewable energy are other two districts also ranks $4^{\text{th}}$ position in FDI attracting location in the state. Barmer, Southwest region of the state with the presence of Cairn energy MNC gets substantial amount of foreign investments.
Table 2: Sectors attracting major FDI's in Rajasthan for the period 2008-09 to 2022-23
<table><tr><td>Sectors</td><td>Amount In (Us $ Million)</td></tr><tr><td>Telephone Communication Services</td><td>756.42</td></tr><tr><td>Solar Energy Based Electric Power Generation</td><td>205.9843</td></tr><tr><td>Hospital Activities</td><td>148.6773</td></tr><tr><td>Internet Service and Content Update Provider Service</td><td>324.4831</td></tr><tr><td>Other Non-Specialized Wholesale Trade N.E.C.</td><td>321.0201</td></tr><tr><td>Other Credit Granting</td><td>464.8385</td></tr><tr><td>Academic Tutoring Services</td><td>245.2593</td></tr><tr><td>Manufacture of Bread</td><td>177.9433</td></tr><tr><td>Non-Life Insurance</td><td>230.3182</td></tr></table>
Table 2 shows the main sectors where Rajasthan is receiving FDI inflows from period 2008-09 to 2022-23, Telephone communication under the telecommunication sector is achieving highest inflows, followed by other credit granting sector under Financial services sector is attracting second highest inflows, and internet service provider such as content updating under the Information and technology head is receiving third highest FDI inflows in the state. Insurance industry, Academic tutoring and Other non-specialized wholesale trade sector also shows movement and attracts foreign investments.
Table 3: A brief tabulation of Policies and Schemes by the Rajasthan Government and their main objectives to develop investment-friendly climate in the Rajasthan state:
<table><tr><td>Policy Initiative</td><td>Objectives</td></tr><tr><td>Rajasthan Solar Energy Policy, 2014</td><td>- To develop 25,000 MW capacity solar power hub for making the state power sufficient.</td></tr><tr><td>Rajasthan State Policy on Intellectual Property Rights, 2021</td><td>- Innovative practices, to promote Entrepreneurship,
- Awareness on copyrights and intellectual property rights</td></tr><tr><td>Rajasthan Electric Vehicle Policy (Revp) 2022</td><td>- Holistic development of electric vehicle ecosystem in the state.
- Promote manufacturing of e -vehicles and batteries in the state.</td></tr><tr><td>Rajasthan MSME Policy, 2022</td><td>- establish 20,000 new MSME units, cumulative investment of 10,000 crore,100,000 employment generation.
- ZED certification to 9000 MSME units</td></tr><tr><td>Rajasthan Logistics, warehouse and logistics park policy, 2022</td><td>- To make a robust network of warehouses
- To build a cost-effective logistics network.
- To make Rajasthan as most conducive ecosystem for industrial development.
- To create a real time data surveillance and analytics Centre.</td></tr><tr><td>Rajasthan Handicraft Policy, 2022</td><td>- to make internationally competitive handicrafts
- to push handicrafts exports-
- To develop handicraft sector a profit-making and growth-oriented sector
- to create 50,000 jobs in the Handicrafts sector in the next 5 years.</td></tr><tr><td>Rajasthan Investment Promotion Scheme, 2014, 2019, 2022</td><td>- To achieve 15 percent annual growth rate in manufacturing and services.- Inclusive regional growth- Attractive investments in sunrise sector- To priorities climate and sustainability, incentivize green initiatives.</td></tr><tr><td>Rajasthan Film Tourism Promotion Policy, 2022</td><td>- To offer film shooting friendly destination.- Skill development- Employment generation</td></tr><tr><td>Mukya Mantri Laghu Udyog Protsahan Yojana (MLUPY), 2019</td><td>- Loan offer to manufacturing and service sector- Employment generation</td></tr></table>
Rajasthan Investment Promotion Scheme, 2014, 2019, 2022
Numerous dedicated web portals are operated by the state government agencies to forester the ease of doing and assistance to the investor:
1. INVEST INDIA (https://www.investindia.gov.in/state/ rajasthan)
2. INDUSTRIAL BUREAU OF INVESTMENT PROMOTION
3. (https://industries.rajasthan.gov.in/bip/#/home/dpt Home)
4. RAJ NIVESH (https://rajnivesh.rajasthan.gov.in/)
5. INVEST RAJASTHAN (https://invest.rajasthan.gov.in/)
6. RAJASTHAN STATE INSUTRAL DEVELOPMENT AND INVESTMENT CORPORATION (https://industries.rajasthan.gov.in/riico/#/home/dptHome)
Time bound approval and clearance through single window clearance is a major radical step by the state to reach out to the investors and make the investment flow easy and convenient in the state.
Table 4: Potential sectors of Rajasthan which are backed up by favorable resources in the state:
<table><tr><td>Sectors</td><td>Basis of the potential of the sector</td></tr><tr><td>Agri Processing</td><td>- Largest production of mustard, medicinal and aromatic crops
- pulses, garlic, Isabgol mustard, pearl seeds (bajra), guar gum, coriander
- 2ndLargest Milk producing state
- Presence of 100 plus automobile and accessory manufacturing units.
- Manufacturing units and assembling plants of reputed MNCs like Hero Motors, Honda Cars, and Ashok Leyland</td></tr><tr><td>Auto and EV</td><td rowspan="2">- Availability raw material such as Silica and Copper
- Bhiwadi region within National Capital Region (NCR) is proposed as ESDM hub.
- Mahindra World City, equipped with state of art and modern technology in the Pink city of India.</td></tr><tr><td>Electronics System Design & Manufacturing</td></tr><tr><td>IT & ITES</td><td rowspan="2">- IT SEZ -Mahindra World City in Jaipur
- Fintech park to proactively support IT players in Finance Segment.
- Pharmaceutical Manufacturing
- MedTech - Medical Devices Park
- Opportunities on PPP Mode
- Medical Education and Research</td></tr><tr><td>MEDICAL & HEALTH</td></tr><tr><td>MINES, MINERALS AND CERAMICS</td><td>- Only producer of Zinc and Lead
- Highest repute in Marble, Calcite, and Selenite
- Leading producer of Limestone, Copper Ore, Rock Phosphate, Gypsum and Silver
- feldspar, gypsum, ball clay, fire clay, silica sand, china clay, limestone and dolomite
- Largest on-shore producer of Crude Oil and second largest producer of Natural Gas in India.</td></tr><tr><td>RENEWABLE ENERGY</td><td>- highest installed solar generation capacity (over 8000 MW)
- the region receives 300 plus days of bright sunny days, favorable for solar energy.
- functional 2245 MW Solar Park in Bhadla, Jodhpur in 5783 hectares.</td></tr></table>
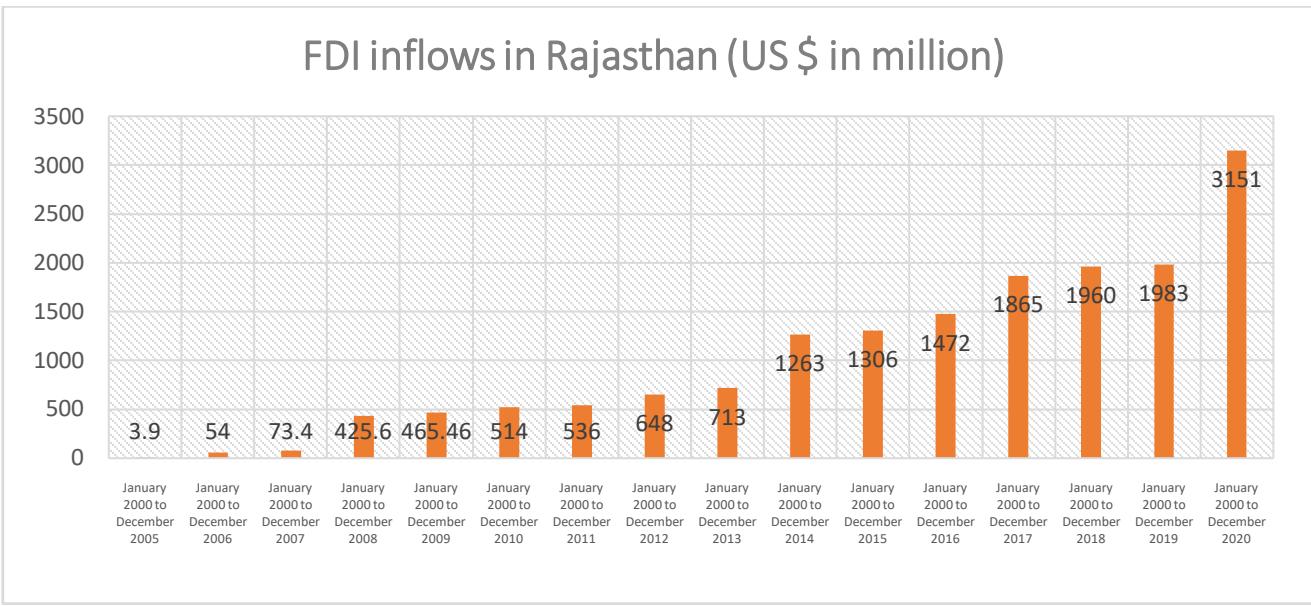 Figure 2: Cumulative FDI inflows in Rajasthan State in US
$ Million
Source: Researcher's computation from DPIIT, Ministry of commerce, Govt. of India
From a meager 3.9 million US Dollars in the year 2005 to 3151 million US Dollars in the year 2020 shows that there is a positive cumulative growth in FDI inflows in the state. Various efforts by the state government such as MSME sector reforms, policy ease, Rajasthanan investment Promotion policy, New Industrial policy and investment submits all have contributed to
make Rajasthan as an investor's friendly state in India. However, the total share of FDI inflows are minimal and it accounts for only one percent of the share. There is huge potential in the state and the government should take a mission mode action to attract more FDI's, so that region can march ahead on the path of economic development.
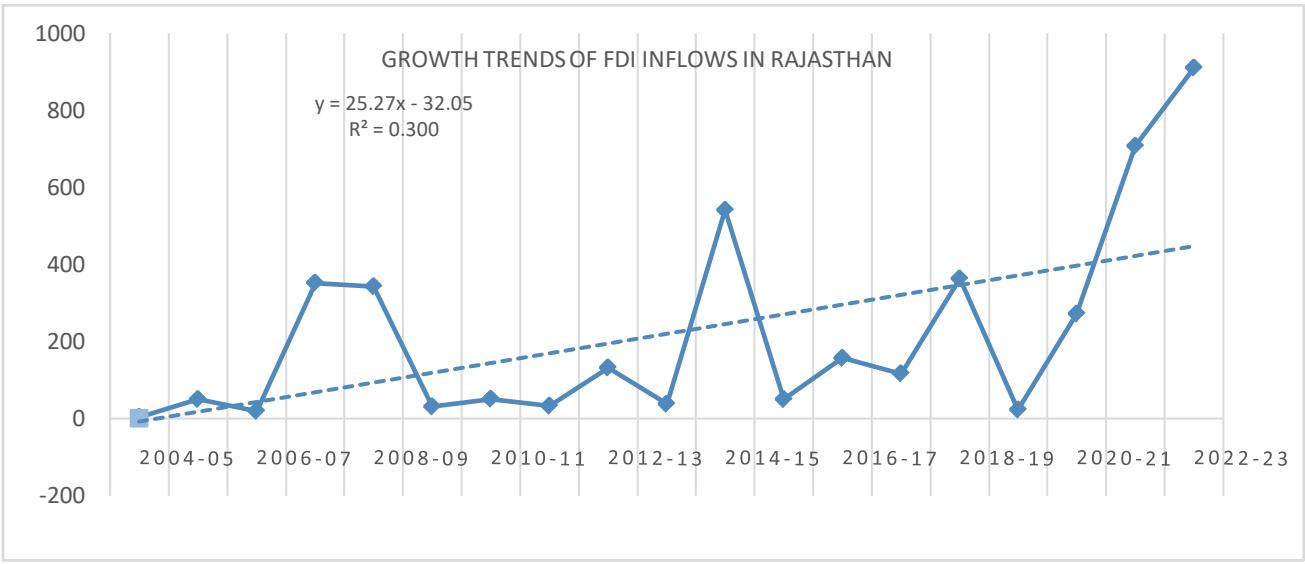
Figure 3: Annual growth trends of FDI inflows in Rajasthan State
Source: Researcher's computation from DPIIT, Ministry of commerce, Govt. of India
The amount of FDI inflows have grown significantly ear on year in Rajasthan, there was a significant rise in the inflows during 2013-14 due to investments in telecommunication sector, leather industry and plastic products manufacturing. A positive movement was observed during 2017-18, investment flows in hospitality industry, construction industry, credit
granting banking momentum and monetary intermediation of commercial banks. In post corona pandemic, a positive trend in observed in investments in hospital industry and Rajasthan has been emerging as a medical tourism Centre, whole sale trades also account a major part in inflows and educational tutoring has also able to attract FDI inflows in the state.
## II. REVIEW OF LITERATURE
### a) Inter-State Studies on FDI inflows
According to (Sebastian Morris, 2004), Gujarat is one of the leader states in attracting FDI share in India, but it has fall short in comparison to its peer states such as Tamilnadu and Maharashtra. The reason is Gujarat has focused only in chemical sector and small-scale manufacturing sector and not paid much emphasis on Information technology and biotechnology which are the expected booming sectors in future. Quality governance, poor electricity supply and high price situation are some more factors those have adversely affected the FDI inflows in Gujarat.
Archana, Nayak and Basu (2007) investigated in their econometric analysis on the impact of FDI in India that FDI have a positive impact on labour productivity and employment. Labour efficiency has improved due to bubble over effects of FDI through introduction of capital movement, Tech- upgrading and managerial skills. The FDI inflow and developed states have a positive relation and it is found that rich states have a high labour productivity rate while the backward states have a negative labour productivity. The impact of FDI on labour productivity depends on the capacity to absorb technology in the host country (Nelson and Phelps, 1966; Benhabib & Speigel, 1994). The findings have rose a serious question that after New economic policy 1991, the disparities between rich and poor states of India are widening as the absorption capacity of less develop states is poor, and thus unable to attract sufficient amount of FDI in comparison to the developed states of India.
Chatterjee, Mishra and Chatterjee (2013) identified the factors influences inter-state variations in the FDI inflows. The FDI inflows in states are significantly influenced by the profitability of the existing enterprises in these regions. There is neutral impact of social or physical infrastructure in attracting FDI in various states of India. FDI inflows fill the gap between desired and actual level of capital stock, and to push the economic growth through outside investment. It is suggested that states should reframe policies towards investment-oriented environment and skill their human capital as efficient.
J Achanyya (2015) found that FDI are the heterogeneously spread over different Indian states there are two major determinants for variation in FDI inflows in states i.e. favorable policy of the state and development level in the state. This paper examines the income level of the people in rich states and poor states, volume of trade and FDI inflows in these states. It also highlights other significant factors for FDI receipts i.e. social resource, historical resource and natural resources. Strongly recommends to equalize the growth
in all the states of the country, through a push in Industry and agriculture sector of backward states.
According to Sinha and Nayan (2017) analysed that more than 85 percent of FDI is concentrated in five states (Maharashtra, Delhi, Tamilnadu, Gujarat and Karnataka) of India, Northeast states of India almost get negligible FDI inflows. The state governments should do policy promotion to attract FDI in all the Indian states in equitable manner.
Saha and Bhowmick (2020) found that a positive correlation in ease of doing and FD inflows, policy makers must acknowledge this linkage and align their policies towards developing better conditions for ease of doing environment. The concentration of FDI in few states has resulted in skewed economic growth across the regions, FDI inflows facilitates employment opportunities and better standard of life. Urbanization, rapid industrialization and agglomeration of firms have created pull factors for FDI inflow in specific regions.
Singh, and D S (2020) in her research paper titled as "Foreign Direct Investment (FDI) and Growth of States of India" explored that excellent industrial development, financial and physical infrastructure has led Maharashtra as highest FDI receiving state in India. Sectors like electronics, automobile and auto accessories, hardware and petrochemical are most successful to attract FDI inflow in the state. Influx of FDI has contributed in the increase of per capita income, growth in GDP and ranked the state as third richest state in India.
A P Bhave (2014) analysed in his doctoral dissertation that introduction of SEZ policy in 2006, robust connectivity with international Airports, Delhi Mumbai Industrial Corridor (DMIC) and ports enable access to import -export in the state, growth in service sector are advantage for the Maharashtra state.
P. Kumar (2023) "Trends and Patterns of Foreign Direct Investment Inflows in Karnataka" Karnataka has successfully recovered and attracted the highest FDI in the post-pandemic period top with about 37.5 percent inflows. Aerospace, defense manufacturing, Biotech, and Fintech are the dominant sectors receiving this inflow (KESDM). Historical data reveals that the state has successfully grabbed global investments as a consistent part of the state's economy and generated a significant number of job opportunities. The state of Karnataka is aware of the benefits of FDI inflow. Eventually, the region is progressing as a reputed investor's investor-friendly location for Foreign Direct Investment (FDI) inflows. FDI inflows in Karnataka have risen substantially over the period of 2012- 2022. The analysis of FDI inflows in Karnataka shows that the total FDI inflow share in the state was US $ 1023 million in 2012-13 which rose to almost four times in the year 2015-16 but declined in the next year i.e. 2016-17 years and remained only US $2132 million. Again, in the next
year, it increased to US $8575 million in the year 2017-18. The year 2019-20 suffered the terrible hit of the Covid-19 pandemic and economies were sluggish globally. However, India did a 'V' shape recovery and the inflows rebounded to US$ 7670 million in the year 2020-21. Karnataka received all-time high inflows in the year 2021-22 and topped the country with about 37.55 percent of FDI inflows share. The presence of large multinational companies has attracted other new investors also eventually Karnataka has become a hub of investment.
## III. DATA AND METHODOLOGY
The secondary data used in the study are annual data in respect of FDI flow and selected variables for the time period 2004-05 to 2022-23 of Rajasthan state of India. The analysis focused on finding
the determinants of FDI inflow in the state. The data is compiled from economic surveys of various years of Rajasthan state, DPIIT, Ministry of Commerce, Government of India and handbook of statistics on Indian states, RBI. The dependent variable FDI inflows in Rajasthan is regressed with possible independent variables, correlation analysis is done to identify the suitable variables. First of all, general characteristics of data are investigated by using descriptive statistics. Model-specific econometric test was also run to check the variability and validity of the model.
I performed regression analysis, first simple linear regression analysis to estimate the relationship between independent variables and dependent variables, followed by it, a multiple linear regression model is developed to see the impact of the most effective variables.

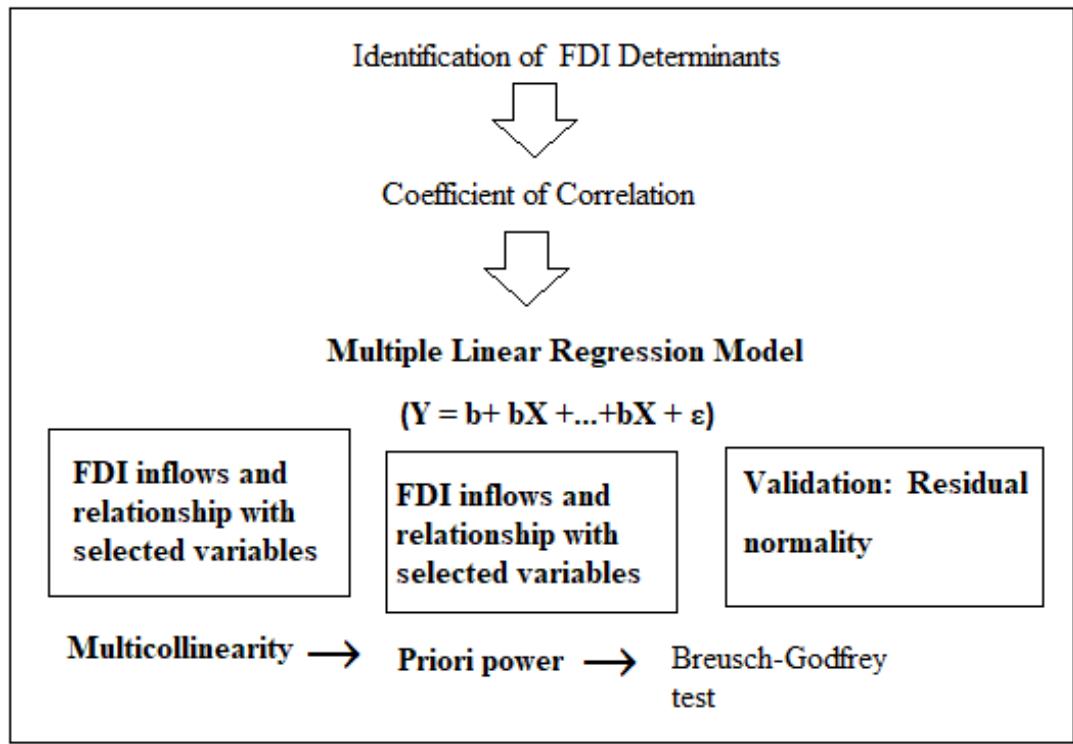
Figure 3: Conceptual Framework for FDI Determinants
Source: Researcher's Model (2023)
Table 5: List of Independent Variables Selected for the Study
<table><tr><td></td><td>Type of factor</td><td>Variable</td><td>Acronyms of indicators</td><td>Expected Sign</td></tr><tr><td>A.</td><td>Market size</td><td>NSDP per capita</td><td>SGDP</td><td>+</td></tr><tr><td>B.</td><td>Infrastructure</td><td>Per capita availability of power</td><td>POWER</td><td>+</td></tr><tr><td>C.</td><td>Labour Productivity</td><td>Gross value added by the construction sector</td><td>GVAC</td><td>+</td></tr><tr><td>D.</td><td>Trade Openness</td><td>Total exports from the state</td><td>EXPORT</td><td>+</td></tr><tr><td>E.</td><td>Government policy</td><td>State Own Tax Revenue</td><td>OTAX</td><td>+</td></tr><tr><td>F.</td><td>Availability of credit</td><td>Credit to the industry by scheduled commercial banks</td><td>CREDIT</td><td>+</td></tr><tr><td>G.</td><td>Industrial sector</td><td>Net Value added by Industrial sector</td><td>NVAI</td><td>+</td></tr><tr><td>H.</td><td>Investment climate</td><td>Gross Capital Formation</td><td>GCF</td><td>+</td></tr></table>
### a) Research Hypothesis
Testing the research hypotheses, in this study requires empirical analyses based on samples or observations.
H1: There is a significant relationship between the state GDP of Rajasthan and FDI inflows in Rajasthan.
H2: There is a significant relationship between the Availability of Credit to the Industry and FDI inflow in Rajasthan.
H3: There is a significant relationship between the Availability of Power and FDI inflows in Rajasthan.
H4: There is a significant relationship between the state's Own Tax Revenue of Rajasthan and FDI inflows in the state.
H5: There is a significant relationship between the State Gross Capital Formation of Rajasthan and FDI inflows in the state.
H6: There is a significant relationship between capital expenditure and FDI inflows in Rajasthan.
H7: There is a significant relationship between state Gross value addition by the construction sector of Rajasthan and FDI inflows in Rajasthan.
H8: There is a significant relationship between Total Exports of Rajasthan and FDI inflows in the state.
## IV. EMPIRICAL MODEL AND ANALYSIS
### a) Model Specification
Source: Prepared by Researcher.
Model I: Foreign Direct Investment Correlation Model
Karl Pearson's correlation coefficient (r) is the most common mathematical tool to measure a linear relationship between two different variables. This tool is used to find the strength of the relationship of two variables and their direction.
$$
R = \frac{(n (\Sigma x y) - (\Sigma x) (\Sigma y))}{(\sqrt [ n ]{[ n \Sigma x 2 - (\Sigma x) 2 ] [ n \Sigma y 2 - (\Sigma y) 2]} )}
$$
Where
$$
R = Pearson Coefficient
$$
n = number of the pairs of the stock
$\sum xy = \text{sumofproductsofthepairedstocks}$
$\sum x2 = \text{sumofthesquared} x$ scores
$\sum y2 = \text{sumofthesquared} y$ scores
Table No 6: Karl Pearson's Coefficient of Correlation
<table><tr><td>Variables</td><td>Coefficient of Correlation (r)</td></tr><tr><td>State Gross Domestic Product (SGDP)</td><td>0.5545*</td></tr><tr><td>Credit to Industry (CREDIT)</td><td>0.6098*</td></tr><tr><td>Availability of power (POWER)</td><td>0.6589*</td></tr><tr><td>Gross Capital Formation (GCF)</td><td>0.4032NS</td></tr><tr><td>Own Tax Revenue Collection (OTAX)</td><td>0.5541*</td></tr><tr><td>Domestic Capital Expenditure (CAPEX)</td><td>0.5058*</td></tr><tr><td>Gross Value Added by Construction (GVAC)</td><td>0.5853*</td></tr><tr><td>Total Export by the State (EXPORT)</td><td>0.7921*</td></tr></table>
A moderately strong degree of correlation is found among the variables except for Gross Capital Formation (GCF) where the coefficient of correlation value is 0.4032 and p-value $>0.05$ is also not significant.
However, a strong relation is found between total exports and FDI inflows, the coefficient of correlation value is 0.7921 with p-value $< 0.05$. Availability of power $(0.6589^{\star})$, Credit to Industry $(0.6098^{\star})$ and Gross Value Added by Construction $(0.5853^{\star})$ are some other variables where a high degree of relationship is found. Other variables have also shown a moderate positive relationship with FDI inflows in the Rajasthan state.
Multiple linear regression formula
### b) Effects of various macro-economic indicators on FDI inflow in Rajasthan
Model II: Multiple Linear Regression Model
Multiple Linear Regression (MLR) is a statistical technique uses two or more than two explanatory variables to estimate the outcome of a dependent variable. The researcher uses variables transformations, calculates the Linear equation, $R$, $p$ -value, outliers and the adjusted Fisher-Pearson coefficient of skewness. After checking the residuals' normality, multicollinearity, homoscedasticity and priori power, the program interprets the results. MLR is an extension of linear regression, FDI as a dependent variable is models as function of various determinants.
$$
Y = b + b X + \dots + b X + \varepsilon ,
$$
Model 1: The linear regression model
$$
Y = b + b X + \dots + b X + \varepsilon ,
$$
$$
F D I t = \beta 0 + \beta 1 S G D P t + \beta 2 C R E D I T t + \beta 3 P O W E R t + \beta 4 G C F t + \beta 5 O T A X t + \beta 6 C A P E X t + \beta 7 G V A C t + \beta 8 E X P O R T t + \varepsilon t
$$
### c) Result of Multiple Regression Analysis
<table><tr><td></td><td>Coeff</td><td>SE</td><td>t-stat</td><td>Stand Coeff</td><td>p-value*</td></tr><tr><td>Intercept</td><td>-30.175981</td><td>12.053265</td><td>-2.503553</td><td>1.146825</td><td>0.027734</td></tr><tr><td>SGDPt</td><td>—</td><td>—</td><td>—</td><td>—</td><td>—</td></tr><tr><td>CREDITt</td><td>3.457255</td><td>1.065965</td><td>3.243311</td><td>1.43348</td><td>0.0070432</td></tr><tr><td>POWERt</td><td>-7.980006</td><td>4.352339</td><td>-1.833498</td><td>-1.322835</td><td>0.0916371</td></tr><tr><td>GCFt</td><td>-2.502623</td><td>0.983523</td><td>-2.54455</td><td>-0.816444</td><td>0.0257222</td></tr><tr><td>OTAXRt</td><td>3.144035</td><td>1.293855</td><td>2.429975</td><td>1.265031</td><td>0.031734</td></tr><tr><td>CAPEXt</td><td>-2.947398</td><td>1.447305</td><td>-2.036473</td><td>-1.263023</td><td>0.0643899</td></tr><tr><td>GVACt</td><td>5.766918</td><td>2.686254</td><td>2.146825</td><td>1.449226</td><td>0.0529425</td></tr><tr><td>EXPORTt</td><td>—</td><td>—</td><td>—</td><td>—</td><td>—</td></tr></table>
#### 1. FDI inflow and relationship with selected variables
R square (R) equals 0.742577. It means that the predictors (X) explain 74.3 percent of the variance of FDI inflows. Adjusted R square equals 0.613866. The coefficient of multiple correlation (R) equals 0.861729. It
means that there is a very strong correlation between the predicted data (y) and the observed data (y). Ln(Y) = -30.175981 + 3.457255 Ln (CREDIT) - 7.980006 Ln (POWER) - 2.502623 Ln (GCF) + 3.144035 Ln(OTAX) - 2.947398 Ln(CAPEX) + 5.766918 Ln(GVAC)
Results of the multiple linear regression indicated that there is a very strong collective significant effect between the SGDP, CREDIT, EXPORT, POWER, GDCF, OTAX, CAPEX, GVAC, and FDI Inflows in the Rajasthan State, (F (6, 12) = 5.77, p =.005, R = 0.74, R = 0.61).
The individual predictors were examined further and indicated that and CREDIT $(t = -1.833, p =.002)$ POWER $(t = 2.43, p =.032)$ and GCF $(t = -2.036, p =.034)$ and OTAX $(t = 2.147, p =.053)$ were significant predictors in the model, and SGDP $(t = 3.243, p =.007)$ and EXPORT $(t = -2.545, p =.026)$ were non-significant predictors in the model, as the two variables are dropped due to statistical error in the data.
The following independent variables are not significant as predictors for FDI inflows: Ln (EXPORT) and Ln (SGDP). Therefore, these variables are excluded from the model.
#### 2. Goodness of fit Overall regression
Right-tailed, $F = 5.769315$, $p$ -value $= 0.0049$ 5716. Since $p$ -value $< \alpha$ (0.05), we reject the null hypothesis. The linear regression model includes the error term $= b + bX + \ldots + bX + \varepsilon$, as it provides a better fit. The Y-intercept (b): two-tailed, $T = -2.503553$, $p$ -value $= 0.027734$. Hence $b$ is significantly different from zero.
#### 3. Validation
Residual normality: The analysis assumes normality for residual errors. Shapiro Wilk test is run and the p-value equals 0.3089. Hence it is assumed that the data is normally distributed.
Heteroskedasticity was corrected (Appendix 1) The White test p-value equals 0.906103 ( $F = 0.0992125$ ). we can reject the null hypothesis, which means that the variance is homogeneous.
Multicollinearity: Intercorrelations among the predictors (X) were checked and no multicollinearity concerns as all the VIF values are smaller than 2.5.
Augmented Dickey-Fuller unit root test is used to check whether unit root is present in the data. If the p-value is less than 0.05 then it indicates a unit root. ADF unit root test is run and the result shows that the null hypothesis is rejected. The t-value is greater than the p-value and we have statistical evidence to reject the null hypothesis. (Appendix 2), all the selected variables are free from unit root and the data is stationary.
Breusch-Godfrey test for first-order autocorrelation OLS, using observations 2004-2020 (T = 19) Autocorrelation, Durbin Watson test and (Appendix 6)
Priori power: The entire model (8 predictors): The priori power is estimated before we advance further in the regression analysis. Although the power to test the entire model is strong: 0.61361, and we can reject null hypothesis.
## V. HYPOTHESIS TESTED
On the basis of result of multiple linear regression analysis, it is found that four hypotheses are rejected and the remaining four are accepted. We can further explain that proxy variables of Government policy, infrastructural development,
<table><tr><td>Hypothesis</td><td>Result</td></tr><tr><td>H01: There is a significant relationship between the state GDP of Rajasthan and FDI inflows in Rajasthan.</td><td>Rejected</td></tr><tr><td>H02: There is a significant relationship between the Availability of Credit to the Industry and FDI inflow in Rajasthan.</td><td>ACCEPTED</td></tr><tr><td>H03: There is a significant relationship between the Availability of Power and FDI inflows in Rajasthan.</td><td>ACCEPTED</td></tr><tr><td>H04: There is a significant relationship between the state's Own Tax Revenue of Rajasthan and FDI inflows in the state.</td><td>ACCEPTED</td></tr><tr><td>H05: There is a significant relationship between the State Gross Capital Formation of Rajasthan and FDI inflows in the state.</td><td>ACCEPTED</td></tr><tr><td>H06: There is a significant relationship between capital expenditure and FDI inflows in Rajasthan.</td><td>Rejected</td></tr><tr><td>H07: There is a significant relationship between state Gross value addition by the construction sector of Rajasthan and FDI inflows in Rajasthan.</td><td>Rejected</td></tr><tr><td>H08: There is a significant relationship between Total Exports of Rajasthan and FDI inflows in the state.</td><td>Rejected</td></tr></table>
<table><tr><td>Hypothesis</td><td>Result</td></tr><tr><td>H01: There is a significant relationship between the state GDP of Rajasthan and FDI inflows in Rajasthan.</td><td>Rejected</td></tr><tr><td>H02: There is a significant relationship between the Availability of Credit to the Industry and FDI inflow in Rajasthan.</td><td>ACCEPTED</td></tr><tr><td>H03: There is a significant relationship between the Availability of Power and FDI inflows in Rajasthan.</td><td>ACCEPTED</td></tr><tr><td>H04: There is a significant relationship between the state's Own Tax Revenue of Rajasthan and FDI inflows in the state.</td><td>ACCEPTED</td></tr><tr><td>H05: There is a significant relationship between the State Gross Capital Formation of Rajasthan and FDI inflows in the state.</td><td>ACCEPTED</td></tr><tr><td>H06: There is a significant relationship between capital expenditure and FDI inflows in Rajasthan.</td><td>Rejected</td></tr><tr><td>H07: There is a significant relationship between state Gross value addition by the construction sector of Rajasthan and FDI inflows in Rajasthan.</td><td>Rejected</td></tr><tr><td>H08: There is a significant relationship between Total Exports of Rajasthan and FDI inflows in the state.</td><td>Rejected</td></tr></table>
### a) Result and Policy Implications
The multiple regression empirical results from model 1 show that FDI in Rajasthan state depends on
factors like Availability of Credit to the industries in the state, Gross Capital Formation which is net increase in the physical assets in the state (building flyovers, roads,
raising industries, Highways, electric capacity, infrastructure development etc.), Own Tax Revenues collected by the state shows its efficiency of implementing the rules and regulations and then its robust model of tax collection, Gross Value Addition by the Construction sector. The statistical value of State Gross Domestic Product and Total exports are found to be insignificant in model 1, hence both the variables are dropped from the study. The coefficient of multiple correlation (R) equals 0.861729. It means that there is a very strong correlation between the above determinants and the FDI inflows in the state.
We reject H01, H03, H06 and H08 as the selected variables are statistically not significant. Whereas H02, H04, H05 and H07 are accepted. We can conclude that the four determinants have a strong positive impact on FDI inflow in Rajasthan.
1. Government policy (Availability of credit to the industries)
2. Government efficiency
3. Investment climate and
4. Labour productivity has a strong positive impact on the FDI inflows in Rajasthan state.
It serves as advice and empirical evidence for the policymakers in Rajasthan and other laggard states of India to support these four sectors with policy matters and attract more FDI in the respective states. Apart from this, there are potential sectors of investment in Rajasthan such as renewable energy, the Food processing industry, the automobile industry, and the telecommunication industry. In a mission mode, an effective government can take advantage of its strategic location and connectivity, natural resource advantage and ease of doing business climate which can attract huge amounts of FDI inflows and can achieve overall prosperity with its spillover positive effects.
### b) Limitations of the study and future research directions
The present study was limited to the trend and patterns analysis of FDI inflows in Rajasthan. This is probably the first study of macroeconomic determinants of FDI inflow in laggard states of India. The study could be more effective if a primary data component is also added and micro factors are included in the study. FDI outflows have not been touched at all, the analysis of outflow could also provide significant literature FDI FDI-related studies. With a limited objective of the study and constrain of resources and time, some key factors could also be included in the study. Hence there is scope for future study in this topic, some suggested topics are listed below:
1. FDI and food processing sector in Rajasthan. Or any specific sector or industry growth can be taken along with FDI inflows.
2. FDI and per capita growth in Rajasthan. Relationship between Net per capita income and FDI inflows.
3. Trade balance and foreign investments; a statespecific study.
4. Balance of payments and FDI inflows: a regional perspective.
5. Investment patterns of FDI in selected sectors of a state.
$$
Appendix 1: Heteroskedasticity-corrected, using observations 2004-2020 (T = 17)
$$
Dependent variable: FDI
<table><tr><td></td><td>Coefficient</td><td>Std. Error</td><td>t-ratio</td><td>p-value</td><td></td></tr><tr><td>const</td><td>4382.10</td><td>1467.10</td><td>2.987</td><td>0.0174</td><td>**</td></tr><tr><td>SGDP</td><td>-0.804689</td><td>0.301242</td><td>-2.671</td><td>0.0283</td><td>**</td></tr><tr><td>CREDIT</td><td>0.0846466</td><td>0.0294466</td><td>2.875</td><td>0.0207</td><td>**</td></tr><tr><td>EXPORTS</td><td>0.0521218</td><td>0.0328846</td><td>1.585</td><td>0.1516</td><td></td></tr><tr><td>POWER</td><td>-2.80678</td><td>2.42558</td><td>-1.157</td><td>0.2806</td><td></td></tr><tr><td>GVAC</td><td>0.000526204</td><td>0.000202488</td><td>2.599</td><td>0.0317</td><td>**</td></tr><tr><td>GDCF</td><td>-0.00177953</td><td>0.000664923</td><td>-2.676</td><td>0.0281</td><td>**</td></tr><tr><td>OTAX</td><td>-0.0695812</td><td>0.0408829</td><td>-1.702</td><td>0.0272</td><td>*</td></tr><tr><td>CAPEX</td><td>-0.0991957</td><td>0.0376968</td><td>-2.631</td><td>0.0301</td><td>**</td></tr></table>
Statistics based on the weighted data:
<table><tr><td>Sum squared resid</td><td>10.50745</td><td></td><td>S.E. of regression</td><td>1.146050</td></tr><tr><td>R-squared</td><td>0.965710</td><td></td><td>Adjusted R-squared</td><td>0.931421</td></tr><tr><td>F(8, 8)</td><td>28.16329</td><td></td><td>P-value(F)</td><td>0.000045</td></tr><tr><td>Log-likelihood</td><td>-20.03236</td><td></td><td>Akaike criterion</td><td>58.06473</td></tr><tr><td>Schwarz criterion</td><td>65.56365</td><td></td><td>Hannan-Quinn</td><td>58.81013</td></tr><tr><td>rho</td><td>-0.500090</td><td></td><td>Durbin-Watson</td><td>2.698769</td></tr></table>
Statistics based on the original data:
<table><tr><td>Mean dependent var</td><td>950.3300</td><td></td><td>S.D. dependent var</td><td>967.5708</td></tr><tr><td>Sum squared resid</td><td>6717130</td><td></td><td>S.E. of regression</td><td>916.3194</td></tr></table>
Appendix 2: Correlation coefficients, using the observations 2004 - 2020
$$
5% critical value (two-tailed) = 0.4821 for n = 19
$$
<table><tr><td>FDI</td><td>CREDIT</td><td>EXPORTS</td><td>POWER</td><td>GVAC</td><td></td></tr><tr><td>1.0000</td><td>0.6098</td><td>0.7921</td><td>0.6589</td><td>0.5340</td><td>FDI</td></tr><tr><td></td><td>1.0000</td><td>0.7723</td><td>0.7220</td><td>0.5950</td><td>CREDIT</td></tr><tr><td></td><td></td><td>1.0000</td><td>0.9313</td><td>0.9084</td><td>EXPORTS</td></tr><tr><td></td><td></td><td></td><td>1.0000</td><td>0.9550</td><td>POWER</td></tr><tr><td></td><td></td><td></td><td></td><td>1.0000</td><td>GVAC</td></tr><tr><td></td><td>SGDP</td><td>GDCF</td><td>OTAX</td><td>CAPEX</td><td></td></tr><tr><td></td><td>0.5545</td><td>0.4032</td><td>0.5541</td><td>0.5058</td><td>FDI</td></tr><tr><td></td><td>0.8723</td><td>0.7421</td><td>0.6729</td><td>0.6753</td><td>CREDIT</td></tr><tr><td></td><td>0.9693</td><td>0.9063</td><td>0.9374</td><td>0.7391</td><td>EXPORTS</td></tr><tr><td></td><td>0.9172</td><td>0.8422</td><td>0.9738</td><td>0.7837</td><td>POWER</td></tr><tr><td></td><td>0.8535</td><td>0.7887</td><td>0.9618</td><td>0.8473</td><td>GVAS</td></tr><tr><td></td><td>1.0000</td><td>0.9184</td><td>0.8960</td><td>0.7419</td><td>SGDP</td></tr><tr><td></td><td></td><td>1.0000</td><td>0.8174</td><td>0.5873</td><td>GDCF</td></tr><tr><td></td><td></td><td></td><td>1.0000</td><td>0.7677</td><td>OTAX</td></tr><tr><td></td><td></td><td></td><td></td><td>1.0000</td><td>CAPEX</td></tr></table>
Appendix 3: Testing for a unit root in the selected variables Cointegrating regression
Augmented Dickey-Fuller regression
$$
OLS, using observations 2004-2020 (T = 19)
$$
$$
Cointegrating regression - OLS, using observations 2004-2020 (T = 19)
$$
Dependent variable: FDI
<table><tr><td colspan="2">coefficient</td><td>std. error</td><td>t-ratio</td><td>p -value</td></tr><tr><td>CREDIT</td><td>0.0547920</td><td>0.0358076</td><td>1.530</td><td>0.1603</td></tr><tr><td>EXPORTS</td><td>0.0220581</td><td>0.0831386</td><td>0.2653</td><td>0.7967</td></tr><tr><td>POWER</td><td>-0.727097</td><td>6.27394</td><td>-0.1159</td><td>0.9103</td></tr><tr><td>GVAC</td><td>0.000378278</td><td>0.000313546</td><td>1.206</td><td>0.2584</td></tr><tr><td>SGDP</td><td>-0.0200631</td><td>0.537998</td><td>-0.03729</td><td>0.9711</td></tr><tr><td>GDCF</td><td>-0.00209627</td><td>0.00125821</td><td>-1.666</td><td>0.1301</td></tr><tr><td>OTAX</td><td>-0.0558154</td><td>0.0629074</td><td>-0.8873</td><td>0.3980</td></tr><tr><td>CAPEX</td><td>-0.0788806</td><td>0.0580361</td><td>-1.359</td><td>0.2072</td></tr></table>
$$
Appendix 4: OLS, using observations 2004-2020 (T = 19)
$$
<table><tr><td colspan="2">coefficient</td><td>std. error</td><td>t-ratio</td><td>p-value</td></tr><tr><td>CREDIT</td><td>0.0547920</td><td>0.0358076</td><td>1.530</td><td>0.01603</td></tr><tr><td>EXPORTS</td><td>0.0220581</td><td>0.0831386</td><td>0.2653</td><td>0.007967</td></tr><tr><td>POWER</td><td>-0.727097</td><td>6.27394</td><td>-0.1159</td><td>0.0103</td></tr><tr><td>GVAC</td><td>0.000378278</td><td>0.000313546</td><td>1.206</td><td>0.02584</td></tr><tr><td>GSDP</td><td>-0.0200631</td><td>0.537998</td><td>-0.03729</td><td>0.019711</td></tr><tr><td>GDCF</td><td>-0.00209627</td><td>0.00125821</td><td>-1.666</td><td>0.130101</td></tr><tr><td>OTAX</td><td>-0.0558154</td><td>0.0629074</td><td>-0.8873</td><td>0.003980</td></tr><tr><td>CAPEX</td><td>-0.0788806</td><td>0.0580361</td><td>-1.359</td><td>0.02072</td></tr></table>
Appendix 5: Breusch-Godfrey test for first-order autocorrelation OLS, using observations 2004-2022 (T = 19)
Dependent variable: FDI
<table><tr><td colspan="2">coefficient</td><td>std. error</td><td>t-ratio</td><td>p-value</td></tr><tr><td>const</td><td>4244.12</td><td>5136.88</td><td>0.8262</td><td>0.04359 *</td></tr><tr><td>CREDIT</td><td>0.0257692</td><td>0.0387668</td><td>0.6647</td><td>0.05275 *</td></tr><tr><td>EXPORTS</td><td>0.0400469</td><td>0.0805196</td><td>0.4974</td><td>0.06342</td></tr><tr><td>POWER</td><td>0.288279</td><td>5.29419</td><td>0.05445</td><td>0.09581</td></tr><tr><td>GVAS</td><td>8.33669e-05</td><td>0.000265482</td><td>0.3140</td><td>0.03627 *</td></tr><tr><td>FACTORY</td><td>-0.942584</td><td>1.07083</td><td>-0.8802</td><td>0.04079 *</td></tr><tr><td>GDCF</td><td>0.000686437</td><td>0.00113925</td><td>0.6025</td><td>0.05658 *</td></tr><tr><td>OTAX</td><td>-0.0170064</td><td>0.0528691</td><td>-0.3217</td><td>0.01571 *</td></tr><tr><td>CAPEX</td><td>-0.0320662</td><td>0.0504949</td><td>-0.6350</td><td>0.05456 *</td></tr><tr><td>what_1</td><td>-0.852218</td><td>0.384817</td><td>-2.215</td><td>0.0624 *</td></tr></table>
#### Appendix 6:
Durbin-Watson 2.3960815145580
Johansen test:
Number of equations $= 9$
Lag order $= 1$
$$
Estimation period: 2004 - 2022 (T = 19)
$$
Cointegration tests, ignoring exogenous variables
<table><tr><td>Rank</td><td>Eigenvalue</td><td>Trace test p-value</td><td>Lmax test p-value</td></tr><tr><td>0</td><td>1.0000</td><td>2363.0 [0.0000]</td><td>576.70 [0.0000]</td></tr><tr><td>1</td><td>1.0000</td><td>1786.3 [0.0000]</td><td>565.61 [0.0000]</td></tr><tr><td>2</td><td>1.0000</td><td>1220.7 [0.0000]</td><td>559.12 [0.0000]</td></tr><tr><td>3</td><td>1.0000</td><td>661.61 [0.0000]</td><td>550.95 [0.0000]</td></tr><tr><td>4</td><td>0.96053</td><td>110.66 [0.0000]</td><td>51.714 [0.0000]</td></tr><tr><td>5</td><td>0.87158</td><td>58.951 [0.0027]</td><td>32.839 [0.0073]</td></tr><tr><td>6</td><td>0.64727</td><td>26.111 [0.1289]</td><td>16.673 [0.1953]</td></tr><tr><td>7</td><td>0.41364</td><td>9.4385 [0.3324]</td><td>8.5412 [0.3339]</td></tr><tr><td>8</td><td>0.054542</td><td>0.89737 [0.3435]</td><td>0.89737 [0.3435]</td></tr></table>
Generating HTML Viewer...
References
25 Cites in Article
Joysri Acharyya (2015). FDI and Regional Disparity in India.
Dr. Mukherjee (2014). Econometric Analysis of the Impact of Fdi on Retail Trade in India.
B Lal,A (1996). Need for EDPs in Rajasthan: Some Reflections.
J Bhandari,M Rahul,S Tiwari (2015). Regional economic imbalances: business and foreign direct investment in India.
A Bhave (1995). JPAM Doctoral dissertation listing 2009.
A Chhina (2023). Regional Distribution of Foreign Direct Investment in India.
S Gupta,B Satpathy,S Baral,M Shahi,P Jain Role Of Fdi On Infrastructure Development: An Emerging Study On Rajasthan State Of India.
P Kalyani,L Arora (2014). Contemporary Trends and Challenges in Commerce, Economics & Management.
Vinish Kathuria,Pradeep Ray,Rekha Bhangaonkar (2015). FDI (foreign direct investment) in wind energy sector in India: Testing the effectiveness of state policies using panel data.
D Keshava (1920). A Study on Regional Inequality in FDI Inflows into the Indian States.
Ramani Kumar,Pranab Banerjee (1996). Role of States in Export Promotion Efforts.
V Kumar (2010). Special Economic Zone's in Rajasthan-As A Tool of Regional Development.
T Maini India and Foreign Direct Investments: The Need for Strong Internal Synergies.
Tushar Panigrahi,Rabi Patra,Sanjay Satapathy (2015). Distribution of Foreign Direct Investment in Indian Regions: A Trend Analysis.
M Pawar,R Nikhade,Analytical Unknown Title.
Nita Rudra,Meir Alkon,Siddharth Joshi (2018). FDI, Poverty, and the Politics of Potable Water Access.
P Saxena,Ethics,Innovation Unknown Title.
P Sharma,R Sharma (2014). Special economic zones in Rajasthan: A study of gems and jewellery segment in Jaipur.
A Shekhawat (2018). Investment Environment in Rajasthan: Trends and Issues.
K Siddiqui (2010). Globalisation and neo-liberal economic reforms in India: A c.
T Singh Maini (2016). FDI in India: Do New Delhi and state governments need to re-think strategies?.
Shweta Singh,Dr. Hoque (2020). AN ANALYSIS OF TREND, PATTERN AND STRENGTH OF FOREIGN DIRECT INVESTMENT (FDI) AND FOREIGN INSTITUTIONAL INVESTMENT (FII) TO INDIA..
R Singh (2016). Foreign direct investment and regional disparities in post-reform India.
S Singh (2007). Industrialisation in Rajasthan Process and Pattern.
J Toor,H Matharu,A Vyas (2015). An analytical study of FDI in India.
Explore published articles in an immersive Augmented Reality environment. Our platform converts research papers into interactive 3D books, allowing readers to view and interact with content using AR and VR compatible devices.
Your published article is automatically converted into a realistic 3D book. Flip through pages and read research papers in a more engaging and interactive format.
Rajasthan, a land of promises has received ₹ 1549.10 crore FDI inflows in 2019-20 and ₹ 6259.48 crore in 2022-23 which is about a 304 per cent increase in FDI inflows in the last four years. FDI inflows have grown at a Compound Annual Growth Rate (CAGR) of 33.23 percent in Rajasthan in the post-liberalization period in India. While the states are competing to attract more FDI inflows organize investor’s summit and initiate policy reforms to facilitate investment opportunities in their region. This study aims to analyse determinants of FDI inflow in Rajasthan state which is a land-locked state with an abundance of natural resources and skilled manpower. Foreign Direct Investment (FDI) a non-debt-creating capital inflow stimulates employment generation, and fills the gap between domestic saving and investment. It is found that there is a direct relation between FDI inflows and the Gross Domestic Product growth of the host state.
Our website is actively being updated, and changes may occur frequently. Please clear your browser cache if needed. For feedback or error reporting, please email [email protected]
Thank you for connecting with us. We will respond to you shortly.