
I. INTRODUCTION
Electromigration is a phenomenon that has been around for almost a century. This concept will happen on an interconnect line segment that is under Constant use. These interconnect lines are the ones that transport supply voltage (Vcc) to the chip. Electrons will become material carriers and transport material to one end of the line causing hillocks/ fringes, with nucleation voids at another end. With the gigantic scaling down of VLSI circuits, the anxiety of electromigration will grow due to an increase in current density. This electromigration is caused by the internal gap or defect in the wire. The contact or via may break or become a short circuit to another layer of wire. Power and ground networks are very prone to electromigration because of unidirectional current compare to regular signal wires that carry bidirectional currents. Besides, average current density, the rate of electromigration depends on the temperature, the crystal structure, grain transport properties of the conducting materials.
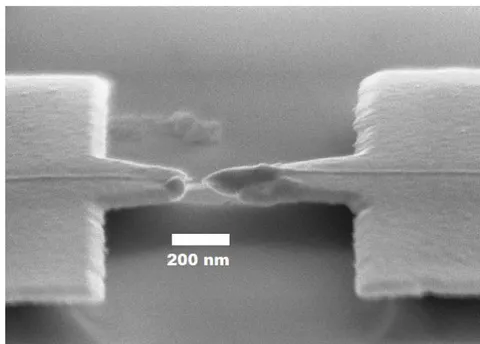
The circuit designer can only effectively control current density. Therefore, keeping the current density within limit is essential to prevent electromigration. The concept of electromigration shows in Figure 1. This paper will show a history of the findings of electromigration. This is an investigative work to find what factors must need to change in order to have a better electromigration performance and reliability of Black's equation with the nanoscale technologies.
II. PREVIOUS RESEARCH WORK ON ELECTROMIGRATION
Starting with 1967 when interconnect lines were made of aluminum. The first person who developed a mathematical model for predicting electromigration was J.R. Black while he worked for Motorola. Black studied the effects of electromigration on different aluminum strips. Black tested these strips using accelerated temperature testing. This method of testing was putting the aluminum strips under a constant temperature and a range of current densities [1, 2]. Black's equation is the current density squared along with the equation for mass transport. Black's initial model is as follows on equation (1)
where MTF is the median time to failure, A is a constant that reflects the cross-sectional area of the film along with many other factors such as, the volume resistivity of the metal, the electro-free time between collisions or the electron free path and average velocity, ionic scattering cross section for electrons, the self-diffusion frequency factor of aluminum in aluminum materials, and a factor relating rate of mass transport of MTF, is the current density, is the activation energy, is Boltzmann's constant and is temperature. He confirmed that the relationship of current density by performing experiments with current density ranges are larger than 5:1. It is determined that the activation energy was dependent upon the overall structure of the film. For example, his experiments were carried out with 3 different crystallite films. For small crystallite films (1.2 ), the activation energy was.48, and for large crystallite films (8 ) it was 0.84. Black's experiments done at a constant temperature of 235°C, and a current density of 1.3 X 10 A/cm for a period of 230 hours. This experiment taken more time than normal time for the process of electromigration to occur. Black found voids at the positive ends of resistor contact points along with hillocks and fringes that happening at the negative regions which shows a transport of material. It concluded with the experimental data which was showing voids and hillocks in addition to providing charts of functions between current and temperature [1, 2, 3].
In 1971, Blair made changes to Black's equation [4]. Blair made changes to Black's equation by having a scaled factor of for current density instead of having the current density scale by a factor of 2 which shown in equation (2).
This change made because Blair and Hartman found that MTF depends on the divergence of atomic flux which determined by the product of the current density and a constant temperature for a set amount of time. The value of n was considered to be in between 1 and 2.
The value of n has been a abundant controversy. Was it 1, 1.5, or upwards to 20? Many papers indicated their findings of what n should be. Shatzkes and Lloyd showed that there is a discrepancy in how n is evaluated [12]. In 1986, as IC lines were getting smaller, aluminum was found to have flaws with maintaining a high resistivity and thermal capability to be under pressure for a long lifetime. Developers started to dope the aluminum connecting lines with copper. Copper had a higher resistivity and shown to prolong the lifetime of an interconnect line which revealed that it increases in electromigration performance. M. Shatzkes and J.R Lloyd have found that there were errors in (2).
More specifically, how the value of n found in the original model due not to consider Joule heating, which could scale the exponent to a higher value than 2. Also, Joule heating becomes a temperature gradient induced flux divergence which shown in their model in equation (3).
The value B found with another model that shown in (4)
Where is a critical value that represents the vacancy concentration, is a pre-exponential factor for grain-Boundary self-diffusivity, is effective charge of magnitude and direction in momentum exchange between a conducting electron and diffusing metal atoms, is the material's resistivity, is the mass of an electron. Shatzkes and Lloyd then found the activation energy that calculated higher than the one anticipated with equation (1). The value of n determined to be closer to 2 after experimental data using in both equations. Shatzkes and Lloyd proposed that the activation energy with the added value produced MTF values that were as good or better with their data [12].
A paper was done by M.L Dreyer, K.Y. Fu, and C. J Varker, introduced a new contribution to the calculations on diffusion components for mass transport [7]. In particular, how line widths compared to the median grain size affected the MTF value. Providing models that considered the grain boundary and lattice components of diffusion. This paper's purpose is not to cover their mathematical formula, but more so highlight that if a line width is better than the median grain size will produce a longer lifetime. By providing experimental data, in fact, a line width depends on the electromigration activation energy, along with temperature change.
In 1997, aluminum interconnects were beginning to become hard to come by copper. Copper found to be a better material due to a higher resistivity and having a much better-conducting metal. Copper and aluminum are both prone to electromigration. But copper has a much better electromigration performance, so IC's with copper interconnect lines will have a longer lifetime. Copper is also able to be layered upon itself giving more functionality to an IC. Even though electromigration happens in both copper and aluminum, they have different properties which reflect the way of electromigration which will arise [13]. Aluminum that undergoes electromigration will have something called triple points. Triple points are points where three aluminum crystals meet together. When voids happen, two (2) of these points will become material current carriers that leaving a hole behind, and one of those points will also be a material current carrier that will bring in material, but there is a discrepancy. On the other side of the line where hillocks occur, the opposite happens. Two current carriers are bringing material in, with one current carrier taking material away. In copper, electromigration will occur by boundaries of an interconnect line where found either via connect on right side or via above through in the transmission line.
In 2003, K. N. Tu did a study on electromigration in aluminum, copper, and solder joints and compared the different electromigration effects on their operating temperature of 100 °C [5]. He analyzed on MTF, separating into current density, activation energy, and how void nucleation/ hillocks effect on cathodes. Their experiments showed how "low-k copper interconnects" have a severe problem of electromigration happening at small current densities due to current crowding. This is because of the current density gradient that acting like a normal current flow. For MTF, the time taken for a void to appear is more significant in aluminum interconnects because of the way it structured and copper had electromigration happening at surfaces [8].
In 2007, Cher Ming Tan, Yuejin Hou, and Wei Li revisited black's equation to model for narrow interconnects. They proposed a new driving force formula which considered three different stress with induced migrations. The first being electron-wind forced migration, temperature gradient induced migration and stressed induced electromigration. The most important part of this paper for our purpose is a change in the interconnecting line circuit. They were able to calculate a critical reservoir length that reduced the probability of a precarious electromigration void. The reservoir is an extension on the interconnect line that goes pass through the via. This is to allow a distribution of stress on the line [9].
In 2008, Armin H. Fischer and Alexander von Glasow showed the different electromigration failure in copper interconnect. The categorized them in an early failure and late failure. Early failure was indicating that the void has grown underneath the via, causing a disconnect. Late failure specifies that a void has developed within the transmission line or in their words "trench-voiding" which happens just above the via. They then took multiple samples with a pre-cleaning, which is a SiN layer added to copper. They found that the pre-cleaning showed that early mode has a small slit-like a void that appears, then the late failure mode shows a larger void. The early failure mode in comparison to MTF had an n value of 1.1, and the late failure mode had an n value of 1.5 as more current in a smaller area of the wire [10].
In 2017, the most recent study of all previous works focused on nanoscale devices and what factors needed to consider for electromigration modeling. They provided a model that would show how dominant the grain boundaries and material interfaces effected on electromigration. They used TiN with copper grains that are for via connections. The scattering effect is showing by providing a lot of models for current density traveling through interconnecting lines.
When grain boundaries considered, the lifetime of an IC changed by a factor of 5. This show that grain boundaries need to consider when dealing with nanoscale cross-sectional areas in interconnecting circuits. Different material interfaces need to be considered for the different scattering effects when current is applied. Current scatter and crowding will be the ultimate downfall of a nanoscale IC if grain boundaries and material interfaces did not put into consideration into the MTF equation [11].
III. SIMULATION RESULTS AND ANALYSIS
The simulations are done using MATLAB software. The following simulations has show an array of how different variables effect on both in equation (1) and equation (2). In equation (1), the following equation (5) used which taken from Black's experiment.
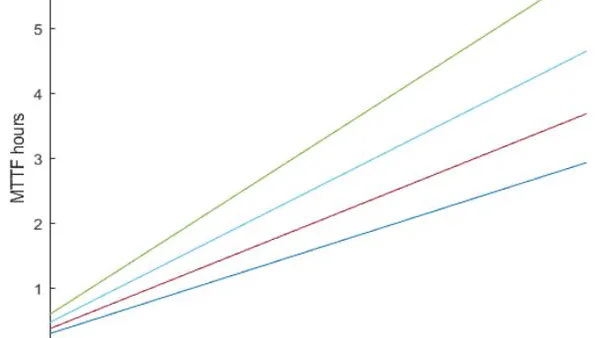
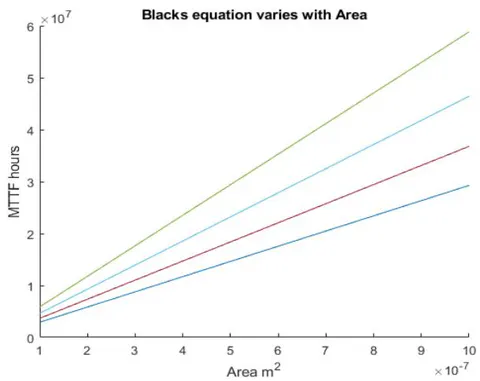
Where ww indicating the width of the line, and tt indicating the thickness. These were scaled by having the area. The multiplication of both width and thickness show the behavior of MTF with a change in an area which is seen from Figure 2. Information from each line in figure 2 represents a change in temperature. With the top utmost line being at C, each line is showing a change in 3 degrees up to C. This alone proves along with equation (5) that the electromigration depends on temperature. With a higher temperature, the lower value of MTF is acquired, and thus having a lower lifetime estimation. Figure 2 also shows that the change in cross-sectional area is a large factor in MTF estimation. A larger area will give a longer lifetime due to more material that must be taken away by current carriers. Given that equation (5) derived by using aluminum strips of a large crystallite structure of . The properties of how temperature and area effect, the estimation are the same. It is also important to note that the activation energy was a constant given those parameters for aluminum strips. A standard current density is used as a constant for this simulation as well (J = 2 x 10⁵).
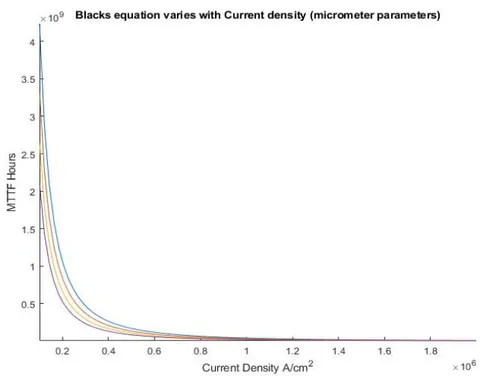
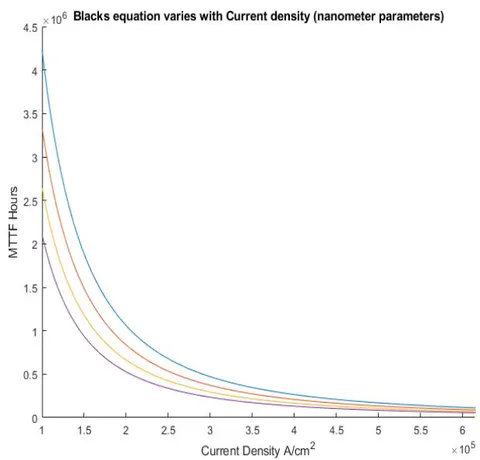
The next parameter is in equation (5) that is current density. Simulation is done with both micrometer parameters and nanometer parameters to see if there were any differences. A hypothesis made that the increased amount of current density will have a negative effect on MTF due to current crowding and having a natural increase in temperature. Figure 3 and Figure 4 show that when the current density increased, the MTF reduced drastically. A change in parameters with the area indicates that the MTF will change by a factor of 103 since the formation modeled with equation (5). Temperature is also not as a prominent changing factor in how current density behaves, yet, still follows the same property that temperature has a dependence on MTF. The lower the current density is, the better lifetime an interconnect line will have. Note that when Figure 3 and Figure 4 done, a cross-sectional area had two estimated constants of 180 m and 180 nm respectively. The same temperature constants used as represented in Figure 2.
As mentioned in the previous works section, the value of n was the center of controversy for a long time.
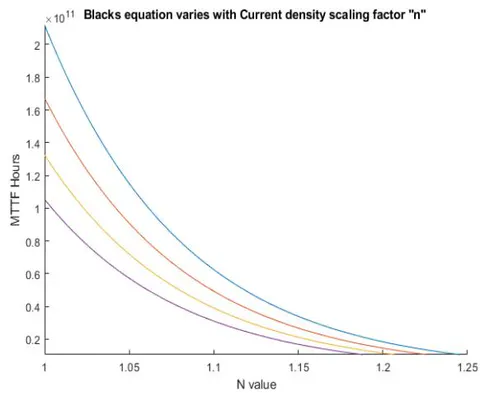
Figure 5 will show how the value of n changes with the behavior of MTF. The data from Figure 5 shows that the value of n is a critical value as well. Figure 5 shows the value of n between 1 and 1.25. MTF had a change of . When this data scaled from 1 to 2, the lines are not able to read because of the drastic change in MTF.
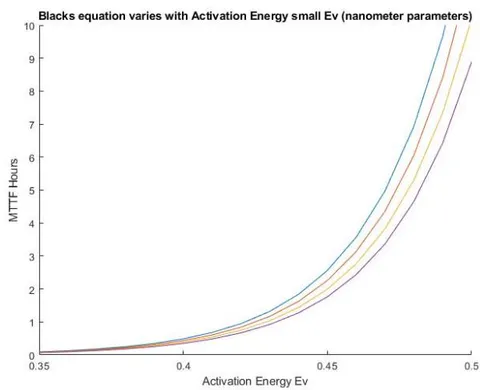
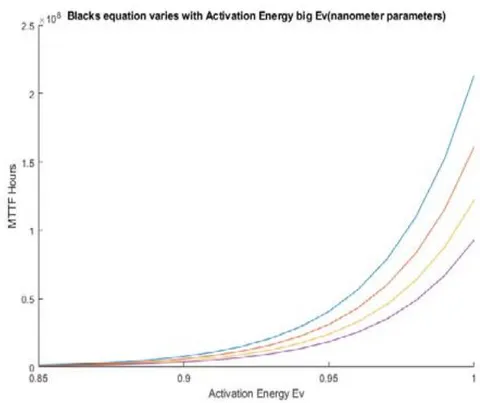
The next two figures (Figure 6 and Figure 7) will show a change in MTF with the activation energy variation. Using standard parameters for the cross-sectional area and the scaling factor of current density is 2. Figure 6 shows something more interesting finding. Lower activation energies show an extremely small number for MTF. The activation energy usually found experimentally and it varies from each interconnecting line. Activation energy is the amount of energy that needed for electromigration to begin. Many papers suggest that the activation energy isn't just one value, but a value that changes depending on grain barriers. This simulation was to show the behavior of how the activation energy behaves with the value of MTF. Figure 7 shows a higher activation energy (up to 1) will have an extreme change to MTF. This change happens exponentially. Higher values of an activation energy raises the MTF upwards to 2x10⁸. Values between 6 – 1 will give us a more practical MTF estimation. Knowing this it makes sense that activation energies tend to be in that range depending on what material is used.
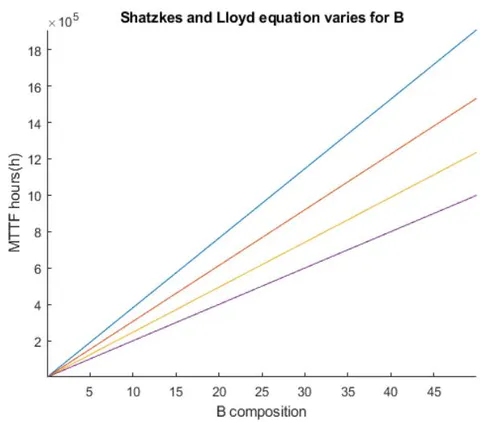
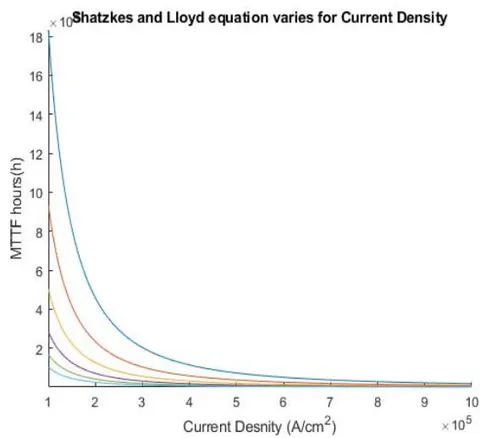
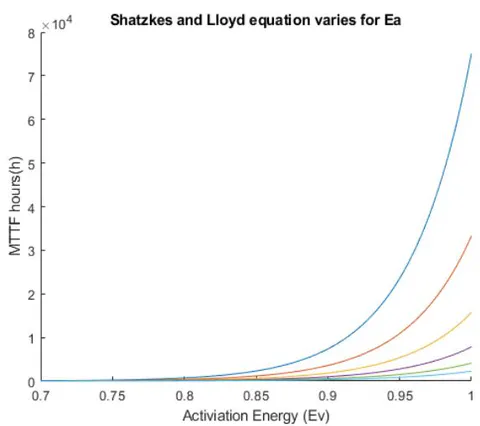
Next there are simulations done using equation (3). These followed the same principles of equation (5), and that's with constants being used to show how one variable behaves in the formula. Thus, providing its impact on how MTF evaluated. Figure 8 shows that temperature is still a dependence on MTF. The constants used in the Black equation simulations are the same. With a rise in B's composition, there is a rise in MTF. Figure 9 and 10 show similar characteristics to their respective graphs (Figures 3 and 7). Current density and activation behave the same due to no modification with those parts in (3). Having a low current density will help overall MTF, and a higher activation energy will delay the inevitable electromigration from starting.
Table 1 shows a comparison between equation (1) and equation (3) with the same parameters, and their estimations for MTF with different temperature changes. Changes in temperature are crucial for representing a difference because of the T2 in equation (3). This proves that the changes made in equation (3) is to improve the accuracy of MTF. This also provide a better estimation so equation (1) is much more underestimating technically.
| Temperature (K) | MTF from (1) | MTF from (3) |
| 550 | 2350 | 2500 |
| 560 | 1712 | 1825 |
| 570 | 1262 | 1360 |
| 580 | 939.6 | 1075 |
| 590 | 706.7 | 880.4 |
| 600 | 536.6 | 642.2 |
IV. CONCLUSION
This is an investigative work that discuss various process and parameters including temperature impacts on electromigration. This work will give a good idea about electromigration while people will study the electromigration. Although it has to take into account that a lot more parameters other than cross sectional area and temperature involves to analyze the electromigration. Critical grain boundary values need to found. Since VLSI circuits are becoming more and more power demanding and circuits are becoming smaller to support additional functionality in the nanoscale domain, the threat of electromigration continues to grow. This study is done to find what parts of electromigration can be improved in the nano scale domain. Over the course of 50 years, IC's are primarily aluminum and moved on to copper after finding the better electrical and material properties. With different metals, various electromigration could occur. In order to help a small nanoscale copper circuits, a reservoir length is added to a TiN via that are implemented. Simulation work done is to show that temperature has a direct relation on the Mean Time to Failure value. Reducing the temperature for an integrated circuit will improve overall performance. A change is done to Black's equation that is validated to show a better estimation of MTF. The area of electromigration is still being heavily studied in VLSI design and Physics. Refining the equation for MTF is crucial to know the lifetime of an IC in the nanoscale domain.