## I. INTRODUCTION
Carbon dioxide $\left(\mathrm{CO}_{2}\right)$ is a trace gas in the atmosphere $(\approx 0.04\%)$ which primarily comes from natural processes such as volcanic eruptions, forest fires, decayed organic matter etc. Its continuous emissions have increased largely as a result of unstoppable anthropogenic activities such as burning of fossil fuels, deforestation and energy consumption leading to increase in its concentration and eventually result to global warming across the nations of the world (IPCC 2001; IPCC 2006; Dietz et al., 2009; Rahaman et al., 2011; Van Den Hende et al., 2012; Cheah et al., 2014; Wilbanks and Fernandez, 2014). The concentration of atmospheric $\mathrm{CO}_{2}$ has increased to an annual average of 407 ppm reported for 2018 (NOAA, 2019).
Transport and distribution of such emissions to short-and long-range distances, therefore depend on the prevailing atmospheric conditions at any location on the surface of the earth (Ncicha et al., 2020). Turbulent transport of a major greenhouse gas such as $\mathrm{CO}_{2}$ both on spatial and temporal scales determines to a large extent, its mixing and distribution to various parts of the environment where it can be utilized (Smallman et al., 2014; Liu et al., 2017; Zhao et al., 2018). Its distribution in turn determines and influences the climatic conditions which directly or indirectly affect organisms inhabiting in such environment (IPCC, 2007; Stoy et al., 2009; Jung et al., 2011; Vasumathi et al., 2017). Many Organisms on land, in the sea or in the atmosphere survive much better in weather-friendly environments than they do in harsh environmental conditions. Existence and survival of such organisms, particularly photo autotrophstherefore depend solely on availability and distribution of $\mathrm{CO}_{2}$ for the regulation of plants' metabolic activities as well as the environment which they rely on for survival (Houghton, 2000; Malhi and Grace, 2000; Bubier et al., 2003; Canadell et al., 2007; IPCC, 2007; Lindroth et al., 2007; Nithiya et al., 2017).
Studies have been conducted in the temperate region, both in the rural and urban are as to check the alarming rate of production, transport and distribution of $\mathrm{CO}_{2}$ emissions as it contributes immensely to global warming and measures are being put in place to check it, but little efforts have been made so far in the tropics in ensuring safety of lives from the effects of the menace which are posed on the important creatures in the region (van Gorsel et al., 2007; Schimel et al., 2008, Kosugi et al., 2008; van Gorsel et al., 2009; Rebmann et al., 2009; Hernández-Paniagua et al., 2015). This is due to the absence of meteorological/FLUXNET stations dedicated to measuring accurate and consistent flux exchanges of mass of $\mathrm{CO}_{2}$, water vapour and energy between the biosphere and the atmosphere (Baldocchi et al., 2001; Baldocchi, 2008; Novick et al., 2017; Villa et al., 2019). Moreover, the circumstance is attributed to non-availability/inadequacy of measuring devices for mass and energy fluxes, prohibitive costs of procurement of the devices and low expertise in the analysis of such fluxes data (Chiemeka, 2008; Ayoola et al., 2014; Soneye et al., 2019; Ajao et al., 2020). An integrative approach to measure $\mathrm{CO}_{2}$ in vertical and horizontal soil profiles over a semiarid ecosystem at a shrubland plateau in southeast Spain by Sánchez-Cañete et al. (2016) showed that wind increased $\mathrm{CO}_{2}$
concentration underneath plant soil and induced its depletion on bare soil. The study further revealed that wind is capable of inducing $\mathrm{CO}_{2}$ transport in the surface soil and bedrock but not in subsurface. Temporal variability of carbon dioxide fluxes investigated in the city center of Arnhem, Netherlands by Kleingeld et al. (2018) revealed that $\mathrm{CO}_{2}$ emissions from space heating dominated winter period while emissions from traffic dominated summer period in the area. A study on seasonal and diurnal variation of $\mathrm{CO}_{2}$ in a mountainous area in Seoul, South Korea investigated by Ghosh et al. (2010) showed that many meteorological variables exhibited inverse correlation with $\mathrm{CO}_{2}$ concentration but wind speed and direction are found to have less impact on the concentration in the area. Continuous measurements of $\mathrm{CO}_{2}$ fluxes at the former radio tower in Beromünster, Switzerland by Satar et al. (2016) showed that $\mathrm{CO}_{2}$ mixing ratios decreased with sunrise due to its uptake by plants for photosynthesis, and disappearance of nocturnal boundary layer as the conditions became unstable while the mixing ratio increases when convective activity ceases resulting in surface cooling. The study further revealed that $\mathrm{CO}_{2}$ seasonal variation could be associated with biological activity in the area. Eddy covariance measurements of mass flux of $\mathrm{CO}_{2}$ and its concentration over a leguminous plant (Cowpea) at an agricultural site in Ile-Ife, Nigeria by Ajao and Jegede (2019) identified photo synthetically active radiation (PAR) among other atmospheric variables as the dominant factor regulating $\mathrm{CO}_{2}$ exchange at the site, particularly during the day. This paper investigates diurnal variation of wind speed and direction, and $\mathrm{CO}_{2}$ flux with its associated concentration over a grass-covered surface at an agricultural site located on the campus of Obafemi Awolowo University, Ile-Ife, Nigeria. The primary objective of the study is to establish whether there is a significant correlation between wind velocity and fluxes of $\mathrm{CO}_{2}$ with its associated concentrations in the area.
## II. MATERIALS AND METHOD
### a) Site description
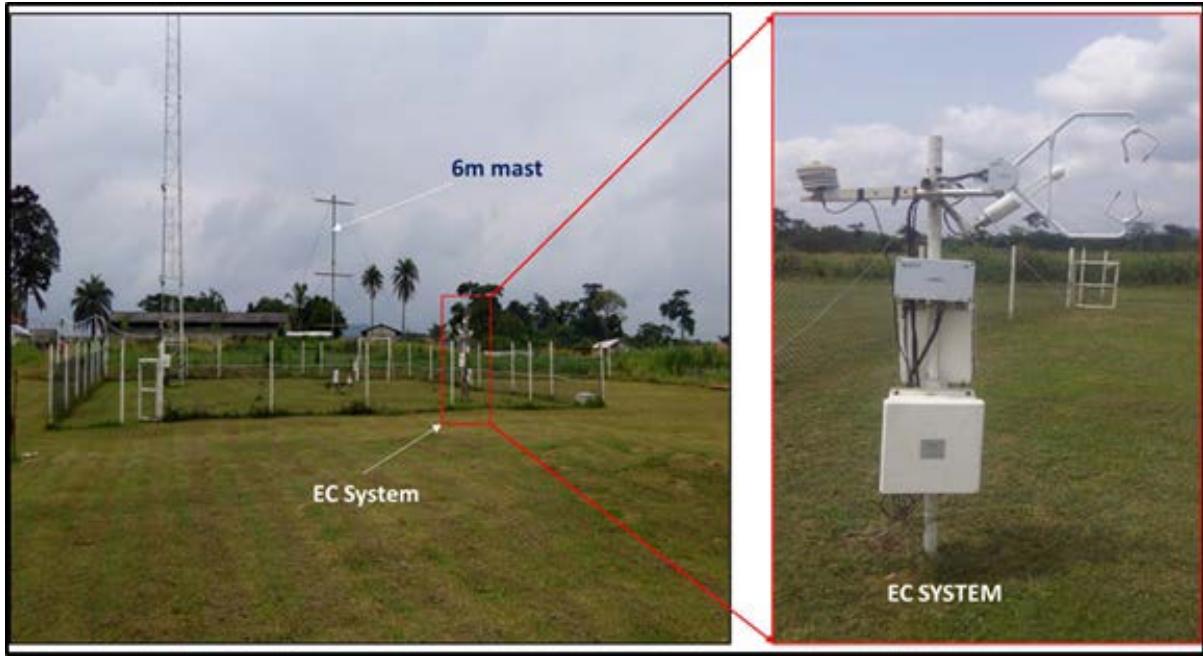
The experimental site (OAU Met-station), shown in the Fig. 1, is situated within the Teaching and Research Farm of Obafemi Awolowo University (TRF-OAU) in Ile-Ife, southwest Nigeria $(7.52^{\circ}\mathrm{N};4.52^{\circ}\mathrm{E};298\mathrm{m}$ a.m.s.l). The research farm is $7\mathrm{km}$ in the northeastern direction from the main campus, and covers about 5 hectares. It is surrounded by low hills to the eastern and southern part of the campus. It is located in the tropical rainforest zone and characterized by two major alternating seasons which are wet and dry respectively. The wet season spans from April to October while the dry season comprises December, January and February. March and November are referred to as transition months. The former is the transition from dry- to-wet season while the latter is from wet-to-dry season. The annual precipitation for Ile-lfe is between 1000 and $1500~\mathrm{mm}$. The soil type in the area is sandy-clay-loamy from the top to the bottom $(0 - 0.1\mathrm{m})$. Portions of the farmland are planted with food crops of different kinds cultivated by research students and staff of the Faculty of Agriculture. A few scattered trees including palm trees are also planted. Some portions are allotted as project sites to the International Institute of Tropical Agriculture (I.
I. T. A.) and Institute of Agricultural Research and Training (I. A. R & T) for yearly planting of maize and other arable crops. Offices for staff members and other facility buildings (stores and warehouses)are available at the farm site. There are also lecture theatres for the use of students in their final year, where lectures, seminars and other academic activities apart from farm work are observed. The experimental site is a clear open field and it appears relatively homogeneous. The surface is grass-covered and mown once every two weeks to ensure homogeneous conditions (see Fig. 2). Additionally, in a bid to ensure constant fetch, particularly for a measurement of this nature, the site is situated in a secure and an undisturbed location that is distant away from the farm center and forested region within the farm to prevent any obstruction to surface flow. The mean surface wind at the site is low and the direction is almost constant throughout the year. As such, the flux footprint does not really change over time as a result of almost constant frequency distribution of wind in the area. Meteorological facilities were installed within the experimental site which is 18 square meters in area. The area was fenced using open-wire net to prevent any unnecessary intrusion, especially by rodents from destroying the sensors' cables. Aside electricity supply to the site, alternative power supplies from a 2.5 KVA inverter and a 6.5 KW gasoline-engine generator were made available to ensure constant running of the meteorological station. From 2004 to date, the meteorological station (OAU Met-station) is maintained by members of the Atmospheric Physics Research Group (APRG) at the department of Physics and Engineering of Obafemi Awolowo University, Ile-lfe, Nigeria.
# b) Eddy Covariance
Eddy covariance (EC) technique was employed to acquire turbulent flux data in this study as it allows direct, continuous, long-term and local-scale measurement of land-surface atmosphere flux exchanges of mass $(\mathrm{CO}_{2})$, momentum and energy on spatial and temporal scales respectively by deriving the covariance between the vertical wind speed and the mixing ratios of other flux parameters (Aubinet et al., 2000; Baldocchi, 2003; Järvi et al., 2012; Kotthaus and Grimmond, 2012; Liu et al., 2012, 2014; Christen, 2014; Weissert et al., 2014; Goulden et al., 2006; Hong et al.,
2008). The instrumentation at the study site comprises: a three-dimensional ultra-sonic anemometer (CSAT3; Campbell Scientific Inc. Logan, Utah, USA) to measure high frequency wind velocity components (i.e., $u$, $v$, and $w$ ) and an open path infrared gas analyzer (LI 7500; LiCor Inc., Lincoln, Nebraska, USA) to measure high frequency signals of water vapor density and $\mathrm{CO}_{2}$ flux. The EC system set up shown in the Fig. 2 was mounted at $1.8 \, \text{m}$ on a $2.2 \, \text{m}$ tall mast above the ground surface (a.g.l). Incorporated in the EC system was a temperature-humidity probe (Vaisala HMP60; Campbell Scientific Inc. Logan, Utah, USA) to measure air temperature and relative humidity respectively at the site. Turbulent fluxes of mass $(\mathrm{CO}_{2})$, momentum and energy were recorded at a sampling rate of $10 \, \text{Hz}$ and averaged over 30 mins periods by the EC system. The raw dataset was subjected to Quality Assurance and Quality Control (QA/QC) protocol. Stationarity test was performed on the data following the procedure by Foken and Wichura (1996). All turbulent fluxes were computed using Loggernet software and reduced to 30-min averages for the purpose of analysis. The data acquisition software (DAS) from Campbell Scientific Inc. (Campbell Scientific 2010) contains flags which identify and remove spurious/bad data values. Incorporated in the software are the Webb-Pearman-Leuning correction, frequency response correction, crosswind contamination correction, correction for cosine response and others. Additionally, cases of missing data values of fluxes and concentrations of $\mathrm{CO}_{2}$ and other turbulent parameters constituted less than $2\%$ of the overall datasets and as such, no serious data jumps were observed in the whole time series (Ajao et al., 2020). Interpolation approach was used where necessary to fill the limited missing data points which were observed in the datasets. Two Campbell Scientific programmable data loggers (model CR1000) were used to retrieve data from the sensors, and downloading of data was done twice a week via USB-to-Serial cable connection to a dedicated laptop computer. The downloaded data were subsequently transferred to a desktop computer for storage/archiving and further analysis. Microsoft Excel and MicroCal origin (version 2018) were used in reducing further the dataset for the purpose of analysis. From the reduced dataset, daily patterns of $\mathrm{CO}_{2}$ fluxes and concentration, wind speed and direction and some other meteorological variables were plotted and examined for possible correlations.
### c) Ancillary measurements at $T$ & $R$ Farm, OAU, Ile-Ife
Aside EC measurements, supporting meteorological variables of relevance to the study: global and net radiation, air and soil temperatures, relative humidity, soil heat flux, soil moisture and rainfall were acquired at the site. A four-component net radiometer (model NR01, Campbell Scientific Inc. Logan, Utah, USA) which measures radiation components and an integrated net radiometer (NR-LITE, Campbell Scientific Inc. Logan, Utah, USA) were placed side by side for comparison purposes on a $1.7\mathrm{m}$ tall mast. Additionally, on a $6\mathrm{m}$ mast were other sensors; cup anemometer (model A100L2; Vector Instr., USA) and wind-vane (model W200P) placed at $5.8\mathrm{m}$ above the surface for measuring wind speed and wind direction respectively, and a pyranometer (model CMR1, Kipp and Zonen, Holland) placed at $2.05\mathrm{m}$ height for measuring global radiation. Five soil temperature probes (model 108; Campbell Scientific Inc. Logan, Utah, USA) were buried at $0.02\mathrm{m}$, $0.05\mathrm{m}$, $0.10\mathrm{m}$, $0.30\mathrm{m}$ and $0.50\mathrm{m}$ for soil temperatures respectively. Two soil heat flux plates (model HFP01; Hukseflux Inc. Logan, Utah, USA) were also buried at $0.05\mathrm{m}$ and $0.10\mathrm{m}$ for measuring soil heat fluxes. A water content reflectometer (model CS616; Campbell Scientific Inc. Logan, Utah, USA) was inserted in the soil for measuring volumetric soil moisture content and a raiuage (model TE525,Tipping bucket) to measure the amount of rainfall at the study site. The slow-response sensors' data were sampled at $10\mathrm{s}$ and averaged every 1-min. They were subsequently reduced to 30-min. averages for the purpose of analyses.
## III. RESULTS AND DISCUSSION
### a) Diurnal variation of $\mathrm{CO}_{2}$ flux and concentration at the study location
Figures 3 and 4 show the diurnal patterns of $\mathrm{CO}_{2}$ flux and concentration respectively covering the period of observation; January 2017 to December, 2018 at the study location. From the two figures, it is evident that in the daytime from about 7:30 AM local time (Local time, LT = GMT+1) when surface condition is changing and convective activities are kicking off, air temperature and global radiation increase at the location. This results in a sharp drop in the amount of $\mathrm{CO}_{2}$ fluxes from about $0.09\,\mathrm{mgm}^{-2}\mathrm{s}^{-1}$ to about $-0.52\,\mathrm{mgm}^{-2}\mathrm{s}^{-1}$ recorded around 11:00 AM, which is the minimum flux value observed for the day. The concentration in turn fell from about 803.3 $\mathrm{mgm}^{-3}$ in the early morning to about 628.8 $\mathrm{mgm}^{-3}$, being the minimum value recorded around 5:30 PM LT. The drop in the fluxes and concentration values of $\mathrm{CO}_{2}$ is attributed majorly to distribution and uptake of $\mathrm{CO}_{2}$ by plant for photosynthesis. From 11:00 PM when minimum fluxes were recorded, the values were almost constant until around 2:30 PM when there was a sudden rise in the amount of the fluxes to about $-0.46\,\mathrm{mgm}^{-2}\mathrm{s}^{-1}$. The sudden rise in the fluxes may be attributed to intermittent convective cloud drift which blocked out solar radiation reaching the surface, thereby lowering photosynthetic activities. The value continued to rise until around 9:00 PM when the fluxes peaked, about $0.21\,\mathrm{mgm}^{-2}\mathrm{s}^{-1}$ observed and recorded at the site. Around 6:00 PM LT, the level of $\mathrm{CO}_{2}$ concentration rose from about 632.0 $\mathrm{mgm}^{-3}$ to about 782.0 $\mathrm{mgm}^{-3}$, the maximum value recorded at 11:00 PM LT. The results indicate that there are time lags between the occurrences of the minima fluxes and concentration values (about 3 hrs), and the peaks (about 2 hrs) of $\mathrm{CO}_{2}$ at the location. This may be attributed to the influence of possible climatic factors such as "intermittency of incoming solar radiation to the surface by the transient nature of convective clouds in the region." Additionally, the thermodynamic structure of the lower atmosphere in the area may inhibit some ecosystem exchange processes over the time (Ayoola et al., 2014, Ajao et al., 2020). For the occurrences of $\mathrm{CO}_{2}$ fluxes in different months as observed in the Fig. 3, low fluxes were recorded in the wet months (that is April to October) particularly, during the daytime while large fluxes were recorded in the dry months (that is December, January and February). Consistently in the wet months, $\mathrm{CO}_{2}$ fluxes were negative in the daytime but positive at nighttime indicating net uptake and release by plants respectively. Fluxes were less negative in the dry months than the wet months. According to Ajao et al. (2020), March and November are classified as transition months. In March, there is transition from dry-to-wet while the reverse is the case for November. Fluxes were less negative during the transition months than some wet months. The level of $\mathrm{CO}_{2}$ concentration fell below $700.0\mathrm{mgm}^{-3}$ during the day both in wet and dry months as evident in the Fig. 4, but rose above this value in the night as $\mathrm{CO}_{2}$ fluxes became positive due to stable boundary layer conditions and increased soil and plant respiration. Maximum and minimum values of $\mathrm{CO}_{2}$ concentrations observed and recorded in December were $823.3\mathrm{mgm}^{-3}$ and $628.8\mathrm{mgm}^{-3}$ respectively. Annual mean and range for the period were $704.4\pm 47.2\mathrm{mgm}^{-3}$ and $134.5\mathrm{mgm}^{-3}$ respectively as indicated in the Table 4. Figures 5 and 6 show the 'Box and whisker' plots of half-hourly averaged values of $\mathrm{CO}_{2}$ fluxes and concentrations from January to December, whose statistical distributions contain the following scores: quartiles ( $25^{\text{th}}$ and $75^{\text{th}}$ percentiles), median ( $50^{\text{th}}$ percentiles), mean, minimum and maximum values respectively. From the box plots in Fig. 5, the grouping of the data shows that though the dry months recorded lower range of fluxes than the wet months, fluxes in the dry months were rather less negative than in wet months. Positive monthly mean values were recorded for dry months while wet months recorded negative values. The lowest and highest monthly mean $\mathrm{CO}_{2}$ flux values, $-0.08\pm 0.26\mathrm{mgm}^{-2}\mathrm{s}^{-1}$ and $0.04\pm 0.03\mathrm{mgm}^{-2}\mathrm{s}^{-1}$ were observed and recorded in October and February respectively as indicated in the Table 3. Strikingly in Fig. 6, the lowest and highest inter quartile range ( $25^{\text{th}} - 75^{\text{th}}$ ) in concentrations was found in August, $695.5\mathrm{mgm}^{-3}$ and December, $822.7\mathrm{mgm}^{-3}$ respectively. The lowest and highest monthly mean $\mathrm{CO}_{2}$ concentration values, $669.5\pm 24.9\mathrm{mgm}^{-3}$ and $722.3\pm 54.3\mathrm{mgm}^{-3}$ were observed and recorded in August and October respectively as indicated in the Table 4.
### b) Diurnal pattern of Wind speed and Direction at the study location
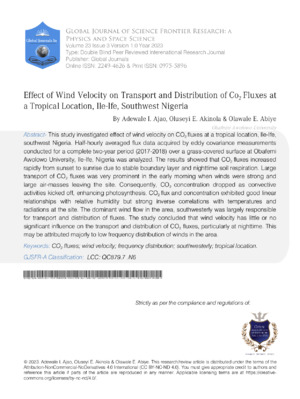
Diurnal pattern of surface wind speed at the study location in OAU Met-station, Ile-lfe, Nigeria for the observation period: January 2017 to December 2018 is plotted in the Fig. 7. 'It is of importance to note that previous studies by Hayward and Oguntoyinbo (1987) and Jegede (1998) observed and concluded that surface wind flow for Ile-lfe is weak. "The estimated mean surface wind for the area $\approx 1.5\mathrm{ms}^{-1}$. Table 1 shows wind categories for the study period as observed at the location. The daily pattern of wind speed observed at the site showed an inverse relationship with $\mathrm{CO}_{2}$ fluxes. The annual mean wind for the study period was $1.2\pm 0.4\mathrm{ms}^{-1}$. In the daytime when the condition was unstable at the location, wind became strong and rose from about $1.0\mathrm{ms}^{-1}$ around 8:00 AM to reach its peak value of about $2.1\mathrm{ms}^{-1}$ around 1:00 PM LT. By this time, $\mathrm{CO}_{2}$ flux had dropped to its minimum value as observed in the Fig. 3. Similarly, in the Fig. 4, concentration value dropped from its peak to minimum. Around 5:30 PM, wind speed became weak and dropped sharply from about $2.0\mathrm{ms}^{-1}$ to its minimum value of about $0.6\mathrm{ms}^{-1}$ around midnight when both $\mathrm{CO}_{2}$ flux and concentration had attained their peak values respectively. As such, both parameters displayed inverse relationship with wind speed in the daytime. $\mathrm{CO}_{2}$ flux displayed little or no fluctuation with wind speed during nighttime whereas concentration showed some degree of fluctuations. For the monthly variation of wind speed as observed in the Fig. 7, surface wind was stronger in the wet months than in the dry months. From midnight till dawn, wind speed was weak (values ranged between $0.5\mathrm{ms}^{-1}$ and $1.0\mathrm{ms}^{-1}$ ) for the months except in July and August when it was relatively weak (slightly above $1.0\mathrm{ms}^{-1}$ ). This may be attributed to strong winds preceding heavy rains recorded in the two months, particularly at nighttime. The monthly mean relative humidity values observed and recorded for July and August were $88.5\pm 8.4\%$ and $88.7\pm 8.3\%$ respectively as indicated in the Table 3. The observed monthly mean relative humidity value in August (peak of rainy season) was the highest for the period of observation. For daytime period, from about 8:00 AM in each month of the year, the observed surface wind ranged between $1.0\mathrm{ms}^{-1}$ and $2.0\mathrm{ms}^{-1}$. The value dropped from maximum to reach minimum from dusk to about midnight (6:30 PM - 12:00 AM). As such, surface wind was weaker at nighttime than in the daytime at the location. This is adduced to stable boundary layer (calm conditions) at nighttime and unstable conditions during the day. Figure 8 shows wind roses depicting dominant wind flows for the twelve months during the observation period at the study site. For dry months, the dominant wind flows were south easterlies (SE) while southwestern lies (SW) dominated the wet months. In the transition months, winds changed direction from SE to SW in March while SW occurred more often than SE in November (see Table 2). Figure 9 shows 'Box and whicker' plots of wind direction as observed at the location. As evident in the figure, the inter quartile range $(25^{\mathrm{th}} - 75\mathrm{th})$ for the dry months were found larger than those in the wet months. Also, the monthly mean wind direction for December and January were less than $150^{\circ}$.
### c) Diurnal pattern of Friction velocity $(u^{\star})$ and its relationship with $\mathrm{CO}_{2}$ Flux
Figure 10 shows mean daily cycle of friction velocity $(u^{*})$ as observed at the study location. For the study period, surface friction velocity increased in value from dusk (about 7:00 PM) through to midnight till around 3:00 AM due to stable boundary layer conditions, while there was a sharp drop in its value between 4:30 AM and 7:00 A Mas a result of departure of air mass (wind shear)from the site. The daytime fluctuation and rising pattern of $u^{*}$ was due to increase in atmospheric mixing resulting from unstable boundary layer. For the study period, the daily range of $u^{*}$ was between $0.08~\mathrm{ms^{-1}}$ and $0.18~\mathrm{ms^{-1}}$. The lowest monthly mean value, $0.12 \pm 0.02~\mathrm{ms^{-1}}$ was observed and recorded in October and November, while the monthly peak value, $0.15 \pm 0.02~\mathrm{ms^{-1}}$ occurred in July and August respectively. In relating friction velocity to $\mathrm{CO}_{2}$ flux and concentration, it is evident in Fig. 10 that $u^{*}$ showed inverse relationship with both parameters in the daytime at the location. For nighttime period, the rising and fluctuation of $u^{*}$ did not really have any significant influence on the fluxes and concentration as both parameters seldomly rose, but were almost constant in values. This may be attributed to stable boundary layer at night and low frequency distribution of winds in the area.
### d) Monthly Trends of wind speed, $CO_{2}$ flux and concentration at the study site
Figure 11 shows monthly trends of wind speed, $\mathrm{CO}_{2}$ flux and concentration for the period of observation. In Fig. 11(a), monthly mean value of wind speed for January was $0.9 \pm 0.4 \, \mathrm{ms}^{-1}$. The value increased to $1.3 \pm 0.4 \, \mathrm{ms}^{-1}$ in February at the peak of dry season. As the season transited to wet in March through to June, wind speed fell from $1.4 \pm 0.5 \, \mathrm{ms}^{-1}$ to $1.3 \pm 0.4 \, \mathrm{ms}^{-1}$ in June, and then rose through to August, $1.4 \pm 0.3 \, \mathrm{ms}^{-1}$. The strongest mean wind speed for the period was $1.4 \pm 0.4 \, \mathrm{ms}^{-1}$ observed in July. The increase in wind speed values observed for July and August as indicated in the Table 3 may be attributed to strong southwestern lies which preceded rains that characterize the period. The observed and recorded value in August dropped sharply to $0.9 \pm 0.3 \, \mathrm{ms}^{-1}$ in October being the weakest mean wind speed for the period. The value was constant until December when it increased a little to $0.9 \pm 0.4 \, \text{ms}^{-1}$. For monthly variation of $\text{CO}_2$ flux at the site as shown in the Fig. 11(b), monthly mean flux in January was $0.01 \pm 0.04 \, \text{mgm}^{-2} \, \text{s}^{-1}$. The value rose to $0.04 \pm 0.03 \, \text{mgm}^{-2} \, \text{s}^{-1}$ in February. From March through to November, the flux dropped steadily and was almost constant in value until December when it rose. The flux values were negative for wet months but positive for dry months. The positive value of $\text{CO}_2$ flux recorded in dry months is attributed to dryness of surface and less uptake of $\text{CO}_2$ for photosynthesis during the period, as air temperature and global radiation rose from $25.9 \pm 6.2^{\circ} \text{C}$ and $179.0 \pm 29.0 \, \text{Wm}^{-2}$ in January to $28.9 \pm 4.8^{\circ} \text{C}$ and $189.3 \pm 40.9 \, \text{Wm}^{-2}$ in February respectively (see Table 3). Figure 11(c) shows monthly trend of $\text{CO}_2$ concentration at the location. In January, the monthly mean $\text{CO}_2$ concentration dropped from $703.9 \pm 53.4 \, \text{mgm}^{-3}$ to $694.6 \pm 46.0 \, \text{mgm}^{-3}$ in February. The drop is attributed to same reason as stated earlier. As the season transited to wet in March, the value rose to $706.0 \pm 41.6 \, \text{mgm}^{-3}$, and fluctuated steadily through to July until it fell to about $669.5 \pm 24.9 \, \text{mgm}^{-3}$ in August. The minimum mean $\text{CO}_2$ concentration for the period was recorded in August (peak of rainy season). This may be attributed to a break in the rains for some two to three weeks from late July to early August, a phenomenon termed "little dry season (LDS)" experienced within the sub-region of West Africa (Adejuwon, 2012; Ajao et al., 2020). By this period, both air temperature and global radiation fell to their minima values of $25.9 \pm 2.0^{\circ} \text{C}$ and $125.2 \pm 63.5 \, \text{Wm}^{-2}$ respectively while relative humidity peaked at $88.7 \pm 8.3\%$. The concentration value rose from its minimum in August through to October to attain its peak of $722.3 \pm 54.3 \, \text{mgm}^{-3}$ while air temperature fell to $26.1 \pm 2.9^{\circ} \text{C}$ for the period. As the rains receded and the season transited to dry in November, $\text{CO}_2$ concentration fell to $688.8 \pm 21.4 \, \text{mgm}^{-3}$ due to increased air temperature and surface radiation which enhanced photosynthesis. The value climbed to $718.3 \pm 71.3 \, \text{mgm}^{-3}$ in December when temperature and radiation values dropped to about $26.0 \pm 5.5^{\circ} \text{C}$ and $184.7 \pm 34.9 \, \text{Wm}^{-2}$ respectively. The relative humidity also dropped from $79.8 \pm 16.8\%$ to $69.6 \pm 22.6\%$. The rise in $\text{CO}_2$ flux and concentration values coupled with the drop in the values of some major atmospheric variables (i.e. air temperature, relative humidity and global radiation) as observed in December is adduced to surface dryness, presence of strong convective clouds and prominent harmattan cooling from the Sahara desert.
## IV. CONCLUSIONS
Eddy covariance measurements of fluxes of $\mathrm{CO}_{2}$ with its associated concentration and other meteorological parameters taken over a grass-covered surface for two consecutive years (2017-2018) at Obafemi Awolowo University, Ile-Ife, southwest Nigeria have been analyzed to investigate possible effect of wind speed and direction on the transport and distribution of the fluxes in the area. At the study location, diurnal fluctuations of $\mathrm{CO}_{2}$ flux and concentration varied considerably with patterns of atmospheric transport and heating, particularly in the wet season. From sunrise, a sharp drop in $\mathrm{CO}_{2}$ fluxes was observed from about 0.2 $\mathrm{mgm}^{-2} \mathrm{s}^{-1}$ around 7:00 AM LT to reach minimum of about - 0.5 $\mathrm{mgm}^{-2} \mathrm{s}^{-1}$ around 1:00PMLT due to uptake by plants for photosynthesis. The observed value continued to drop until around 3:00 PM when the fluxes rose steadily through sunset and then into the nighttime. The fluxes fluctuated steadily during nighttime due to stable atmospheric boundary layer conditions and $\mathrm{CO}_{2}$ release via soil respiration. Fluxes of $\mathrm{CO}_{2}$ were observed to be less negative in the dry season than wet season due to surface dryness and reduced plant activities (cessation of photosynthesis) that characterize the former. Annual mean $\mathrm{CO}_{2}$ flux and concentration recorded at the location were - $0.03 \pm 0.18 \mathrm{mgm}^{-2} \mathrm{s}^{-1}$ and $704.4 \pm 47.2 \mathrm{mgm}^{-3}$ respectively. The findings in this study are in good agreement with many results earlier obtained for both temperate and tropical climate regions. Of particular interests are the results obtained on the campus of Hokkaido University in Sapporo, Japan by Miyaoka et al. (2007) and those obtained at Dehradun valley in India by Sharma et al. (2013). From the present dataset, inverse correlation existed between wind speed and $\mathrm{CO}_{2}$ fluxes with its associated correlation during the daytime but little or no significant effects of winds were observed on the fluxes at nighttime.
### ACKNOWLEDGEMENTS
The authors are thankful to members of Atmospheric Physics Research Group (APRG) and staff of technical unit at the Department of Physics and Engineering Physics of Obafemi Awolowo University, Ile-Ife, Nigeria for their support during the conduct of the field experiment. They are grateful to the editor and reviewer(s) who provided insightful and constructive comments that helped in improving the study. This research did not receive any specific grant from funding agencies in the public, commercial, or not-for-profit sectors, but the $\mathrm{CO}_{2}$ flux measurements (from eddy covariance system) have been sustained since 2016 in a group led by Prof. Oluwagbemiga O. Jegede.
#### Declaration of Interest statement
The authors declared that they have no known competing financial interests or personal relationships that could have appeared to influence the work reported in this paper.
#### Funding Statement
The Nigeria Micrometeorological Experiment (NIMEX) project led by Prof. Oluwagbemiga Jegede has been responsible for the running and maintenance of the Obafemi Awolowo University meteorological station (OAU-Metstation) since 2014.
Author's Contribution
All authors contribute to the study conception and design. Material preparation, data collection and analysis were performed by Dr. Adewale Iyiola Ajao. The first draft of the manuscript was written by Dr. Adewale Iyiola Ajao, and all authors commented on previous versions of the manuscript. All authors read and approved the final manuscript before final submission was made.
Data Availability
The data for this study will be made available to any individual or organization on reasonable requests via
[email protected] or
[email protected].
#### Ethics approval
The manuscript is a result of the research ongoing at the Obafemi Awolowo University Ile-lfe, southwest Nigeria. The work reported here is in its original form and has not been submitted or published elsewhere. Proper acknowledgements have been given to all the works consulted in the course of its preparation.
#### Consent to Participate
All authors are core members of the Atmospheric Physics Research Group (APRG) at the department of Physics and Engineering Physics, and Center for Energy Research and Development (CERD) in Obafemi Awolowo University (OAU), Ile-Ife, southwest Nigeria. The group has been responsible for the maintenance and running of the existing meteorological station in OAU, where the data for the study was acquired. No human or animal participation was directly involved in the research.
#### Consent for Publication
All authors agreed with the content of the final copy of the manuscript, and appropriate authorities were consulted and acknowledged before the work was submitted to the Journal.
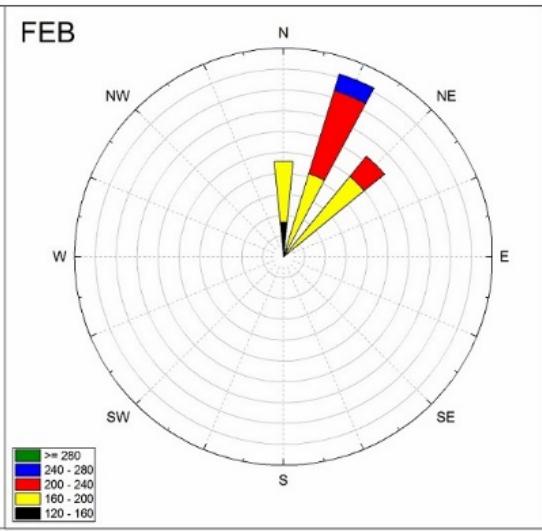 Fig. 8 (a)
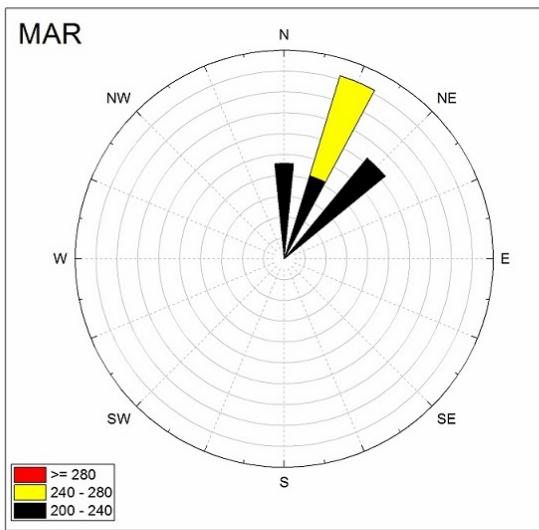
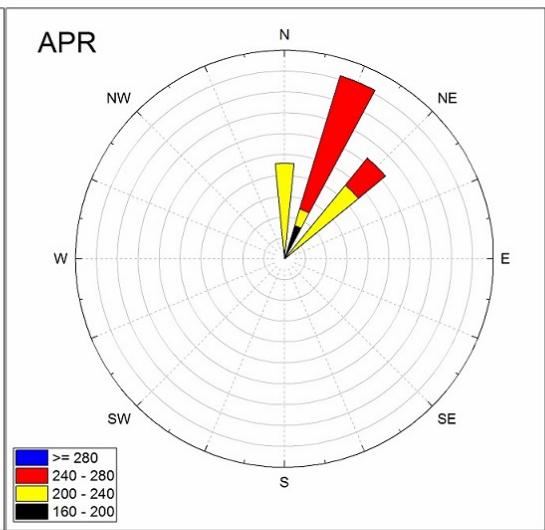 Fig. 8 (b)
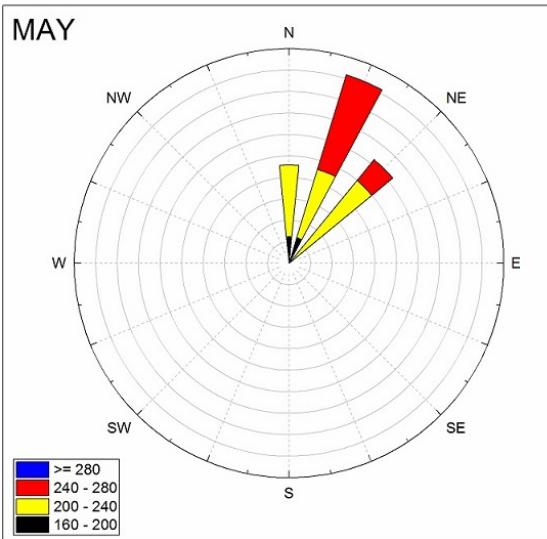
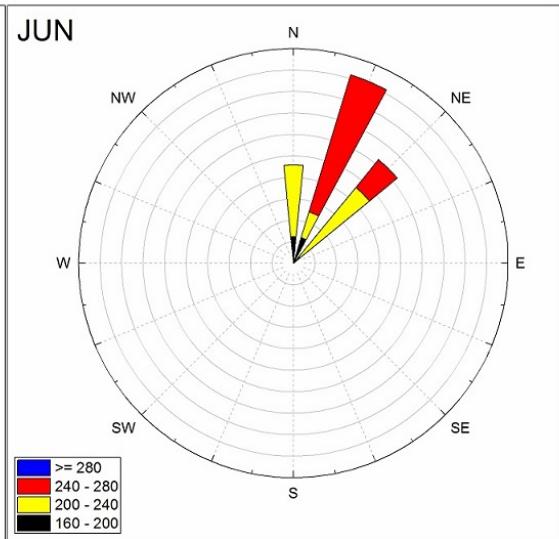
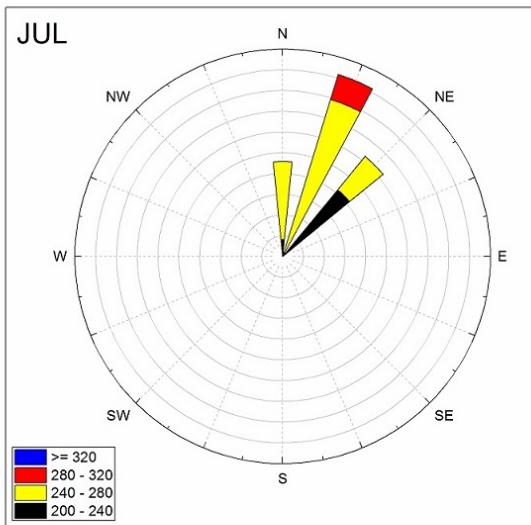 Fig. 8 (c)
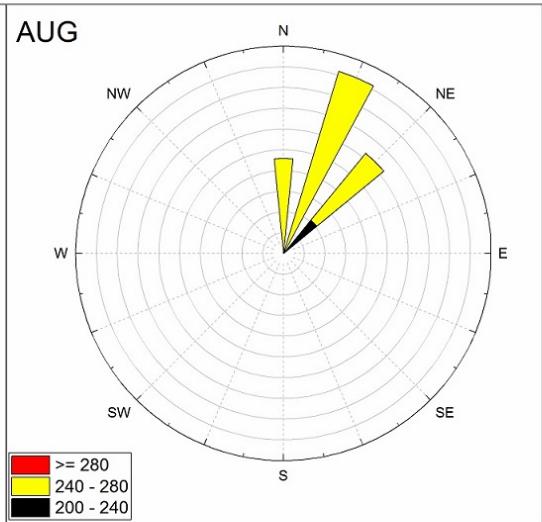 Fig. 8 (d)
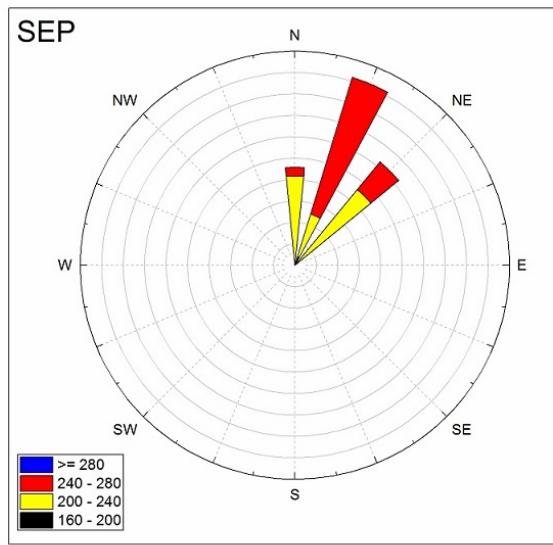
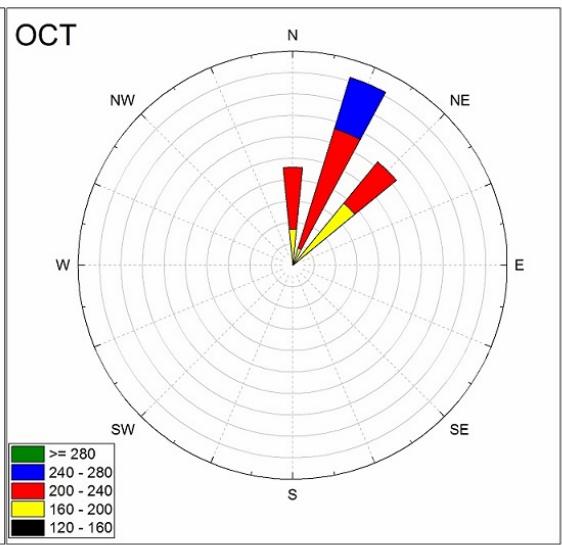 Fig. 8 (e)
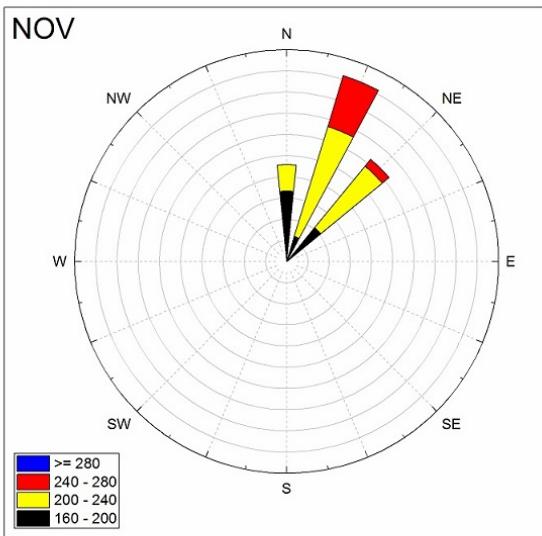
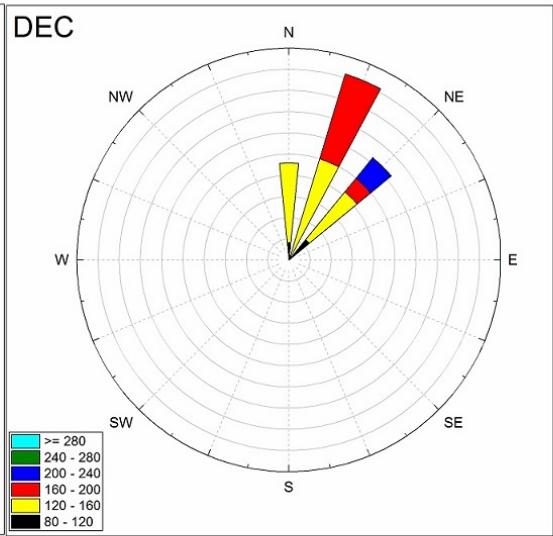 Fig. 8 (f) Fig. 8: Wind roses depicting dominant wind flow sectors at OAU Met- station, Ile-Ife, Nigeria during the observation period: 2017-2018.
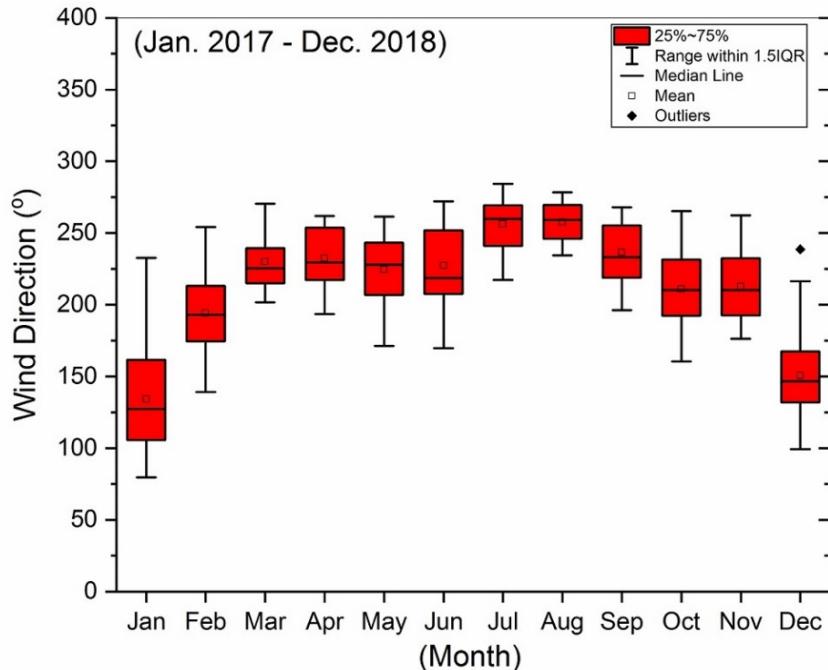 Fig. 9: Box and whisker plots depicting monthly and seasonal wind flow at OAU Metstation, Ile-Ife, Nigeria during the observation period: 2017-2018.
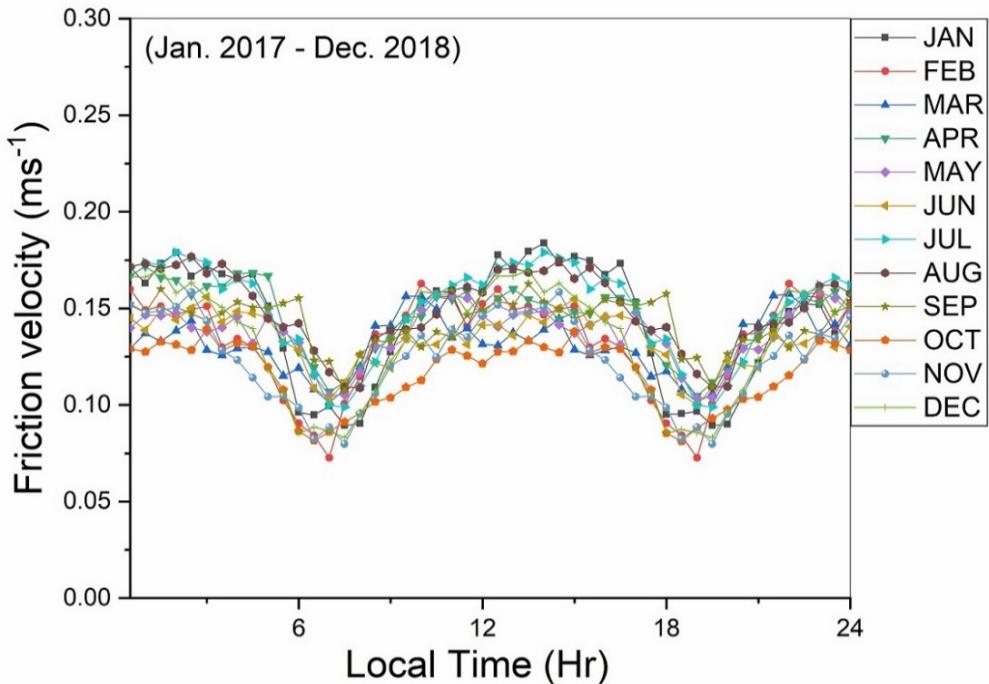 Fig. 10: Diurnal pattern of Friction velocity $(\mathbf{u}^{\star})$ at OAU Met-station, Ile-Ife, Nigeria during the observation period: 2017-2018.
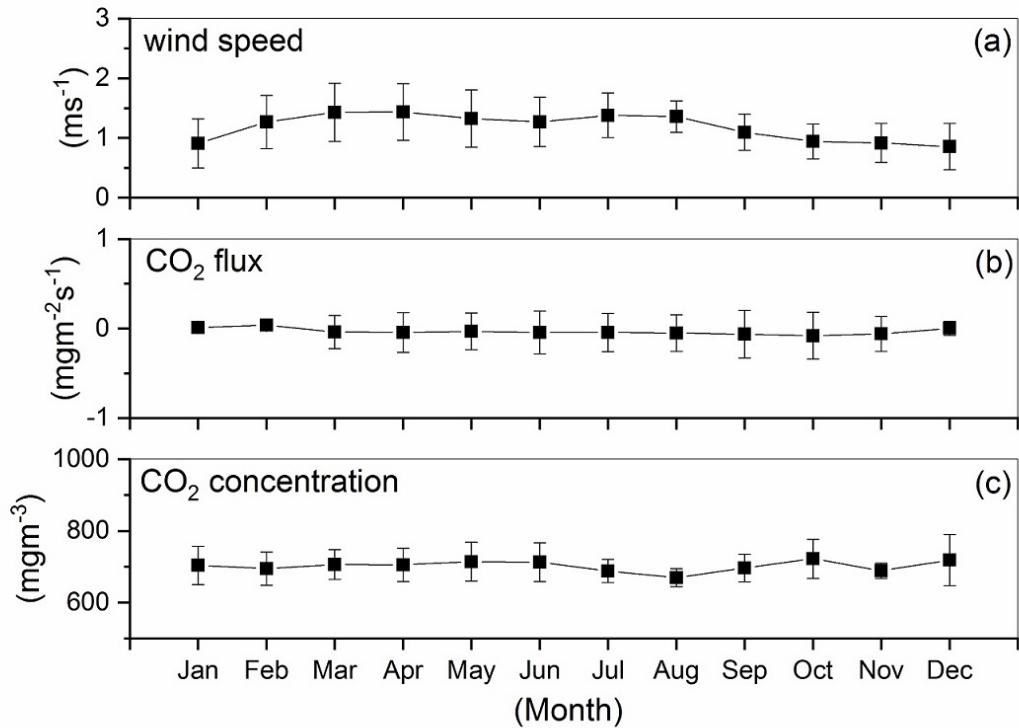 Fig. 11: Monthly Trends of (a) wind speed, (b) $\mathrm{CO}_{2}$ flux, and (c) $\mathrm{CO}_{2}$ concentration at OAU Met-station, Ile-Ife, Nigeria during the observation period: 2017-2018
#### List of Tables
Table 1: Wind classification as observed at the study location, OAU Met-station, Ile-Ife, Nigeria for the observation period: 2017-2018
<table><tr><td>Class</td><td>calm</td><td>weak</td><td>relatively weak</td><td>strong</td><td>relatively strong</td><td>very strong</td></tr><tr><td>Wind speed (ms-1)</td><td>< 0.5</td><td>0.5 – 1.0</td><td>1.0 – 1.5</td><td>1.5 –2.0</td><td>2.0 – 2.5</td><td>2.5 -3.0</td></tr></table>
Table 2: Dominant wind flow as observed at the study location, OAU Met-station, Ile-Ife, Nigeria for the observation period: 2017-2018
<table><tr><td>Month</td><td>Jan</td><td>Feb</td><td>Mar</td><td>Apr</td><td>May</td><td>Jun</td><td>Jul</td><td>Aug</td><td>Sep</td><td>Oct</td><td>Nov</td><td>Dec</td></tr><tr><td>Dominant wind</td><td>SE</td><td>SE, SW</td><td>SW</td><td>SW</td><td>SW</td><td>SW</td><td>SW</td><td>SW</td><td>SW</td><td>SW, SE</td><td>SW</td><td>SE</td></tr></table>
Table 3: Monthly mean values of
$\mathrm{CO}_{2}$ flux and other meteorological parameters as observed at the study location, OAU Met-station, Ile-Ife, Nigeria for the observation period: 2017-2018
<table><tr><td>Month</td><td>Mean Wind speed. (±SD) (ms-1)</td><td>Mean Friction vel. (±SD) (ms-1)</td><td>Mean Air Temp. (±SD) (°C)</td><td>Mean Rel. Hum. (±SD) (%)</td><td>Mean Global Rad. (±SD) (Wm-2)</td><td>Mean CO2Flux (±SD) (mgm-2s-1)</td></tr><tr><td>Jan</td><td>0.9±0.4</td><td>0.14±0.03</td><td>25.9±6.2</td><td>58.1±23.1</td><td>179.0±29.0</td><td>0.01±0.04</td></tr><tr><td>Feb</td><td>1.3±0.4</td><td>0.13±0.03</td><td>28.9±4.8</td><td>67.9±20.3</td><td>189.3±40.9</td><td>0.04±0.03</td></tr><tr><td>Mar</td><td>1.4±0.5</td><td>0.13±0.01</td><td>28.8±4.1</td><td>77.0±17.6</td><td>219.1±54.2</td><td>-0.04±0.18</td></tr><tr><td>Apr</td><td>1.4±0.5</td><td>0.14±0.02</td><td>28.2±3.4</td><td>80.9±13.3</td><td>204.0±61.5</td><td>-0.04±0.22</td></tr><tr><td>May</td><td>1.3±0.5</td><td>0.14±0.01</td><td>27.7±3.0</td><td>84.0±12.4</td><td>199.9±77.0</td><td>-0.03±0.20</td></tr><tr><td>June</td><td>1.3±0.4</td><td>0.13±0.01</td><td>27.0±2.8</td><td>85.5±11.5</td><td>184.1±70.2</td><td>-0.04±0.24</td></tr><tr><td>July</td><td>1.4±0.4</td><td>0.15±0.02</td><td>25.9±2.0</td><td>88.5±8.4</td><td>146.5±70.2</td><td>-0.04±0.21</td></tr><tr><td>Aug</td><td>1.4±0.3</td><td>0.15±0.02</td><td>25.9±2.0</td><td>88.7±8.3</td><td>125.2±63.5</td><td>-0.05±0.20</td></tr><tr><td>Sept</td><td>1.1±0.3</td><td>0.14±0.01</td><td>26.7±2.6</td><td>87.3±11.1</td><td>160.1±72.5</td><td>-0.06±0.27</td></tr><tr><td>Oct</td><td>0.9±0.3</td><td>0.12±0.02</td><td>26.1±2.9</td><td>86.2±11.4</td><td>187.7±63.0</td><td>-0.08±0.26</td></tr><tr><td>Nov</td><td>0.9±0.3</td><td>0.12±0.02</td><td>27.3±2.0</td><td>79.8±16.8</td><td>194.8±48.5</td><td>-0.06±0.20</td></tr><tr><td>Dec</td><td>0.9±0.4</td><td>0.13±0.03</td><td>26.0±5.5</td><td>69.6±22.6</td><td>184.7±34.9</td><td>0.00±0.08</td></tr><tr><td>Annual</td><td>1.2±0.4</td><td>0.14±0.02</td><td>27.0±3.4</td><td>79.5±14.7</td><td>181.2±57.1</td><td>-0.03±0.18</td></tr></table>
Table 4: Monthly mean, minimum, maximum and range of
$\mathrm{CO}_{2}$ concentration at the study location, OAU Met-station, Ile-Ife, Nigeria for the observation period: 2017 - 2018
<table><tr><td>Month</td><td>Mean CO2 Conc. (±SD) (mgm-3)</td><td>Min. CO2 Conc. (mgm-3)</td><td>Max. CO2 Conc. (mgm-3)</td><td>CO2 Conc. Range (mgm-3)</td></tr><tr><td>Jan</td><td>703.9±53.4</td><td>637.9</td><td>786.7</td><td>148.8</td></tr><tr><td>Feb</td><td>694.6±46.0</td><td>639.5</td><td>778.3</td><td>138.8</td></tr><tr><td>Mar</td><td>706.0±41.6</td><td>655.0</td><td>771.8</td><td>116.8</td></tr><tr><td>Apr</td><td>705.4±46.5</td><td>645.6</td><td>777.6</td><td>132.0</td></tr><tr><td>May</td><td>714.3±54.4</td><td>645.2</td><td>793.7</td><td>148.5</td></tr><tr><td>Jun</td><td>713.0±54.2</td><td>643.7</td><td>791.3</td><td>147.6</td></tr><tr><td>Jul</td><td>688.2±32.1</td><td>640.8</td><td>736.7</td><td>95.9</td></tr><tr><td>Aug</td><td>669.5±24.9</td><td>630.7</td><td>697.2</td><td>66.5</td></tr><tr><td>Sept</td><td>696.4±38.6</td><td>638.6</td><td>750.7</td><td>112.1</td></tr><tr><td>Oct</td><td>722.3±54.3</td><td>647.0</td><td>803.6</td><td>156.6</td></tr><tr><td>Nov</td><td>688.8±21.4</td><td>647.2</td><td>802.5</td><td>155.3</td></tr><tr><td>Dec</td><td>718.3±71.3</td><td>628.8</td><td>823.3</td><td>194.5</td></tr><tr><td>Annual</td><td>704.4±47.2</td><td>641.7</td><td>776.1</td><td>134.5</td></tr></table>