This paper presents an analysis of the effect of technological change on the labor market in the manufacturing sector in Mexico, in the period 2005-2021. Based on the human capital theory and the biased technological change approach, we study whether the manufacturing labor market presents a skills-biased technological change based on the correspondence between groups of low-and high-skilled workers in relation to the distribution of tasks: abstract, manual and routine. The objective is to show, through separate equations, whether the supply of skilled workers is related to abstract tasks and, on the other hand, whether unskilled work is assigned to manual and routine tasks. Through a VAR analysis, in general, consistent evidence is shown that the future of the supply of skilled labor is explained by abstract tasks..
## I. INTRODUCTION
In recent years it has been documented that labor markets in most countries have had substantial changes in the labor structure due to technological progress specific to tasks. The established consensus is that the sectors that are more intensive in highly skilled workers are associated with a technological change, specific to cognitive-type occupations. This has allowed, in tasks where higher qualifications are required, workers to register an increase in the wage premium, which is due to technological change biased towards skills.
The importance of studying technological change specific to occupations in the manufacturing industry consists of verifying whether, in fact, the technological level in each of the tasks; abstract, manual and routine, is related to the supply of workers by type of skills, which would confirm the skills-biased technological change. Technological change is understood as the introduction of specific information and communication technologies to the labor supply that are capable of increasing productivity.
The Hypothesis of Biased Technological Change (HBTC) argues that technological advances in the various sectors of production are creating capital infrastructures that have as a consequence the substitution of low-skilled workers, being complementary to high-skilled work (Author et al., 1998 and Acemoglu, 2002).
In fact, companies that continually introduce information technologies, such as personal computers or even machines that incorporate advanced technology in production processes, tend to demand highly qualified workers, particularly because this type of workers allows for increased productivity. While in companies whose production is based on manual tasks, the level of technology tends to be complementary with unskilled workers, therefore, in these tasks it has been confirmed that wages are usually low. On the other hand, there are companies that produce with routine tasks performed by medium or even low-skilled workers, which according to Gregory et al. (2019), in such occupations as repetitive activities, the introduction of digital technologies generally tends to displace workers who perform this type of routine activities.
From the perspective of technological change biased towards the tasks of Acemoglu and Autor (2010, 2012), in various occupations and even in sectors, it has been highlighted that the introduction of new technologies has replaced routine occupations more than manual tasks and abstract tasks, because those, being repetitive activities, do not require communication skills and complex cognitive skills, which are usually replaced by advanced technologies that perform well-defined routine tasks, which may well be performed to a lesser extent by qualified workers, in this way the result is obtained much more efficiently than routine tasks (Autor et al., 2003).
In the international context, empirical evidence indicates that due to the decrease in the prices of information technologies at the end of the last century, today, companies have had access to greater use of computers and industrial machines that are more complementary with skilled workers, this has consequently had effects on a growing wage gap between skilled and unskilled workers. The result is that the labor market has rewarded the wages of workers with higher skills more.
Thus, when skilled workers are relatively productive and complementary to capital, it leads companies that produce goods and services with technological content to have a greater demand for skilled labor.
In Mexico, large companies in the manufacturing industry are not distant from task-specific technological change, but rather, as they are experiencing continuous technological changes, it is an indication that the use of new technologies requires the demand for highly qualified employment. The proof of this is that those occupations in the industry that have to do with jobs such as officials, managers, art workers, professionals and technicians show a relationship with high levels of education but with an undesirable remuneration of wages in particular cases.
The objective is to show whether the supply of skilled workers is related to abstract tasks and, on the other hand, whether unskilled labor is assigned to manual and routine tasks. The general working hypothesis of this research is to carry out two separate equations for companies in the manufacturing industry: 1) that the specific technological change towards abstract tasks shows a positive relationship with the supply of highly skilled workers. 2) Manual tasks present a direct relationship with the supply of low-skilled labor, because the bias of technological change towards tasks shows that there is a one-to-one relationship between type of tasks and workers' skills.
In this paper it is established that the labor market in the industry is composed of demand variables; occupations in abstract, manual and routine tasks and, by worker supply variables; high and low-skilled workers, wages by type of worker and work experience, which in turn are affected by the unemployment that persists in each type of occupation.
A Vector Autoregressive (VAR) analysis is carried out in order to use a dynamic analysis framework of the labor market, estimating two separate equations; one represents high-skilled occupations and another for low-skilled labor. There is a vector of variables available that include; wages of high and low skills, supply of each type of work, experience of workers, unemployment rate and occupations in tasks; abstract, manual and routine. The method followed is to apply a VAR model to a set of quarterly time series data, from the period from 2005 to 2021, using information from the National Occupation and Employment Survey (ENOE).
The work is structured as follows, section 1 presents the literature review, section 2 presents the method and the data, section 3 describes the data, in section 4 the results and discussion and finally the conclusions.
## II. LITERATURE REVIEW
### a) Technological change and labor market
This section reviews the main approaches to the relationship between technological change and the labor market: the theory of human capital and biased technological change. Afterwards, empirical literature is presented for the case of Mexico on the effects of technological change on the labor market.
The analysis of the effects of technological change on the labor market is not recent. This relationship was initially analyzed by the theory of human capital to explain economic growth and income distribution. Currently this relationship is analyzed from the perspective of skill-biased technological change.
The human capital approach developed by Becker (1962) establishes that investment in human capital is fundamental for production processes and economic growth, in particular, because investment in education contributes to increased productivity in companies, which it also leads to increased income from the education of workers. In this sense, according to this theory, the skills that people acquire in school are a factor of relative importance in the accumulation of knowledge that leads them to obtain greater returns to education.
From this perspective, Mincer (1974), with the development of a human capital model, will refer that the incentives for investment in human capital, training in the workplace, years of work experience and age, lead to the employees to obtain increases in returns due to the level of schooling acquired, that is, higher wages; however, this leads to an increase in the wage gap between groups of workers with low and high education, by gender or even by racial characteristics. Currently, both theories have laid the foundations for the development of other approaches that study the relationship between technological change and the labor market linked to the education of the workforce, such as skill-biased technological change.
Regarding wage inequality between groups of low- and high-skilled workers, since the 1980s it has been observed that the effect of technological change on the labor market has led to an increase in wage inequality, due to the increase of the adoption of new technologies by companies that has prompted them to hire more specialized labor that can put them into operation.
One reason for the latter is that there is currently a greater demand for investment in technological equipment, induced by the fall in prices of information technologies and other technological advances since the 1970s[^1]. This has made it possible, that in many workplaces, the use of technology is less costly (Greenwood et al., 1997).
However, with the advances of new technologies, capital has been made less expensive and more accessible to companies in various sectors. This has resulted in greater complementarity between technological capital and qualified labor, which has led to greater replacement of unskilled workers. Therefore, according to Krusell et al. (2000) this has allowed an increase in the wage premium for skilled work, defined as the wages of college workers in relation to the wages of non-college workers. In this sense, it has been emphasized that the decrease in wages of this last group of workers has been due to the fact that they have adapted less to the use of new technologies in the workplace. All of this has been accentuated by the polarization of income between groups of workers with different educational levels. Author et al. (2003).
On the other hand, there is the Hypothesis of Biased Technological Change (HBTC) presented by authors such as Katz and Murphy (1992), Autor et al. (1998), Acemoglu (1998, 2002), Card and DiNardo (2002) and other works by Lee and Shin (2017), Graetz and Michaelis (2018), Buera et al. (2020), Bárany and Siegel (2020) and Acemoglu and Restrepo (2022), in general, have pointed out that with the development of technological progress, the cheaper information and communication technologies, the use of computers and the automation of industrial robots, in a variety of countries has led to more and more companies adopting them in favor of the capital factor, because by introducing them into production processes it allows them to be cost-saving, particularly in companies where the employment of labor force represents an important proportion of production costs.
The latter has to do with the fact that technologies can perform tasks with little human intervention to achieve high production standards per worker.
The facts suggest that there is a positive relationship between the adoption of new technologies and the demand for workers with higher skills. Acemoglu (2009) and Bárány and Siegel (2020) have estimated that technological progress has not been neutral as the theory of exogenous growth has explained, but that there is a propensity for technological change to be biased or directed more towards workers with higher education. In this sense, technological changes become endogenous within companies when they are developed from the need of companies to obtain greater profits (Vivarelli, 2014). The reason for this fact is that in efficient labor markets, capital that incorporates new technology becomes complementary to skilled labor.
With respect to the relationship between skilled work and occupations, Acemoglu and Autor (2010) in the canonical model of tasks, explain that the bias of technological change is possible because in companies and industries where there is a high development of technology, there is a one-to-one relationship between tasks and workers' skill level. The authors have found evidence for the United States that abstract tasks are related to high-skilled work, medium-skilled work to manual tasks, while low-skilled worker is linked to routine tasks.
Likewise, HBTC has emphasized that routine tasks are those that are most affected by the displacement that is carried out by the introduction of technological changes. Workers carrying out routine tasks have been easily replaced by the greater use of computer technologies, the automation of production processes and recently, by artificial intelligence, as mentioned by Webb (2020), Jaimovich et al. (2020) and Autor et al. (2003 p. 1280), because routine jobs "are accompanied by machines that follow explicit programming rules".
According to the latter, this led to an increase in demand in the lower categories, such as manual tasks that are less routine, which require the ability to adapt, and the higher ones that are abstract tasks where routine processes are null, due to because the ability to analyze, communicate, and cognitively solve problems are intuitive activities that do not require repetitive movements, so employees with high levels of education have these characteristics. This has given rise to the complementarity between highly skilled workers and new technologies, which the latter with manual and routine tasks.
In accordance with the above, HBTC analysis has suggested that technology has benefited those with a higher level of education and who are more qualified than those with a lower level of skills, therefore, the increase in capital that Incorporating new technology by companies that produce with analytical tasks is fundamental to increasing the supply of qualified labor and therefore increasing the wages of this group.
In summary, the literature establishes that the returns to education and experience are greater in the group of workers with more skills when they use new technologies in the workplace. For companies in the industry, to the extent that they introduce new technologies into production driven by the pressure of competition, it opens the possibility for the labor market to absorb the increase in the supply of qualified workers in abstract tasks. On the other hand, the low-skilled labor supply is assigned to manual tasks, even routine ones, where wages are low because it uses less information technologies.
### b) Effects of technological change on employment in Mexico
There is a debate whether technological change has differential effects on the labor market in advanced countries and developing countries. Srour et al. (2013) have emphasized that developed countries already have their own technology imposed on the labor market, while many developing countries, in certain sectors, mainly technology-intensive ones, have had to import it and adapt it to internal production processes, through trade, and through foreign direct investment, particularly industries specialized in exports such as many of the manufacturing companies in Mexico.
A fact that has been occurring since the 1980s in developed countries, is that digital technologies have affected the labor market, in such a way that they are changing the wage structure in many jobs in different economic sectors, in such a way that this is leading to a polarization of workers' wages, due to technological change biased towards skills. In such a way that technology has been complementary to workers with high skills, as Ballestar et al. (2020) and Gregory et al. (2019) have pointed out, so that new technologies in companies have achieved a growth in the demand for qualified workers, who have been favored by the increase in relative wages, while unskilled workers have received low wages, even other workers in routine positions have been displaced by automation, although simultaneously technology has also been creating new jobs due to the demand for new products.
In the case of Mexico, the relative supply of skills, some authors have pointed out, such as Calderón et al. (2017), Huesca et al. (2014), which has not been strongly associated with the increase in the relative wages of skilled to unskilled labor, but rather the wages of the most skilled workers have been falling. In this case, Huesca et al. (2014), using information from the 1999-2009 Economic Censuses for Mexico, found for this period that although there was a substantial increase in the supply of specialized labor, at the same time, there was a reduction in relative wages, they attribute it to an imbalance between supply and demand, due to the excess of skilled workers, therefore, other residual sectors such as the informal sector continue to be a market where skilled and unskilled workers are employed.
There is the argument then that the growing supply of skills does not correspond in the same proportion to the wage premium, but rather, skilled labor has not managed to be absorbed by the formal sector, which has led to the reduction of wages of skilled workers. This has the consequence that many workers find remuneration in the informal sector of the economy. Therefore, this could imply that the labor market has characteristics of weak skill-biased technological change[^2].
In a paper by Ochoa and Torres (2020) for Mexico, where they use quantile estimates by type of task: abstract, routine and manual, with data for the years 2012 and 2018, they point out that the country has registered an increase in jobs increasingly routine. They highlight that in 2018, there was a reduction in the wage premium in all occupation groups, attributed to a low demand for technology presented by companies in the country for production processes.
On the other hand, Rodríguez and Mesa (2020) analyze the effect that technological change biased towards tasks has on gender job differentials in the labor market in Mexico, during the years 2000 and 2017. Their results show that women have better prospects in non-routine manual and cognitive jobs, while men tend to be employed in routine and routine cognitive tasks. They find that women earn less than men in all occupations by type of task and women's work experience is a factor that allows reducing the gender wage gap.
In summary, since the 1980s, due to the introduction of endogenous technological changes to companies, there is a one-to-one relationship between tasks and schooling groups. However, when studies for Mexico are reviewed, it is found that rather than an increase in the wage premium for skilled labor, it has been decreasing since the 1990s.
## III. METHOD AND DATA USED
### a) Method
In this section we develop a Vector Autoregressive (VAR) analysis, with the purpose of estimating the dynamic interrelation between technological change and the labor market.
The VAR approach has the characteristic that each variable is expressed as a linear combination of its own lags and the lagged values of other variables in the system of equations. In this way, the structure of the lags of all the variables in all the equations is the same (Johnston and Dinardo, 1997). In the present case, there are variables of real wage (W), labor supply (O), work experience (E), unemployment rate (D) and a set of occupations or tasks; abstract (A), manual (M) and routine (R), so the set of variables in the VAR model is $y_{t} = [W_{t}, O_{t}, E_{t}, A_{t}, M_{t}, R_{t}, D_{t},]^{'}$, In general with a lag the model can be described as follows:
$$
W _ {t} = \alpha_ {1} + \phi_ {W, W} W _ {t - 1} + \phi_ {W, O} O _ {t - 1} + \phi_ {W, E} E _ {t - 1} + \phi_ {W A} A _ {t - 1} + \phi_ {W M} M _ {t - 1} + \phi_ {W R} R _ {t - 1} + \phi_ {W D} D _ {t - 1} + u _ {W, t}
$$
$$
O _ {t} = \alpha_ {2} + \phi_ {O, W} W _ {t - 1} + \phi_ {O, O} O _ {t - 1} + \phi_ {O, E} E _ {t - 1} + \phi_ {O, A} A _ {t - 1} + \phi_ {O, M} M _ {t - 1} + \phi_ {O, R} R _ {t - 1} + \phi_ {O, D} D _ {t - 1} + u _ {O, t}
$$
$$
E _ {t} = \alpha_ {3} + \phi_ {E, W} W _ {t - 1} + \phi_ {E, O} O _ {t - 1} + \phi_ {E, E} E _ {t - 1} + \phi_ {E, A} A _ {t - 1} + \phi_ {E, M} M _ {t - 1} + \phi_ {E, R} R _ {t - 1} + \phi_ {E, D} D _ {t - 1} + u _ {E, t}
$$
$$
A _ {t} = \alpha_ {4} + \phi_ {A, W} W _ {t - 1} + \phi_ {A, O} O _ {t - 1} + \phi_ {A, E} E _ {t - 1} + \phi_ {A, A} A _ {t - 1} + \phi_ {A, M} M _ {t - 1} + \phi_ {A, R} R _ {t - 1} + \phi_ {A, D} D _ {t - 1} + u _ {A, t}
$$
$$
M _ {t} = \alpha_ {5} + \phi_ {M, W} W _ {t - 1} + \phi_ {M, O} O _ {t - 1} + \phi_ {M, E} E _ {t - 1} + \phi_ {M, A} A _ {t - 1} + \phi_ {M, M} M _ {t - 1} + \phi_ {M, R} R _ {t - 1} + \phi_ {M, D} D _ {t - 1} + u _ {M, t}
$$
$$
R _ {t} = \alpha_ {6} + \phi_ {R, W} W _ {t - 1} + \phi_ {R, O} O _ {t - 1} + \phi_ {R, E} E _ {t - 1} + \phi_ {R, A} A _ {t - 1} + \phi_ {R, M} M _ {t - 1} + \phi_ {R, M} R _ {t - 1} + \phi_ {R, D} D _ {t - 1} + u _ {R, t}
$$
$$
D _ {t} = \alpha_ {7} + \phi_ {D, W} W _ {t - 1} + \phi_ {D, O} O _ {t - 1} + \phi_ {D, E} E _ {t - 1} + \phi_ {D, A} A _ {t - 1} + \phi_ {D, M} M _ {t - 1} + \phi_ {D, M} R _ {t - 1} + \phi_ {D, D} D _ {t - 1} + u _ {R, t} \tag {1}
$$
In the system, the variables on the right side of each equation are the same. In matrix form the model can also be expressed:
$$
\left[ \begin{array}{l} W _ {t} \\O _ {t} \\E _ {t} \\A _ {t} \\M _ {t} \\R _ {t} \\D _ {t} \end{array} \right] = \left[ \begin{array}{l} \alpha_ {1} \\\alpha_ {2} \\\alpha_ {3} \\\alpha_ {4} \\\alpha_ {5} \\\alpha_ {6} \\\alpha_ {7} \end{array} \right] + \left[ \begin{array}{l} \phi_ {W W} \phi_ {W O} \phi_ {W E} \phi_ {W A} \phi_ {W M} \phi_ {W R} \phi_ {W D} \\\phi_ {O W} \phi_ {O O} \phi_ {O E} \phi_ {O A} \phi_ {O M} \phi_ {O R} \phi_ {O D} \\\phi_ {E W} \phi_ {E O} \phi_ {E E} \phi_ {E A} \phi_ {E M} \phi_ {E R} \phi_ {E D} \\\phi_ {A W} \phi_ {A O} \phi_ {A E} \phi_ {A A} \phi_ {A M} \phi_ {A R} \phi_ {A D} \\\phi_ {M W} \phi_ {M O} \phi_ {M E} \phi_ {M A} \phi_ {M M} \phi_ {M R} \phi_ {M D} \\\phi_ {R W} \phi_ {R O} \phi_ {R E} \phi_ {R A} \phi_ {R M} \phi_ {R R} \phi_ {R D} \\\phi_ {D W} \phi_ {D O} \phi_ {D E} \phi_ {R A} \phi_ {D M} \phi_ {D R} \phi_ {D D} \end{array} \right] \left[ \begin{array}{l} W _ {t - 1} \\O _ {t - 1} \\E _ {t - 1} \\A _ {t - 1} \\M _ {t - 1} \\R _ {t - 1} \\D _ {t - 1} \end{array} \right] + \left[ \begin{array}{l} u _ {W, t} \\u _ {O, t} \\u _ {E, t} \\u _ {A, t} \\u _ {M, t} \\u _ {R, t} \\u _ {D, t} \end{array} \right] (2)
$$
In its standard form a VAR(1) of (2) is written in the form:
$$
y _ {t} = \alpha + \Phi_ {1} y _ {t - 1} + u _ {t} \tag {3}
$$
where, $y_{t}$ is the vector of endogenous variables, $\alpha$ the vector of intercepts plus $\Phi$ which is the coefficient matrix of the set of variables $y$ lagged on the right side plus the vector of error terms $u_{t}$ that are composed of shocks of the set of variables equal to
$$
u_{t}\sim N(0,V)\tag{4}
$$
The error term $u_{t}$ is normally distributed, with zero mean and constant variance, and individually, they are not serially correlated. By considering $B_{0}$ and $B_{1}$ two matrices of structural parameters, the system is expressed in its reduced form:
$$
B _ {0} y _ {t} = A + B _ {1} y _ {t - 1} + e _ {t}
$$
$$
y _ {t} = B _ {0} ^ {- 1} A + B _ {0} ^ {- 1} B _ {1} y _ {t - 1} + B _ {0} ^ {- 1} e _ {t} \tag {5}
$$
where, $B_0^{-1}A = \alpha$ $B_0^{-1}B_1 = \varPhi$ and $B_0^{-1}e_t = u_t$, so that (5) is expressed as in (3)
$$
y _ {t} = \alpha + \Phi_ {1} y _ {t - 1} + u _ {t} \tag {6}
$$
In this standard VAR the parameters are linked to those of the structural model by $B_0^{-1}B_1$. Similarly, the vector of errors of the VAR are related to the errors of a structural VAR by $B_0^{-1}e_t = u_t$. A structural VAR takes into account the contemporaneous $y_{t}$ variables on the right-hand side of equations (1), and in the reduced form the $y_{t}$ variables are a function of their own lag and the lag of the other variables in each equation. With the purpose of analyzing the effects of tasks, unemployment and their own lags on variables considered labor supply, these being; experience of workers, wages and the supply of workers by type of qualification, only the first three regressions of the equations in (1) are presented.
### b) Impulse response function
On the other hand, the Impulse Response Function (IRF) is shown, which is an alternative approach to the Granger causality test, which transforms the VAR into a Vector Moving Average (VMA). In general, the IRF studies the response of the variable explained in the VAR system to shocks in the error terms such as $u_{W,t}, u_{O,t}, \ldots, u_{R,t}$ in (2). In this sense, if stationarity is assumed in the variables, the VMA of (3) is:
$$
y _ {t} = \mu_ {1} u _ {t - 1} + \mu_ {2} u _ {t - 2} + \mu_ {3} u _ {t - 3} + \mu_ {4} u _ {t - 4} + u _ {t} + \dots \tag {7}
$$
and by taking the conditional expectation $E_{t - 1}(y_t)$ over the period $t - 1$, the forecast error for $y_t$ is achieved, that is:
$$
y _ {t} = \mu_ {1} u _ {t - 1} + \mu_ {2} u _ {t - 2} + \mu_ {3} u _ {t - 3} + \mu_ {4} u _ {t - 4} + u _ {t} + \dots \tag {8}
$$
Now for $y_{t + 1}$ and $y_{t + 2}$ the model is
$$
y _ {t + 1} = \mu_ {1} u _ {t} + \mu_ {2} u _ {t - 1} + \mu_ {3} u _ {t - 2} + \mu_ {4} u _ {t - 3} + u _ {t + 1} + \dots \tag {9}
$$
$$
y _ {t + 2} = \mu_ {1} u _ {t + 1} + \mu_ {2} u _ {t} + \mu_ {3} u _ {t - 1} + \mu_ {4} u _ {t - 2} + u _ {t + 2} + \dots \tag {10}
$$
From these expressions, by deduction we have that $u_{t-1}, u_t, u_{t+1}$ affect $y_t, y_{t+1}, y_{t+2}$, respectively and so on continuously through the coefficient $\mu_1$. In this order, the increase in the value of one standard deviation of $u_{W,t}$ in the first equation $W_{t}$ of (1), the shock $u_{W,t}$ will affect $W_{t}$ in the present and future period. But since $W_{t}$ appears in $O_{t}$ the second equation of (1), the change in $u_{W,t}$ also has an effect on $O_{t}$. Similarly, a change of one standard deviation in $u_{O,t}$ in the second equation of (1) has an impact on $W_{t}$. Therefore, following Gujarati (2003), the IRF studies the impacts of shocks from different periods in the future as expressed in equations (8)-(10).
### c) Variance decomposition
We now present the variance decomposition analysis. Stock and Watson (2001) point out that the composition of the forecast error is the percentage of the error variance that is made in forecasting a variable, for example, $W_{t}$, due to a shock or error term, for example, from the equation $O_{t}$ in (1) in a time horizon that can be 1, 4, 8 or 12 quarters. That is, variance decomposition deals with the conditional variance of impulse-responses.
From the equations in (1), we can measure, given a horizon of four quarters, how much of the percentage of the error in the forecast of wages $(W_{t})$ is attributed to labor supply shocks $(O_{t})$, worker experience $(E_{t})$, unemployment $(D_{t})$ and abstract $(A_{t})$, manual $(M_{t})$ and routine $(R_{t})$ occupations.
It is worth mentioning that before performing the VAR, Augmented Dickey-Fuller stationarity tests and Phillips-Perron tests are performed to reject the presence of unit roots. On the other hand, the Akaike
(AIC) and Schwarz (SIC) information criteria are also used to choose the model lags. Likewise, Lagrange Multiplier tests are done to test autocorrelation; The null hypothesis is that there is no autocorrelation in the order of lags. Finally, once the described tests are done, the VAR model is carried out as in (1) jointly by estimating Maximum Likelihood (ML) in order to restrict the model (1) and obtain the Log Likelihood and test through Likelihood-Ratio (LR) the choice or not of the restricted model.
### d) Data used
This study uses data from the National Occupation and Employment Survey (ENOE) provided by the National Institute of Statistics and Geography (INEGI). The survey collects information at the microdata level of large establishments in the manufacturing industry for the period from 2005 to 2021, which were converted to aggregate values in quarterly series. For the set of tasks, the Mexican Classification of Occupations (CMO) published by the INEGI is used.
Table 1 presents the tasks variables, according to Ochoa and Camberos (2016), following the same construction of tasks reported by the Mexican Classification of Occupations (CMO) of INEGI, which contains the task variables: abstract, manual and routine.
Table 1: Classification by type of tasks (CMO-ENOE)
<table><tr><td>Task</td><td>Occupation</td></tr><tr><td>Abstract</td><td>Professionals, technicians and art workers</td></tr><tr><td></td><td>Education workers</td></tr><tr><td></td><td>Officials and managers</td></tr><tr><td>Manual</td><td>Clerks</td></tr><tr><td></td><td>Industrial workers, craftsmen and helpers</td></tr><tr><td></td><td>Merchants</td></tr><tr><td></td><td>Transport operators</td></tr><tr><td>Routine</td><td>Workers in personal services</td></tr><tr><td></td><td>Workers in protection and surveillance</td></tr><tr><td></td><td>Agricultural workers</td></tr></table>
According to the classification in Table 1 and following Acemoglu and Autor (2011), it has been argued that:
- Abstract tasks are activities that require problem solving, intuition and creativity, and the workers who are best suited to these activities are those who have high levels of education and analytical skills, because these tasks are complementary to the use of computers.
- Manual tasks are occupations that can be performed by workers with lower levels of formal education, since these activities require adaptation, use of certain language and interaction between people which require fewer skills.
- Routine tasks are repetitive activities based on codified rules that can be specified by instructions and executed by machines, these occupations require medium skills.
The data are obtained only for the Economically Active Population (EAP) between 16 and 65 years of age. The types of ability refer to the years of schooling achieved by the workers in the survey, which are constructed as follows: low qualification, for people with education between 0 to 9 years of schooling and high qualification, for people with 16 or more years of schooling. The first age range, according to Acemoglu and Autor (2011), corresponds to low-skilled work, which includes employees with up to high school level.
The second education level group represents highly skilled workers; They are workers with college and postgraduate degrees.
For groups of low - and high-skilled workers, income is reported monthly, which is deflated to 2010 prices.
Information about workers' experience was also obtained; measures the background necessary to perform a job; this variable captures the experience of previous jobs by the people surveyed.
On the other hand, from the same survey, the unemployment rate variable is constructed, which is measured with data on the unemployed population and the EAP.
The size of the companies is represented by large establishments in the industrial manufacturing sector. Only private companies and businesses are considered, leaving out the informal sector and domestic work.
## IV. DATA DESCRIPTION
Table 2 shows the descriptive statistics that make up the complete sample that covers the period from the first quarter of 2005 to the fourth quarter of 2021. Based on the average of the sample, it is observed that of the set of worker demand variables that are tasks: abstract, manual and routine, manual occupations are those that, in proportion, represent the largest number of workers. In this order, during this period of analysis, abstract tasks follow and finally routine tasks.
Table 2: Descriptive statistics, manufacturing industry 2005-2021
<table><tr><td>Variable</td><td>Mean</td><td>Standard Deviation</td><td>Minimum Value</td><td>Maximum Value</td></tr><tr><td>Low-skills wages</td><td>65.56</td><td>19.76</td><td>37.90</td><td>103.74</td></tr><tr><td>High-skill wages</td><td>38.22</td><td>10.50</td><td>24.04</td><td>68.92</td></tr><tr><td>Supply of low-skilled workers</td><td>1.10</td><td>0.18</td><td>0.75</td><td>1.39</td></tr><tr><td>Supply of highly-skilled workers</td><td>0.33</td><td>0.10</td><td>0.19</td><td>0.53</td></tr><tr><td>Work experience</td><td>1.91</td><td>0.37</td><td>1.17</td><td>2.65</td></tr><tr><td>Abstract Tasks</td><td>0.25</td><td>0.08</td><td>0.14</td><td>0.42</td></tr><tr><td>Manual Tasks</td><td>1.82</td><td>0.46</td><td>0.21</td><td>2.53</td></tr><tr><td>Routine Tasks</td><td>0.06</td><td>0.01</td><td>0.04</td><td>0.08</td></tr><tr><td>Unemployment Rate</td><td>49.71</td><td>7.56</td><td>37.41</td><td>67.92</td></tr></table>
In general, the above indicates that the country's large manufacturing companies are intensive in manual tasks, however, the demand for employment for cognitive-type jobs begins to have an important position in the industry, particularly companies that produce goods and services with technology.
Regarding the supply of workers by type of skill, the average indicates that low-skilled workers are those who occupy the first position in proportion of workers, well above highly-skilled workers, which implies that the productive activities of sectors intensive in manual tasks are employers of low-skilled labor, which in proportion to the size of the labor market, are the main labor force in Mexico and receive wages above the aggregate wages of high-skilled workers.
Table 3 shows the proportion of occupations by type of task in the industry during the analysis period.
Table 3: Proportion of occupations in the manufacturing industry in Mexico, 2005-2021, values in percentage (Quarterly average)
<table><tr><td>Year</td><td>Abstract</td><td>Manual</td><td>Routine</td></tr><tr><td>2005</td><td>9.1</td><td>86.8</td><td>4.1</td></tr><tr><td>2006</td><td>9.6</td><td>87.1</td><td>3.3</td></tr><tr><td>2007</td><td>9.7</td><td>86.9</td><td>3.5</td></tr><tr><td>2008</td><td>10.6</td><td>86.0</td><td>3.4</td></tr><tr><td>2009</td><td>11.0</td><td>85.8</td><td>3.2</td></tr><tr><td>2010</td><td>10.6</td><td>85.7</td><td>3.7</td></tr><tr><td>2011</td><td>10.8</td><td>85.6</td><td>3.6</td></tr><tr><td>2012</td><td>12.1</td><td>85.0</td><td>2.9</td></tr><tr><td>2013</td><td>14.1</td><td>82.3</td><td>3.6</td></tr><tr><td>2014</td><td>11.6</td><td>85.5</td><td>2.9</td></tr><tr><td>2015</td><td>12.3</td><td>84.8</td><td>2.9</td></tr><tr><td>2016</td><td>12.3</td><td>85.3</td><td>2.3</td></tr><tr><td>2017</td><td>11.3</td><td>85.9</td><td>2.7</td></tr><tr><td>2018</td><td>12.0</td><td>85.8</td><td>2.2</td></tr><tr><td>2019</td><td>12.5</td><td>85.4</td><td>2.2</td></tr><tr><td>2020</td><td>13.2</td><td>84.6</td><td>2.2</td></tr><tr><td>2021</td><td>13.3</td><td>84.2</td><td>2.5</td></tr></table>
It is observed that the participation of manual occupations, occupies the first position of the set of tasks, then in this same order, abstract tasks follow and in third position are routine tasks. It is observed that the participation of manual and routine occupations has decreased from 2005 to 2021.
However, as shown, the participation of abstract tasks throughout the analyzed period has had a significant increase. The truth is that today large companies demand employment that they assign to abstract tasks to increase labor productivity, this to face the greater competitiveness that these firms face in an international context.
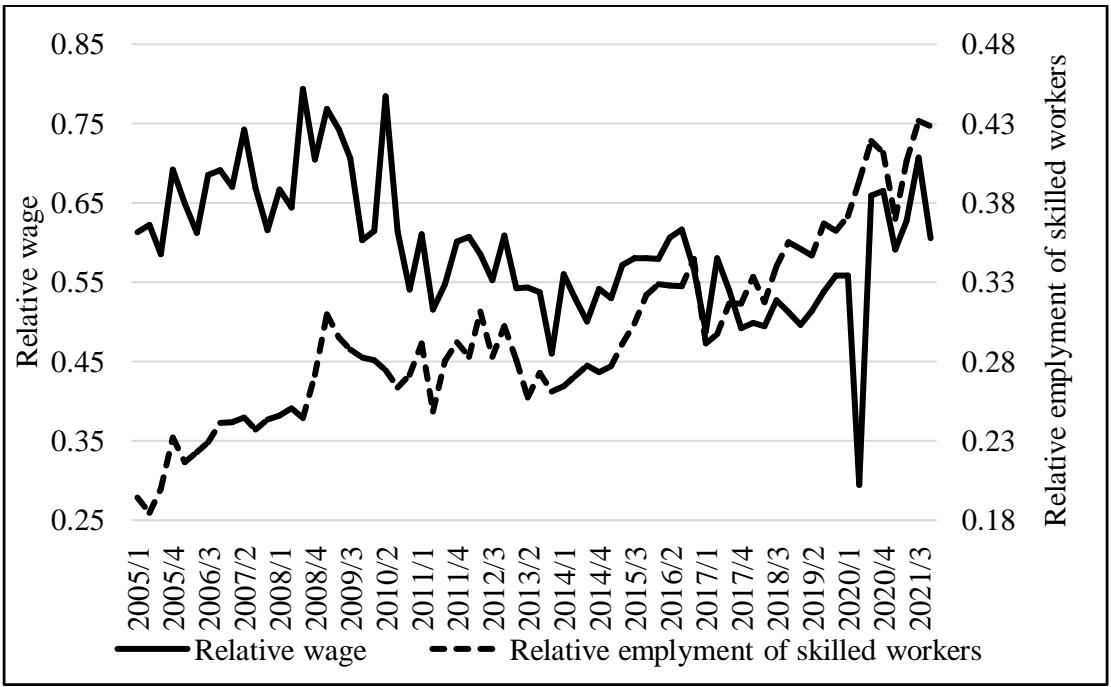
Figure 1 shows skill-biased technological change for the Mexican manufacturing industry. The figure analyzes the relationship between the relative supply of skilled workers and the relative wages of skilled workers. This relationship captures changes in the wage structure in the industry.
The figure shows that from the first quarter of 2005 to 2021 the relative supply of workers with skills increased significantly, however, there was a drop in the returns to education of college workers since the period of 2009, with a biggest drop in the COVID-19 pandemic period.
Empirical evidence establishes that the relative supply of workers with skills and the wage premium must have an increasing tendency, however, for the Mexican industry the relative wages from 2005-2009 increased, in fact they were above the relative supply of workers with skills. Thereafter, relative wages fell even though the supply of skills increased, this shows some reduction in the income gap between skilled and unskilled workers, which indicates some fall in income inequality.
 Source: Own elaboration with data from the ENOE-INEGI. Figure 1: Relative supply of skilled workers and relative wage of skilled workers In general, the above indicates that the industry represented by large companies is intensive in manual tasks, although the participation of abstract tasks is beginning to have greater relevance. This shows that the relative supply of qualified workers had an increasing
trend, but with relative wages in decline, right after the Great Recession of 2008. The above indicates that we must continue analyzing the relationship between tasks and work by type of skill in the industry now with empirical results.
## V. RESULTS AND DISCUSSION
This section presents the results of the estimated equations of (1), the variance decomposition and the impulse response functions. For comparability purposes, in the VAR model the occupations of low- and high-skilled workers are separated to express equations by group of workers, with the purpose of observing how the labor supply variables are affected by variables that represent the demand for tasks.
We must mention that before obtaining the estimates, Augmented Dickey-Fuller and Phillips-Perron stationarity tests were performed and it was found that the variables were not stationary, except for the routine tasks, therefore, the first differences were obtained. This ensures that the variables do not have unit roots as shown in the appendix at the end of the text. On the other hand, lag order tests are carried out using Akaike tests, and it is indicated that one lag should be chosen for low skill equations and three for high skill equations.
Table 4 shows the results of the first three equations of (1) in a VAR that includes all the variables together, considering low-skilled occupations that are workers with up to nine years of schooling.
Table 4: VAR estimation results for the manufacturing industry in Mexico, 2005-2021 (Low-skilled occupation)
<table><tr><td>Variable</td><td>Low-Skills Wages</td><td>Supply of Low- Skilled Workers</td><td>Work Experience</td></tr><tr><td rowspan="3">Low-skills wages (-1)</td><td>-0.2926*</td><td>-0.0030</td><td>0.0219**</td></tr><tr><td>(0.1753)</td><td>(0.0022)</td><td>(0.0087)</td></tr><tr><td>35.1893**</td><td>0.4608**</td><td>-2.7282***</td></tr><tr><td rowspan="2">Supply of low-skilled workers (-1)</td><td>(18.0407)</td><td>(0.2287)</td><td>(0.8999)</td></tr><tr><td>-19.2205**</td><td>-0.1557*</td><td>0.7148**</td></tr><tr><td rowspan="2">Work experience (-1)</td><td>(7.4031)</td><td>(0.0938)</td><td>(0.3693)</td></tr><tr><td>0.8814*</td><td>0.0113*</td><td>-0.0730**</td></tr><tr><td rowspan="2">Unemployment rate (-1)</td><td>(0.4992)</td><td>(0.0063)</td><td>(0.0249)</td></tr><tr><td>-7.4624</td><td>0.3970</td><td>-3.7411***</td></tr><tr><td rowspan="2">Abstract tasks (-1)</td><td>(24.9677)</td><td>(0.3165)</td><td>(1.2454)</td></tr><tr><td>0.3494</td><td>-0.0164</td><td>-0.0841</td></tr><tr><td rowspan="2">Manual tasks (-1)</td><td>(1.6242)</td><td>(0.0206)</td><td>(0.0810)</td></tr><tr><td>-113.1949**</td><td>-1.4224**</td><td>-2.7228</td></tr><tr><td rowspan="2">Routine tasks (-1)</td><td>(43.9538)</td><td>(0.5572)</td><td>(2.1925)</td></tr><tr><td>8.1887**</td><td>0.0929**</td><td>-0.1638</td></tr><tr><td>Constant</td><td>(2.7341)</td><td>(0.0347)</td><td>(0.1363)</td></tr><tr><td>R-Squared</td><td>0.26</td><td>0.19</td><td>0.28</td></tr></table>
In the first column of table 4, the results show that real wages are significantly related to their own lag, labor supply, level of experience, routine tasks and the unemployment rate. With a lag, the results show that the supply of low-skill workers has a positive and significant effect on wages. It is observed that work experience is significant and presents the opposite sign than expected. Furthermore, it is shown that manual tasks do not reveal a significant relationship with the wages of low-skilled employees. A possible interpretation of this low association is that in the last decade, large companies and corporations in the manufacturing industry could be incorporating new technologies that are complemented more by specialized work than by less skilled work.
In the second column of table 4, where the dependent variable is the supply of low-skill workers, the results show that its own lag is positive and significant. In this same equation, the results show that as the unemployment rate increases with up to a lag, the supply of unskilled workers tends to increase significantly, which is understandable due to the fact that unemployment impacts a large proportion of low-skilled workers tend to be employed in companies that pay high wages. Although, on the other hand, the results show that the increase in routine tasks decreases the labor supply significantly. This may be because these types of occupations regularly pay lower wages.
In the third column, the results show that work experience is positively and significantly related to its own lag. Likewise, the results for this group of workers indicate that experience is positively related to real wages at a $5\%$ significance level. Thus, as wages increase, this gives rise to an increase with even a lag in work experience.
On the other hand, the increase in the supply of unskilled labor tends to reduce the experience of workers at a $1\%$ level of significance. This could be associated with the fact that the excess supply of labor decreases the experience of the workforce to the extent that there is saturation of the labor market.
On the other hand, the unemployment rate has a negative and significant effect on work experience, which makes sense, because the unemployment of the group of unskilled workers, when it becomes persistent, makes it difficult to acquire additional experience in jobs where they can perform, that is, the increase in unemployment outdated the skills of an average worker. Note that the goodness of fit of the third model has an $R^2$ equal to 0.28, which is a high relative value with respect to the two previous equations.
Table 5 presents the results for high-skill occupations. The first column shows that the wages of high-skill workers with up to two and three lags have a positive relationship with work experience at the $5\%$ level of significance, this indicates that the acquisition of previous experience with up to two quarters of time, a worker with high skills on average increases the monthly wage.
Table 5: VAR estimation results for the manufacturing industry in Mexico, 2005-2021 (High-skilled occupations)
<table><tr><td>Variable</td><td>High-skill Wages</td><td>Supply of highly-Skilled Workers</td><td>Work Experience</td></tr><tr><td></td><td>-0.6713***</td><td></td><td>-0.0080**</td></tr><tr><td>High-skill wages (-1)</td><td>(0.1041)</td><td></td><td>(0.0035)</td></tr><tr><td></td><td>-0.3832***</td><td></td><td>-0.0066</td></tr><tr><td>High-skill wages (-2)</td><td>(0.1115)</td><td></td><td>(0.0044)</td></tr><tr><td></td><td></td><td></td><td>-0.0096**</td></tr><tr><td>High-skill wages (-3)</td><td></td><td></td><td>(0.0048)</td></tr><tr><td></td><td></td><td></td><td>1.2298</td></tr><tr><td>Supply of highly-skilled workers (-1)</td><td></td><td>-0.4433*** (0.1185)</td><td>(1.2024)</td></tr><tr><td></td><td></td><td>-0.0500</td><td></td></tr><tr><td>Supply of highly-skilled workers (-2)</td><td></td><td>(0.0912)</td><td></td></tr><tr><td></td><td>5.8810</td><td></td><td>-0.2721**</td></tr><tr><td>Work experience (-1)</td><td>(12.0312)</td><td></td><td>(0.1150)</td></tr><tr><td></td><td>24.5043**</td><td></td><td>-1.4158***</td></tr><tr><td>Work experience (-2)</td><td>(11.3638)</td><td></td><td>(0.3135)</td></tr><tr><td></td><td>26.7206**</td><td></td><td></td></tr><tr><td>Work experience (-3)</td><td>(11.0890)</td><td></td><td></td></tr><tr><td></td><td>-0.3472</td><td></td><td></td></tr><tr><td>Unemployment rate (-1)</td><td>(0.7393)</td><td></td><td>0.0177** (0.0073)</td></tr><tr><td></td><td>-1.4570**</td><td></td><td></td></tr><tr><td>Unemployment rate (-2)</td><td>(0.7035)</td><td></td><td>0.0847*** (0.0185)</td></tr><tr><td></td><td>-1.7052**</td><td></td><td></td></tr><tr><td>Unemployment rate (-3)</td><td>(0.6716)</td><td></td><td></td></tr><tr><td></td><td></td><td>0.2205**</td><td></td></tr><tr><td>Abstract tasks (-1)</td><td></td><td>(0.1085)</td><td></td></tr><tr><td></td><td>-2.3497</td><td></td><td></td></tr><tr><td>Manual tasks (-1)</td><td>(2.3704)</td><td></td><td></td></tr><tr><td></td><td></td><td></td><td>1.6799**</td></tr><tr><td>Routine tasks (-1)</td><td></td><td></td><td>(0.8424)</td></tr><tr><td></td><td>46.0362**</td><td>0.1363**</td><td></td></tr><tr><td>Routine tasks (-2)</td><td>(21.6114)</td><td>(0.0521)</td><td></td></tr><tr><td></td><td></td><td></td><td>-1.0736*</td></tr><tr><td>Routine tasks (-3)</td><td></td><td></td><td>(0.6249)</td></tr><tr><td></td><td>-2.7451*</td><td>-0.0024</td><td>0.0034</td></tr><tr><td>Constant</td><td>(1.6411)</td><td>(0.0039)</td><td>(0.0721)</td></tr><tr><td>R-Squared</td><td>0.39</td><td>0.24</td><td>0.34</td></tr></table>
The results also indicate that the unemployment rate in the second and third lags decreases high-skilled wages at the $5\%$ significance level. This shows that unemployment negatively affects the salary of a skilled worker more than that of an unskilled worker, because the skilled labor market is more sensitive to unemployment than low-skilled jobs.
With respect to the second column of table 6, the results indicate that with a lag, the supply of high-skill workers shows a positive relationship with abstract tasks for the industry at a significance level of $5\%$. Which proves the prevalence of skill-biased technological change during this period in these occupations. Since the increase in abstract tasks increased the supply of workers with skills, therefore, they were employed in this type of tasks. However, wages did not show a significant association with abstract tasks. Evidence shows that routine tasks have the ability to significantly increase the demand for skilled workers, however, in these occupations wages are often low.
On the other hand, the variance decomposition is an indicator that has predictive power on each of the variables analyzed. In the VAR it measures the percentage of the variance of the predicted variable attributed to the variables on the right side of equation (1) in different time horizons.
The results of the variance decomposition in table 6 are estimated in a complete VAR. Each predicted variable in panels A and B has four lags, both skill groups are low-skilled and high-skilled worker occupations. The values in each row are percentages of the variance attributed to the value of each variable on the right side and its own predicted variable. The variables are arranged in terms of labor supply variables (type of skill) and demand variables (type of tasks) which are made up of the percentage of the error in the forecast.
The results of panel A of table 6 show for the first row, the SLSW, $52.1\%$ of the variance of the forecast error is attributed to the wages of low-skilled workers and $9.8\%$ attributed to the set of tasks, in this way, routine tasks contributed a higher percentage of predictive power.
The second row that represents LSW, without considering its own predicted variable, the variables that have the greatest predictive power are the supply of low-skill workers, work experience and routine tasks, with a percentage value of 5.8, 6.7 and 6.6 of the forecast error respectively.
In the same panel A, the third equation captures work experience, in this, the variables that contribute the greatest to the prediction of the forecast error are the supply of low-skill workers with $10.2\%$ and the wages of low-skill workers. $13.6\%$, in addition to the unemployment rate has a predictive power of $7.2\%$ on EXP.
Table 6: Variance decomposition Percent of forecast error variance
<table><tr><td>Predicted variable</td><td>SLSW</td><td>LSW</td><td>EXP</td><td>AT</td><td>MT</td><td>RT</td><td>UNR</td></tr><tr><td colspan="8">Panel A. Low-skilled occupations</td></tr><tr><td>Supply of low-skilled workers (SLSW)</td><td>33.5</td><td>52.1</td><td>1.4</td><td>2.6</td><td>0.8</td><td>6.4</td><td>3.2</td></tr><tr><td>Low-skills wages (LSW)</td><td>5.8</td><td>75.6</td><td>6.7</td><td>2.0</td><td>0.1</td><td>6.6</td><td>3.1</td></tr><tr><td>Work experience (EXP)</td><td>10.2</td><td>13.6</td><td>57.6</td><td>9.0</td><td>1.1</td><td>1.4</td><td>7.2</td></tr><tr><td>Abstract tasks (AT)</td><td>2.0</td><td>9.4</td><td>8.2</td><td>68.4</td><td>4.6</td><td>0.9</td><td>6.5</td></tr><tr><td>Manual tasks (MT)</td><td>3.7</td><td>5.6</td><td>8.0</td><td>1.3</td><td>79.1</td><td>1.2</td><td>1.1</td></tr><tr><td>Routine tasks (RT)</td><td>2.0</td><td>11.9</td><td>13.3</td><td>2.7</td><td>0.7</td><td>67.8</td><td>1.7</td></tr><tr><td>Unemployment rate (UNR)</td><td>13.5</td><td>18.0</td><td>39.4</td><td>8.0</td><td>0.3</td><td>1.7</td><td>19.1</td></tr><tr><td>Predicted variable</td><td>SHSW</td><td>HSW</td><td>EXP</td><td>AT</td><td>MT</td><td>RT</td><td>UNR</td></tr><tr><td colspan="8">Panel B. High-skilled occupations</td></tr><tr><td>Supply of highly-skilled workers (SHSW)</td><td>90.6</td><td>2.9</td><td>0.4</td><td>4.3</td><td>0.0</td><td>1.6</td><td>0.0</td></tr><tr><td>High-skill wages (HSW)</td><td>0.1</td><td>94.6</td><td>0.5</td><td>0.1</td><td>1.3</td><td>1.5</td><td>1.9</td></tr><tr><td>Work experience (EXP)</td><td>11.8</td><td>5.0</td><td>65.8</td><td>1.1</td><td>1.2</td><td>4.4</td><td>10.8</td></tr><tr><td>Abstract tasks (AT)</td><td>33.1</td><td>11.2</td><td>0.7</td><td>51.3</td><td>0.1</td><td>3.3</td><td>0.1</td></tr><tr><td>Manual tasks (MT)</td><td>13.4</td><td>6.2</td><td>2.8</td><td>9.5</td><td>52.0</td><td>0.1</td><td>16.2</td></tr><tr><td>Routine tasks (RT)</td><td>3.6</td><td>39.4</td><td>8.3</td><td>9.2</td><td>1.4</td><td>30.9</td><td>7.2</td></tr><tr><td>Unemployment rate (UNR)</td><td>23.0</td><td>3.0</td><td>52.2</td><td>1.2</td><td>1.7</td><td>2.8</td><td>16.3</td></tr></table>
Panel B of Table 6 shows the results for high-skill occupations. Similarly, for a horizon of four quarters, if the first equation for high-skilled labor supply SHSW is analyzed, the percentage of the error depends almost entirely on its own predicted variable. However, SHSW, in order of highest value, $4.3\%$ of the forecast error is attributed to abstract task shocks and $2.9\%$ to wages of high-skilled workers.
In the second row of panel B, the wages of highly skilled workers, without including their own predicted variable, of the variances with the highest value, $1.9\%$ of the error in the forecast of wages is attributed to unemployment shocks and $2.9\%$ to the set of abstract, manual and routine tasks.
Finally, it is observed that the EXP equation is explained for the most part in addition to its own predicted variable, with a variance of the forecast error due to the supply of highly qualified workers with $11.8\%$ and the unemployment rate with a value of $10.8\%$ and $4.4\%$ routine tasks.
Therefore, based on this analysis, it can be confirmed that the future of the labor supply of low- skilled workers is due more to wage shocks and routine tasks than to other variables. While the wages of unskilled workers in the future are attributed more to the level of experience and routine tasks with up to four quarters in the past.
On the other hand, the future of high-skilled labor supply is attributed to shocks of abstract tasks and wages of high-skilled workers obtained in the past. Likewise, the results show that high-skilled wages are attributed to a high relative percentage of unemployment. In this same group, the experience in the future is attributed with up to a year of delay due to unemployment and skills shocks that persist in large companies in the manufacturing industry in the country.
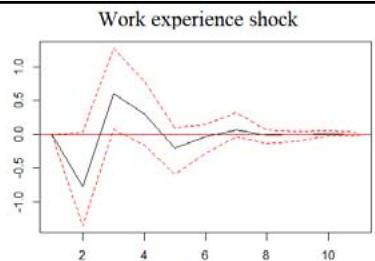
Based on the significant results in Tables 4 and 5, the estimates of the impulse response functions are now shown. With the impulse-response functions of the analyzed variables, the effects of a shock on wages and the supply of low- and high-skilled labor are shown.
In each figure, the vertical axis indicates the quarterly impact on wages and labor supply of each skill group, due to labor supply and wage shocks for both occupations, tasks, experience, and unemployment rate. On the horizontal axis, the quarters followed by the shocks of these variables are shown.
Thus, the technological change in the variables is implicit in the type of tasks in the industry. In this case, abstract tasks are those that register the greatest technological change compared to manual and routine occupations that use technology to a lesser extent. So the effects of abstract tasks can be shocks of greater technological content on wages and supply of workers for low and high skills.
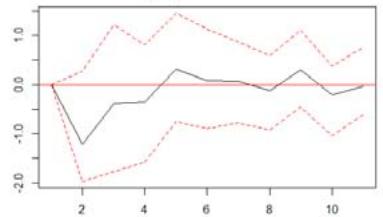
Figure 2 shows that a shock of one standard deviation on low-skilled labor supply has a positive effect on low-skilled wages until the third quarter, after the fifth quarter the effect is negative until it approaches its initial level.
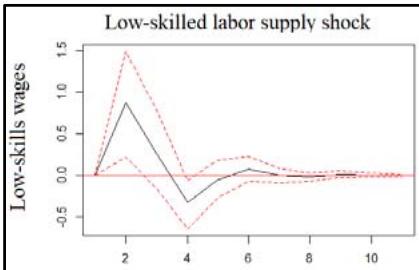
 Panel label: Lags.
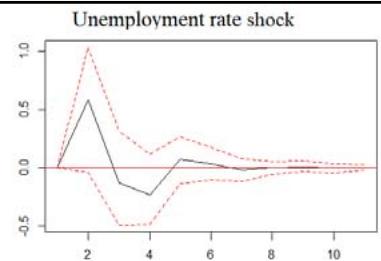 Figure 2: Response of low-skilled wages to low-skilled labor supply shocks, work experience and unemployment rate, Mexico 2005-2021
Likewise, the experience in terms of a shock initially has a negative impact on low-skilled wages, after the third quarter the impact is positive until stability is achieved starting in the fifth quarter.
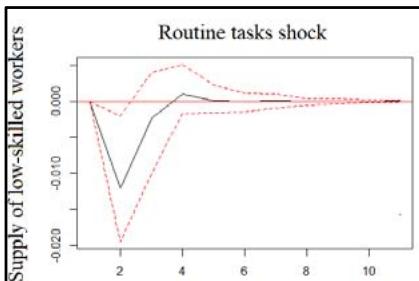
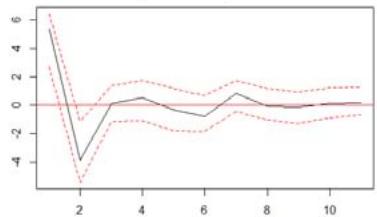
Figure 3 shows that a demand shock for routine tasks until the fourth quarter has a negative impact on the supply of unskilled workers; however, it is seen that the effect is temporary and then returns to its initial place. On the other hand, the future of high-skilled labor supply is attributed to shocks of abstract tasks and wages of high-skilled workers obtained in the past.
 Panel label: Lags.
 Source: Own elaboration with data from the ENOE, quarters from 2005 to 2021. Figure 3: Response of low-skilled labor supply to routine task shocks, unemployment rate and low-skilled labor supply, Mexico 2005-2021
Likewise, the results show that high-skilled wages are attributed to a high relative percentage of unemployment. In this same group, the experience in the future is attributed with up to a year of delay due to unemployment and skills shocks that persist in large companies in the manufacturing industry in the country.
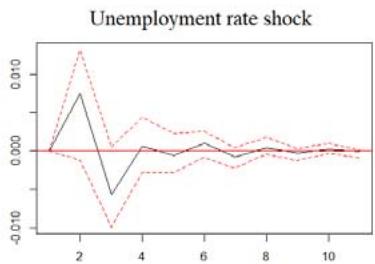
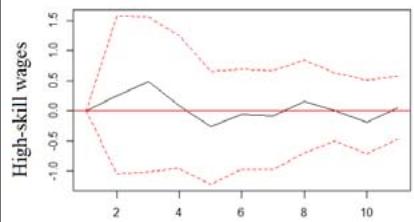
Figure 4 shows that an unemployment rate shock can negatively impact the wages of high-skill workers until the fifth quarter and then reach the less oscillatory initial level.
 Work experience shock
 Unemployment rate shock Lags
 High-skill wages shock Figure 4: Response of high-skilled wages to shocks of work experience, unemployment rate and high-skilled wages, Mexico 2005-2021
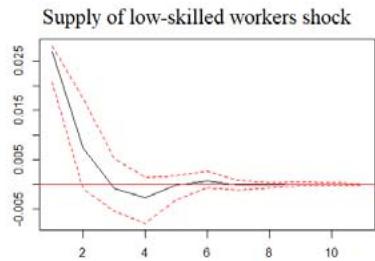
Finally, Figure 5 shows that abstract task shocks have positive effects on the supply of high-skilled labor in the first two quarters and later in the fifth. After this peak the oscillation increases and decreases more slowly, until approaching the initial level. Likewise, the response of the supply of high-skilled labor to routine task shocks shows that the effects are positive until the seventh quarter.
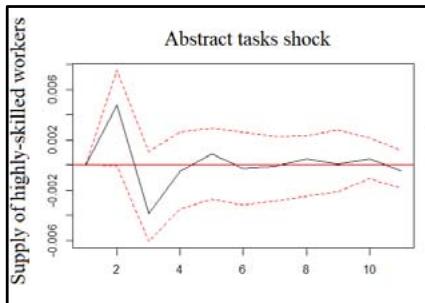
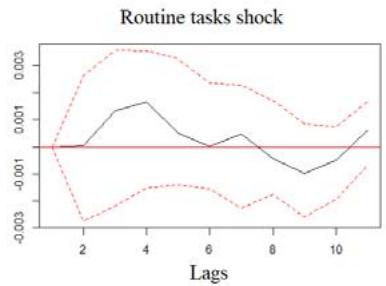
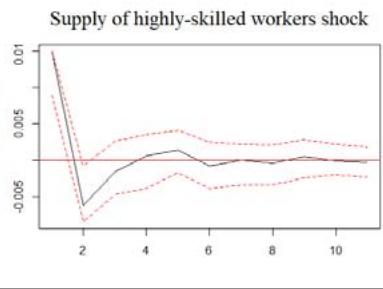 Figure 5: Response of high-skilled labor supply to shocks of abstract tasks, routine tasks and high-skilled labor supply, Mexico 2005-2021
Source: Own elaboration with data from the ENOE, quarters from 2005 to 2021.
In general, the impulse response functions show that the effects of task demand, work experience, and unemployment shocks are not permanent but transitory on wages and the supply of workers in low- and high-skill occupations over the time horizon.
## VI. CONCLUSIONS
The hypothesis of this research was to propose that the specific technological change towards abstract tasks shows a positive relationship with the supply of high-skilled work. While in low-skilled occupations, manual tasks present a positive relationship with the supply of low-skilled employment in accordance with the hypothesis of skill-biased technological change.
The biased technological change approach suggests that with the development of technological changes, companies tend to direct new technologies towards high-skilled work, which leads to increased productivity and wages. However, due to technology bias, unskilled workers tend to perform occupations related to little technological content.
To test the hypothesis, a VAR model was proposed for two equations; one for low-skilled occupations and another for high-skilled workers.
For high-skilled occupations, in large industrial companies, the results show that abstract tasks with up to a lag positively impacted the supply of high-skilled labor according to the HBTC of Acemoglu and Autor (2012). Which is consistent with the fact that the participation of abstract tasks has been increasing during the period of analysis, in addition to the demand for skilled workers, however, the demand for skills has not corresponded with the increase in relative wages for this group of occupations.
An important aspect that stands out is that work experience is a fundamental indicator that positively and significantly affects the wages of highly skilled workers. However, it is shown that when unemployment is persistent the experience decreases and the wages of this group of workers are significantly reduced. That is, unemployment causes skills to be lost, which is implicated in the decrease in income of skilled workers.
The analysis of the variance decomposition shows that the supply of highly skilled workers in future periods is assigned to abstract tasks and wages, which confirms the estimates made in table 5. Likewise, the results confirm that experience in the future is explained with up to a year of lag due to the unemployment rate that may persist in the labor market, that is, unemployment is detrimental to the experience of workers with skills because it tends to affect the wages of this work group for up to a period of two quarters as observed in the impulse response functions.
For the group of low-skilled occupations, the results show that the supply of unskilled workers is not explained by manual or routine tasks. However, the industry during this period has experienced a positive and significant relationship between wages and supply of low-skilled workers as theory indicates. On the other hand, it was found that experience is an important variable for this group of workers, since as there are increases in wages, there is an increase in work experience in the order of one quarter. However, market saturation due to the excessive increase in the supply of workers together with the persistent increase in unemployment reduces the level of experience of workers in the industry.
From the analysis of the variance decomposition, it is concluded that the future supply of low-skilled workers is affected by shocks in wages and routine tasks. On the other hand, the future wages of this group of workers are affected to a greater extent by the level of work experience and routine tasks. Which makes it possible for the accumulation of experience to increase wages in the future, but low-skilled workers tend to concentrate in routine occupations.
In conclusion, with regard to high-skilled work, the future of the supply of high-skilled workers is predicted by abstract tasks, which confirms the presence of a task-biased technological change. However, the wages of skilled workers are negatively affected by persistent unemployment shocks in the future that may be leading to a weak equilibrium. While in low-skilled occupations, the supply of employment is related to the increase in wages and routine tasks, however, in the future the wages of less-skilled workers depend on work experience.
### APPENDIX
Unit Root Tests (Stationarity)
<table><tr><td rowspan="2">Variable</td><td colspan="2">Augmented Dickey-Fuller</td><td colspan="2">Phillips-Perron</td><td rowspan="2">Functional Form</td></tr><tr><td>Lag 1</td><td>Lag 2</td><td>Lag 1</td><td>Lag 2</td></tr><tr><td rowspan="3">Supply of low-skilled workers</td><td>-5.420[-2.918]</td><td>-4.685[-2.919]</td><td>-7.593[-2.917]</td><td>-7.595[-2.917]</td><td></td></tr><tr><td>(0.0000)</td><td>(0.0001)</td><td>(0.0000)</td><td>(0.0000)</td><td>Intercept</td></tr><tr><td>-7.093</td><td>-4.898</td><td>-7.937</td><td>-7.947</td><td></td></tr><tr><td rowspan="3">Low-skills wages</td><td>[-2.918]</td><td>[-2.919]</td><td>[-2.917]</td><td>[-2.917]</td><td>Intercept</td></tr><tr><td>(0.0000)</td><td>(0.0000)</td><td>(0.0000)</td><td>(0.0000)</td><td></td></tr><tr><td>-7.482</td><td>-5.582</td><td>-10.605 [-</td><td>-10.863</td><td></td></tr><tr><td rowspan="3">Supply of highly-skilled workers</td><td>[-2.918]</td><td>[-2.919]</td><td>2.917]</td><td>[-2.917]</td><td>Intercept</td></tr><tr><td>(0.0000)</td><td>(0.0000)</td><td>(0.0000)</td><td>(0.0000)</td><td></td></tr><tr><td>-9.455</td><td>-6.311</td><td>-12.994 [-</td><td>-14.138</td><td></td></tr><tr><td rowspan="3">High-skill wages</td><td>[-2.918]</td><td>[-2.919]</td><td>2.917]</td><td>[-2.917]</td><td>Intercept</td></tr><tr><td>(0.0000)</td><td>(0.0000)</td><td>(0.0000)</td><td>(0.0000)</td><td></td></tr><tr><td>-6.470</td><td>-7.153</td><td>-9.639</td><td>-9.745</td><td></td></tr><tr><td rowspan="3">Work experience</td><td>[-2.918]</td><td>[-2.919]</td><td>[-2.917]</td><td>[-2.917]</td><td>Intercept</td></tr><tr><td>(0.0000)</td><td>(0.0000)</td><td>(0.0000)</td><td>(0.0000)</td><td></td></tr><tr><td>-5.346</td><td>-6.296</td><td>-10.891 [-</td><td>-10.851</td><td></td></tr><tr><td rowspan="3">Unemployment rate</td><td>[-2.918]</td><td>[-2.919]</td><td>2.917]</td><td>[-2.917]</td><td>Intercept</td></tr><tr><td>(0.0000)</td><td>(0.0000)</td><td>(0.0000)</td><td>(0.0000)</td><td></td></tr><tr><td>-7.666</td><td>-3.702</td><td>-11.360 [-</td><td>-11.596</td><td></td></tr><tr><td rowspan="3">Abstract tasks</td><td>[-2.918]</td><td>[-2.919]</td><td>2.917]</td><td>[-2.917]</td><td>Intercept</td></tr><tr><td>(0.0000)</td><td>(0.0041)</td><td>(0.0000)</td><td>(0.0000)</td><td></td></tr><tr><td>-7.997</td><td>-6.570</td><td>-13.152 [-</td><td>-13.830</td><td></td></tr><tr><td rowspan="3">Manual tasks</td><td>[-2.918]</td><td>[-2.919]</td><td>2.917]</td><td>[-2.917]</td><td>Intercept</td></tr><tr><td>(0.0000)</td><td>(0.0000)</td><td>(0.0000)</td><td>(0.0000)</td><td></td></tr><tr><td>-4.779</td><td>-4.211 [-</td><td>-6.193</td><td>-6.225</td><td></td></tr><tr><td rowspan="2">Routine tasks</td><td>[-2.917]</td><td>2.918]</td><td>[-2.916]</td><td>[-2.916]</td><td>Intercept</td></tr><tr><td>(0.0001)</td><td>(0.0006)</td><td>(0.0000)</td><td>(0.0000)</td><td></td></tr></table>
Criterion for the use of lags of occupations of low- and high-skilled workers
<table><tr><td colspan="3">A. Use of lags for low-skilled occupations</td></tr><tr><td>Lags</td><td>Akaike</td><td>Schwarz</td></tr><tr><td>1</td><td>-9.661</td><td>-7.723</td></tr><tr><td>2</td><td>-9.510</td><td>-5.876</td></tr><tr><td>3</td><td>-9.343</td><td>-4.018</td></tr></table>
B. Use of lags for high-skill occupations
<table><tr><td>Lags</td><td>Akaike</td><td>Schwarz</td></tr><tr><td>1</td><td>-7.065</td><td>-5.1273</td></tr><tr><td>2</td><td>-7.772</td><td>-4.13824</td></tr><tr><td>3</td><td>-7.936</td><td>-2.60697</td></tr></table>
Lagrange Multiplier Test (Autocorrelation)
Results by Occupancy Group
A. Low-skilled occupations
<table><tr><td>Lags</td><td>Chi2</td><td>p-value</td></tr><tr><td>1</td><td>64.21</td><td>0.0712</td></tr><tr><td>2</td><td>41.09</td><td>0.7816</td></tr></table>
B. High-skilled occupations
<table><tr><td>Lags</td><td>Chi2</td><td>p-value</td></tr><tr><td>1</td><td>56.33</td><td>0.2198</td></tr><tr><td>2</td><td>48.46</td><td>0.4950</td></tr></table>
<table><tr><td colspan="4">Eigenvalue stability condition</td></tr><tr><td colspan="2">Low-skilled occupations</td><td colspan="2">B. High-skilled occupations</td></tr><tr><td>Eigenvalue</td><td>Modules</td><td>Eigenvalue</td><td>Modules</td></tr><tr><td>-0.6714</td><td>0.6714</td><td>0.06411672+0.86984i</td><td>0.8722</td></tr><tr><td>-0.1516987+0.4340482i</td><td>0.4598</td><td>0.06411672-0.86984i</td><td>0.8722</td></tr><tr><td>-0.1516987-0.4340482i</td><td>0.4598</td><td>-0.3264933+0.8075064i</td><td>0.8710</td></tr><tr><td>-0.3604381+0.1716256i</td><td>0.3992</td><td>-0.3264933-0.8075064i</td><td>0.8710</td></tr><tr><td>0.3604-0.1716i</td><td>0.3992</td><td>-0.8638</td><td>0.8638</td></tr><tr><td>-0.117933+0.2516725i</td><td>0.2779</td><td>0.570062+0.5161317i</td><td>0.7690</td></tr><tr><td>0.117933-0.2516725i</td><td>0.2779</td><td>0.570062-0.5161317i</td><td>0.7690</td></tr><tr><td></td><td></td><td>-0.733799+0.1396912i</td><td>0.7470</td></tr><tr><td></td><td></td><td>-0.733799-0.1396912i</td><td>0.7470</td></tr><tr><td></td><td></td><td>-.04290698+0.6069034i</td><td>0.7433</td></tr><tr><td></td><td></td><td>-0.4290698-0.6069034i</td><td>0.7433</td></tr><tr><td></td><td></td><td>-0.1342369+0.6702289i</td><td>0.6835</td></tr><tr><td></td><td></td><td>-0.1342369-0.6702289i</td><td>0.6835</td></tr><tr><td></td><td></td><td>-0.5433341+0.2425316i</td><td>0.5950</td></tr><tr><td></td><td></td><td>-.5433341-0.2425316i</td><td>0.5950</td></tr><tr><td></td><td></td><td>0.290594+0.4885347i</td><td>0.5684</td></tr><tr><td></td><td></td><td>0.290594-0.4885347i</td><td>0.5684</td></tr></table>
<table><tr><td></td><td>0.5491506+0.07305788i</td><td>0.5540</td></tr><tr><td></td><td>0.5491506+0.07305788i</td><td>0.5540</td></tr><tr><td></td><td>-0.1416888+0.2047537i</td><td>0.2490</td></tr><tr><td></td><td>-0.1416888-0.2047537i</td><td>0.2490</td></tr></table>
Source: Own elaboration.
Note: Eigenvalues (roots) lie inside the unit circle. The VAR for each skill group meets the stability condition.
[^1]: Since the 1970s, with the development of electronic technology and telecommunications, there has been a growing demand for computers, electronic components and semiconductors that can be used in offices or even autonomous machines with the aim of performing repetitive mechanical assembly tasks that are capable of reducing costs/schedules of operating time to increase the growth of the production of goods and services per worker. _(p.2)_
[^2]: According to Acemoglu (2009), HCTS with a weak equilibrium occurs when high- and low-skilled workers are imperfect substitutes. This explains that when workers are hired by companies, to the extent that new technologies biased towards work with skills are added, it allows the use of technology to make them in different, this leads to noncompensation for the workers' skills, which reduces the wages premium. _(p.4)_
Generating HTML Viewer...
References
34 Cites in Article
D Acemoglu (1998). Why do new technologies complements skills? Directed technical changes and wages inequality.
D Acemoglu (2009). Introduction to modern economic growth.
Daron Acemoglu,David Autor (2010). Skills, Tasks and Technologies: Implications for Employment and Earnings.
Daron Acemoglu,David Autor (2012). What Does Human Capital Do? A Review of Goldin and Katz's<i>The Race between Education and Technology</i>.
Daron Acemoglu (2002). Directed Technical Change.
Daron Acemoglu,David Autor (2011). Skills, Tasks and Technologies: Implications for Employment and Earnings.
Daron Acemoglu,Pascual Restrepo (2022). Tasks, Automation, and the Rise in U.S. Wage Inequality.
D Autor,L Katz,A Krueger (1998). Computing Inequality: Have Computers Changed the Labor Market?.
D Autor,F Levy,R Murnane (2003). The Skill Content of Recent Technological Change: An Empirical Exploration.
Zsófia Bárány,Christian Siegel (2020). Biased technological change and employment reallocation.
G Becker (1962). Investment in human capital: A theoretical analysis.
M Ballestar,A García,J Sainz (2020). Todos los caminos llevan a la educación: Un primer análisis de la robotización, la educación y el empleo.
Francisco Buera,Joseph Kaboski,Richard Rogerson (2020). Skill Biased Structural Change.
C Calderón,G Ochoa,L Huesca (2017). Mercado laboral y cambio tecnológico en el sector manufacturero mexicano (2005-2014).
David Card,John Dinardo (2002). Skill‐Biased Technological Change and Rising Wage Inequality: Some Problems and Puzzles.
W Enders (2004). Applied econometric times series.
Georg Graetz,Guy Michaels (2018). Robots at Work.
Terry Gregory,Anna Salomons,Ulrich Zierahn (2019). Racing with or Against the Machine? Evidence from Europe.
No ethics committee approval was required for this article type.
Data Availability
Not applicable for this article.
How to Cite This Article
Jonathan Andrey Barrandey Chavira. 2026. \u201cEffects of Technological Change on the Labor Market in Mexico: An Analysis of Autoregressive Vectors for the Manufacturing Sector, 2005-2021\u201d. Global Journal of Human-Social Science - E: Economics GJHSS-E Volume 24 (GJHSS Volume 24 Issue E2): .
Explore published articles in an immersive Augmented Reality environment. Our platform converts research papers into interactive 3D books, allowing readers to view and interact with content using AR and VR compatible devices.
Your published article is automatically converted into a realistic 3D book. Flip through pages and read research papers in a more engaging and interactive format.
This paper presents an analysis of the effect of technological change on the labor market in the manufacturing sector in Mexico, in the period 2005-2021. Based on the human capital theory and the biased technological change approach, we study whether the manufacturing labor market presents a skills-biased technological change based on the correspondence between groups of low-and high-skilled workers in relation to the distribution of tasks: abstract, manual and routine. The objective is to show, through separate equations, whether the supply of skilled workers is related to abstract tasks and, on the other hand, whether unskilled work is assigned to manual and routine tasks. Through a VAR analysis, in general, consistent evidence is shown that the future of the supply of skilled labor is explained by abstract tasks..
Our website is actively being updated, and changes may occur frequently. Please clear your browser cache if needed. For feedback or error reporting, please email [email protected]
Thank you for connecting with us. We will respond to you shortly.