The steep rise in human life expectancy has resulted in a substantial increase in older people population particularly in the age group of 80 years and above. According to the National Policy for Senior Citizens, March 2011, the Indian demographic profile shows that in 2000-2050 the population in the age group 60 years to 70 years will increase by 326% and in 80 years above will increase by 700%. It has been seen that out of the total World Elderly Population, 1/8 of them resides in India. The elderly population in India never retires in its strict sense and they continue to work as long as they are physically capable to do. As aging is inevitable and physical infirmity entrails age, this result in steep decline in earning that eventually amounts to poor savings and decline in standard of living. It has been observed that most of the senior citizens of India live in destitute, therefore old age income security is one of the greatest challenges amongst the senior citizens. A lot of aspects of their standard of living have been taken into account by the government of India to ensure their social security namely, economic, health, socioeconomic and shelter to propose adequate social security schemes.
## I. INTRODUCTION

ne of the inevitable truths of life is aging that will bring unique challenges in its every step. It may not target the senior citizens, but it is they who gets affected the most[^1]. From ancient times, it was the duty of the family to take care of the infirm senior citizens of the family that included both psychological and physical ailments but with time this ethical consideration has been fading away[^2]. The rampant change in the family structure have exposed the vulnerability of the senior citizens particularly to physical and economic insecurity[^3]. Subsequently, Maintenance and Welfare of Parents and Senior Citizens Act, 2007 has been enacted to ensure the socio economical and healthcare security of the senior citizens in India[^4]. Likewise, India formulated two National Policies in 1999 and another in 2011 for address the needs of the senior citizens in its strict sense[^5]. In light of the National Policies, the Central Government as well as the State Government have introduced a number of welfare schemes for the care and maintenance of the senior citizens that not only addresses the healthcare security but also includes financial security and social security.
### a) List of Welfare Schemes introduced by Central Government
The list of welfare schemes introduced by Central Government for the socio-economic wellbeing of the senior citizens are as follows[^6]
1. Rashtriya Vayoshri Yojana, 2017 - seeks to assist the BPL senior citizens by providing assisted living aids and devices.
2. Atal Pension Yojana, 2015 - seeks to assist the workers of unorganized sector to save for their retirement as pension.
3. Atal Vayo Abhyuday Yojana, 2021 - seeks to provide opportunities to improve the quality of life of BPL categorized senior citizens like medical care, shelter, food, entertainment.
4. Indira Gandhi National Old Age Pension Scheme, 2007 - seeks to provide financial aid to the BPL categorized senior citizen.
5. Indira Gandhi Widow Pension Scheme, 2009 - seeks to provide Social Security today BPL widowed senior citizen.
6. Indira Gandhi Disability Pension Scheme, 2009 - seeks to provide Social Security to the mentally and physically disabled senior citizens.
7. National Family Benefit Scheme, 1995 - seeks to provide financial support to BPL categorized families on account of the death of the primary breadwinner of the family.
8. Annapurna Scheme, 2000 - seeks to provide food security to senior citizens who are not covered under National Old Age Pension Scheme.
9. Scheme of Integrated Program for Senior Citizens, 1992 - seeks to improve the quality of life by ensuring basic amenities like shelter, food, medical care and entertainment opportunities.
10. Rashtriya Swasthya Bima Yojana, 2013 - seeks to provide medical insurance to the BPL categorized senior citizens in case of sudden hospitalization expenses.
11. Pradhan Mantri Jan Arogya Yojana, 2018 - seeks to provide cashless medical insurance to economically disadvantaged group of the Indian society.
12. Varishtha Pension Bima Yogana, 2003 - seeks to provide social and financial security at times of fall in income due to unforeseen market conditions to the senior citizens.
13. Post Office Senior Citizen Saving Scheme, 2015 - seeks to provide financial stability to VRS or superannuation retired senior citizens.
14. Pradhan Mantri Vaya Vandana Yojana, 2017 - seeks to provide socio economical security against future fall of market conditions to the senior citizens.
15. Antyodaya Anna Yojana, 2000 - seeks to provide food at subsidy to the BPL categorized senior citizens.
b) List of Welfare Schemes introduced by West Bengal Government
The list of welfare schemes introduced by West Bengal Government for the socio-economic wellbeing of the senior citizens are as follows[^7]:
1. West Bengal Old Age Pension Scheme, 2010 – seeks to provide a sum of Rs. 1000 per month to
- the senior citizens residing in West Bengal for more than 10 years to ensure their social security.
2. West Bengal Widow Pension Scheme, 2010 – seeks to provide a sum of Rs. 1000 to the widowed women irrespective of age who has been residing in West Bengal for more than 10 years and has monthly income less than Rs. 1000 to ensure their adequate standard of living.
3. West Bengal Manabik Pension Scheme, 2010 - seeks to provide a sum of Rs. 1000 to the senior citizens who are physically incapacitated to work to ensure the social security.
4. West Bengal Swasthya Sathi Scheme, 2016 – seeks to provide cashless medical insurance upto Rs. 5,00,000 per year to ensure healthcare security irrespective of age and gender.
## II. RESEARCH METHODOLOGY
Data has been collected through questionnaire. 50 responses have been collected from each of the three districts of West Bengal namely, Kolkata, North 24 Parganas, South 24 Parganas that amounts to a total of 150 responses. The rationale behind choosing these three districts is Kolkata has the highest density per kilometre, North 24 Parganas has the highest population and South 24 Parganas covers the largest area in the State of West Bengal as per the census data 2011. Convenient random sampling was adopted while collecting the data. The population of the survey was senior citizens above 60 years of age. Statistical analysis is being performed for those collected data to understand different aspects of in dependent variables like Monthly income, Monthly expenditure, occupation, qualification with respect to awareness of different schemes by senior citizen and also to examine the correlation between those independent factors.
## III. SIGNIFICANCE OF THE STUDY
This is pertinent to analyse how far the senior citizens particularly in the State of West Bengal are realizing the benefits of the same. This study would help to understand the efficacy of the welfare schemes as well as help to note the challenges that affects the ultimate realization of the benefits guaranteed to the senior citizens under these welfare schemes for their social security.
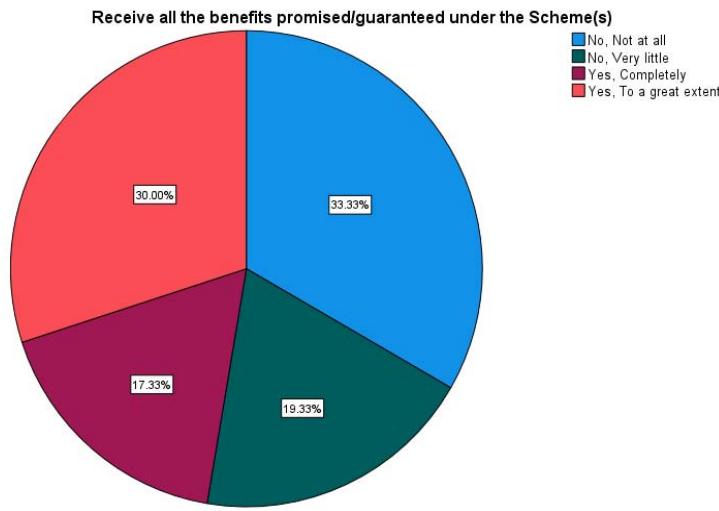
Figure 1: Senior Citizens Receiving all the Benefits Promised/Guaranteed under the Scheme(s)
Figure 1 clearly shows that out to the total 150 responses, $33.33\%$ of the senior citizens of West Bengal do not receive the benefits guaranteed to them under the welfare schemes and $19.33\%$ of them receive a very little portion of the benefits assured to them. It is only $30\%$ of them who receives the benefits in its true sense. Thus, there is a need to find out the appropriate reason for the differences in opinions.
### a) Statistical Analysis
Dependent Variable: Try to access the benefits of the Schemes
Independent Variable: Qualification, Occupation, Monthly Income, Monthly Expenditure, ANOVA testing
Table 1: ANOVA for Accessing Benefit of Schemes Corresponding to Independent Variables
<table><tr><td colspan="6">ANOVAa,b</td></tr><tr><td>Source</td><td>Sum of Squares</td><td>df</td><td>Mean Square</td><td>F</td><td>Sig.</td></tr><tr><td>Regression</td><td>15.379</td><td>13</td><td>1.183</td><td>1.098</td><td>.366</td></tr><tr><td>Residual</td><td>146.594</td><td>136</td><td>1.078</td><td></td><td></td></tr><tr><td>Total</td><td>161.973</td><td>149</td><td></td><td></td><td></td></tr></table>
- This present ANOVA model mainly investigates how independent variables such as qualification, occupation, monthly income, and monthly expenditure affect the dependent variables, that is the attempt to access the benefits of the schemes.
- Here also determine the significance level of this model by examining the p-value. Mainly the regression model defines the sum of squares of
15.379 also, with the F-value of 1.098. With this, the significant value level is 0.366 also.
- On the other, side, the P-value is above the conservative beginning of 0.05 also, which also suggests the independent variables collectively do not have a statistically effective impact on the dependent variables in this ANOVA model.
### b) Chi-Square Testing (Qualification * Try to access the benefits of the Schemes)
Table 2: Data for Qualification Related to Accessing Schemes
<table><tr><td colspan="7">Crosstab</td></tr><tr><td colspan="7">Count</td></tr><tr><td rowspan="2" colspan="2"></td><td colspan="4">Try to access the benefits of the Schemes</td><td rowspan="2">Total</td></tr><tr><td>Yes, To a great extent</td><td>Yes, Somewhat</td><td>Yes, Very little</td><td>No, Not At All</td></tr><tr><td rowspan="4">Qualification</td><td>Below Class X</td><td>12</td><td>18</td><td>20</td><td>8</td><td>58</td></tr><tr><td>Below Graduation</td><td>6</td><td>11</td><td>10</td><td>14</td><td>41</td></tr><tr><td>Below Post Graduation</td><td>3</td><td>11</td><td>9</td><td>11</td><td>34</td></tr><tr><td>Above Post Graduation</td><td>3</td><td>4</td><td>3</td><td>7</td><td>17</td></tr><tr><td colspan="2">Total</td><td>24</td><td>44</td><td>42</td><td>40</td><td>150</td></tr></table>
Table 3: Chi-square Test for Qualification Related to Accessing Schemes
<table><tr><td colspan="4">Chi-Square Tests</td></tr><tr><td></td><td>Value</td><td>df</td><td>Asymptotic Significance (2-sided)</td></tr><tr><td>Pearson Chi-Square</td><td>10.374a</td><td>9</td><td>.321</td></tr><tr><td>Likelihood Ratio</td><td>11.072</td><td>9</td><td>.271</td></tr><tr><td>Linear-by-Linear Association</td><td>3.744</td><td>1</td><td>.053</td></tr><tr><td>N of Valid Cases</td><td>150</td><td></td><td></td></tr><tr><td colspan="4">a. 4 cells (25.0%) have an expected count of less than 5. The minimum expected count is 2.72.</td></tr></table>
- Mainly Chi-square test investigates the relationship between the qualification as well as attempts to assess the advantages of the scheme.
- The value of the person chi-square is 10.374 the df (degree of freedom) value is 9 and the significance value is 0.321, these values also represent not any statistically significant association between the qualification and accessing scheme advantages.
- The second test shows the chi-square value of the Likelihood ratio is 11.072 and the significance value
### c) Chi-Square Testing (Occupation \* Try to access the benefits of the Schemes)
is 0.271 also, which also emphasizes the lack of significance.
- The third test also shows the chi-square value is 3.744 and the significance value is 0.053, that likely significant, whatever remains the above threshold.
- Here also the null hypothesis is met, as the chi-square value is 0.321, that also indicating no effective gap.
Table 4: Data for Occupation Related to Accessing Schemes
<table><tr><td colspan="7">Crosstab</td></tr><tr><td colspan="7">Count</td></tr><tr><td rowspan="2" colspan="2"></td><td colspan="4">Try to access the benefits of the Schemes</td><td rowspan="2">Total</td></tr><tr><td>Yes, To a great extent</td><td>Yes, Somewhat</td><td>Yes, Very little</td><td>No, Not At All</td></tr><tr><td rowspan="5">Occupation</td><td>Government Service (Retired/Working)</td><td>6</td><td>5</td><td>5</td><td>6</td><td>22</td></tr><tr><td>Private Service (Retired/Working)</td><td>1</td><td>6</td><td>4</td><td>5</td><td>16</td></tr><tr><td>Business</td><td>0</td><td>2</td><td>1</td><td>1</td><td>4</td></tr><tr><td>Professional (Please Specify)</td><td>3</td><td>10</td><td>11</td><td>11</td><td>35</td></tr><tr><td>Unemployed</td><td>14</td><td>21</td><td>21</td><td>17</td><td>73</td></tr><tr><td colspan="2">Total</td><td>24</td><td>44</td><td>42</td><td>40</td><td>150</td></tr></table>
Table 5: Chi square test for Qualification Related to Accessing Schemes
<table><tr><td colspan="4">Chi-Square Tests</td></tr><tr><td></td><td>Value</td><td>df</td><td>Asymptotic Significance (2-Sided)</td></tr><tr><td>Pearson Chi-Square</td><td>\(7.483^a\)</td><td>12</td><td>.824</td></tr><tr><td>Likelihood Ratio</td><td>8.223</td><td>12</td><td>.767</td></tr><tr><td>Linear-by-Linear Association</td><td>.012</td><td>1</td><td>.914</td></tr><tr><td>N of Valid Cases</td><td>150</td><td></td><td></td></tr><tr><td colspan="4">a. 9 cells (45.0%) have an expected count of less than 5. The minimum expected count is.64.</td></tr></table>
- The results of the chi-square test also indicate the connection between the categorical variables. The
person's chi-square value is 7.483 and the significance P-value is 0.824.
- Other side, for likelihood ratio value, is 8.223 and the significance p-value is 0.767 also, both the p-values are higher than the significance value (0.05), which also represents there is not any statistically significant relationship between Occupation and Trying to access the benefits of the Schemes.
- Furthermore, $45\%$ of cells have also an expected count of less than 5, which might impact the reliability of the test results. This investigation also suggests that this data might not be well-suited for this test.
Here also the null hypothesis is met, demonstrating no effective association between the factors, as their p-value is higher than 0.05.
### d) Chi-Square Testing (Monthly Income * Try to access the benefits of the Schemes)
Table 6: Data for Monthly Income Related to Accessing Schemes
<table><tr><td colspan="7">Crosstab</td></tr><tr><td colspan="7">Count</td></tr><tr><td rowspan="2" colspan="2"></td><td colspan="4">Try to access the benefits of the Schemes</td><td rowspan="2">Total</td></tr><tr><td>Yes, To a great extent</td><td>Yes, Somewhat</td><td>Yes, Very little</td><td>No, Not At All</td></tr><tr><td rowspan="4">Monthly Income</td><td>Less than 10,000/-</td><td>15</td><td>22</td><td>22</td><td>16</td><td>75</td></tr><tr><td>10,000/- to 30,000/-</td><td>3</td><td>13</td><td>11</td><td>10</td><td>37</td></tr><tr><td>30,000/- above</td><td>5</td><td>9</td><td>8</td><td>13</td><td>35</td></tr><tr><td>60,000/- above</td><td>1</td><td>0</td><td>1</td><td>1</td><td>3</td></tr><tr><td colspan="2">Total</td><td>24</td><td>44</td><td>42</td><td>40</td><td>150</td></tr></table>
Table 7: Chi square test for Monthly Income Related to Accessing Schemes
<table><tr><td colspan="4">Chi-Square Tests</td></tr><tr><td></td><td>Value</td><td>df</td><td>Asymptotic Significance (2-sided)</td></tr><tr><td>Pearson Chi-Square</td><td>\(7.019^a\)</td><td>9</td><td>.635</td></tr><tr><td>Likelihood Ratio</td><td>7.930</td><td>9</td><td>.541</td></tr><tr><td>Linear-by-Linear Association</td><td>2.116</td><td>1</td><td>.146</td></tr><tr><td>N of Valid Cases</td><td>150</td><td></td><td></td></tr><tr><td colspan="4">a. 4 cells (25.0%) have an expected count of less than 5. The minimum expected count is.48.</td></tr></table>
- This present chi-square test also investigates the relationship between the monthly income and the attempt to access the advantages of the schemes.
- The person's chi-square value is 7.019 also with a DF value of 9, as well as a significance p-value of 0.635.
- The significance p-value is greater than the level of significance (0.05), this result also represents no statistical significance between these two variables.
- Moreover, $25\%$ of the cells have expected counts lower than 5, which represents a potential limitation in the sample.
- The hypothesis that there is not an effective association between the factors met as indicating by the higher rate of p-value.
### e) Chi-Square Testing (Monthly Expenditure \*Try to access the benefits of the Schemes)
Table 8: Data for Monthly Expenditure Related to Accessing Schemes
<table><tr><td colspan="7">Crosstab</td></tr><tr><td colspan="7">Count</td></tr><tr><td rowspan="2" colspan="2"></td><td colspan="4">Try to access the benefits of the Schemes</td><td rowspan="2">Total</td></tr><tr><td>Yes, To a great extent</td><td>Yes, Somewhat</td><td>Yes, Very little</td><td>No, Not At All</td></tr><tr><td rowspan="4">Monthly Expenditure</td><td>Less than 5,000/-</td><td>7</td><td>17</td><td>20</td><td>9</td><td>53</td></tr><tr><td>6,000/- to 15,000/-</td><td>13</td><td>20</td><td>18</td><td>15</td><td>66</td></tr><tr><td>15,000/- above</td><td>4</td><td>6</td><td>4</td><td>15</td><td>29</td></tr><tr><td>30,000/- above</td><td>0</td><td>1</td><td>0</td><td>1</td><td>2</td></tr><tr><td colspan="2">Total</td><td>24</td><td>44</td><td>42</td><td>40</td><td>150</td></tr></table>
Table 9: Chi Square test for Monthly Income Related to Accessing Schemes
<table><tr><td colspan="4">Chi-Square Tests</td></tr><tr><td></td><td>Value</td><td>df</td><td>Asymptotic Significance (2-sided)</td></tr><tr><td>Pearson Chi-Square</td><td>16.359a</td><td>9</td><td>.060</td></tr><tr><td>Likelihood Ratio</td><td>16.287</td><td>9</td><td>.061</td></tr><tr><td>Linear-by-Linear Association</td><td>2.719</td><td>1</td><td>.099</td></tr><tr><td>N of Valid Cases</td><td>150</td><td></td><td></td></tr><tr><td colspan="4">a. 5 cells (31.3%) have an expected count of less than 5. The minimum expected count is.32.</td></tr></table>
- This test is also helpful in investigating the relation between the monthly expenditure as well as the likelihood of trying to access the advantages of the schemes.
- The value of the person chi-square is 16.359, with this the p-value (significance value) is 0.060, which also suggests slightly above the conventional effective threshold of 0.05. This also represents a borderline non-significant connotation.
- On the other side, the likelihood ratio as well as the linear-by-linear association also represents similar results.
- Nevertheless, $31.3\%$ of the cells have expected counts lower than 5, which might impact the test's dependability.
- This also represents that the sample size might need adjustment for perfect or accurate outputs.
- Here the null hypothesis is met, representing no significant connotation between the variables as the p-value (significance value) is above 0.05.
### f) Correlation Analysis
Table 10: Correlation Analysis for All Independent Factors
<table><tr><td colspan="7">Correlations</td></tr><tr><td colspan="2"></td><td>Qualification</td><td>Occupation</td><td>Monthly Income</td><td>Monthly Expenditure</td><td>Try to access the benefits of the Schemes</td></tr><tr><td rowspan="3">Qualification</td><td>Pearson Correlation</td><td>1</td><td>-.456**</td><td>.639**</td><td>.469**</td><td>.159</td></tr><tr><td>Sig. (2-tailed)</td><td></td><td>.000</td><td>.000</td><td>.000</td><td>.053</td></tr><tr><td>N</td><td>150</td><td>150</td><td>150</td><td>150</td><td>150</td></tr><tr><td rowspan="3">Occupation</td><td>Pearson Correlation</td><td>-.456**</td><td>1</td><td>-.510**</td><td>-.380**</td><td>-.009</td></tr><tr><td>Sig. (2-tailed)</td><td>.000</td><td></td><td>.000</td><td>.000</td><td>.915</td></tr><tr><td>N</td><td>150</td><td>150</td><td>150</td><td>150</td><td>150</td></tr><tr><td rowspan="3">Monthly Income</td><td>Pearson Correlation</td><td>.639**</td><td>-.510**</td><td>1</td><td>.625**</td><td>.119</td></tr><tr><td>Sig. (2-tailed)</td><td>.000</td><td>.000</td><td></td><td>.000</td><td>.146</td></tr><tr><td>N</td><td>150</td><td>150</td><td>150</td><td>150</td><td>150</td></tr><tr><td rowspan="3">Monthly Expenditure</td><td>Pearson Correlation</td><td>.469**</td><td>-.380**</td><td>.625**</td><td>1</td><td>.135</td></tr><tr><td>Sig. (2-tailed)</td><td>.000</td><td>.000</td><td>.000</td><td></td><td>.099</td></tr><tr><td>N</td><td>150</td><td>150</td><td>150</td><td>150</td><td>150</td></tr><tr><td rowspan="3">Try to access the benefits of the Schemes</td><td>Pearson Correlation</td><td>.159</td><td>-.009</td><td>.119</td><td>.135</td><td>1</td></tr><tr><td>Sig. (2-tailed)</td><td>.053</td><td>.915</td><td>.146</td><td>.099</td><td></td></tr><tr><td>N</td><td>150</td><td>150</td><td>150</td><td>150</td><td>150</td></tr><tr><td colspan="7">**. Correlation is significant at the 0.01 level (2-tailed).</td></tr></table>
- This correlation model also investigates the connections between qualification, occupation, income monthly, and monthly expenditure.
- Between the qualification and the monthly income, there is also a significant relation. The correlation value between these two variables is 0.639 also.
- The correlation value between qualification and monthly expenditure is 0.469 also, that indicates a moderate correlation between these two variables.
- There is also indicated a strong relation between monthly income and monthly expenditure. The correlation value between these two variables is 0.625 also.
- The correlation value is negative between occupation and qualification, the correlation value is -0.456 also.
- On the other hand the correlation value between "trying to access the advantages of the schemes" as well as other variables is poor and not statistically significant.
## IV. CONCLUSION
In this case the benefit of schemes is not highly dependent on each factor like Qualification, Occupation, Monthly income, monthly expenditure etc. This is significant to understand that the other factors have less affect for the benefit of the scheme (Table-1). Hence, Qualification, Occupation, Monthly income, Expenditure does not able to affect the awareness of the benefit of the scheme.
Corresponding to Table 2-9, Chi-square test has been performed to assess the advantages of the scheme with respect to independent factors like Qualification, Occupation, Monthly income, monthly expenditure. In all cases it has been observed that these factors are not statistically significant for a person to assessing the advantages of the scheme corresponding to the data set. Therefore, it shows that the independent factors individually are not affecting the awareness of a person.
Between all independent factors, correlation is performed and it is showing significant correlation between qualification and the monthly income, monthly income and monthly expenditure which means the growth of one factor will be responsible for the growth of other factor (Table-10). It means the growth of qualification will rise the monthly income and the raise of monthly income will rise the monthly expenditure.
## V. RECOMMENDATIONS
Based on the above conclusion, the following can be recommended:
1. An increase in awareness program would help the senior citizens to enlighten them on the welfare schemes dedicated to their social security[^8]. Section 21 of the Maintenance and Welfare of Parents and Senior Citizens Act, 2007 explicitly talks about the publicity and awareness training of the provisions of
- the Act through the social media[^9]. This is high time that the governmental bodies or NGOs should take interest in publicizing the provisions of the Act. Nevertheless, the schemes introduced by the State Government must be publicized in the same manner to ensure the uniform implementation of the schemes[^10].
2. An introduction of a Nodal Officer or dedicated platform can again help the senior citizens to seek quick and easy access to the solutions of the problems faced by them[^11]. The Maintenance and Welfare of Parents and Senior Citizens Bill, 2019 under Section 23 has suggested for the same in each district[^12].
3. A uniform national helpline no. for the senior citizens can also be a great help to those who have restricted autonomy or mobility. Currently, the HelpAge India operates a toll-free helpline no. (1800-180-1253), however it is operative only in 15 states. Furthermore, the Ministry of Social Justice and Empowerment has introduced an elderly helpline no. (14567) but the service is limited to 6 states only[^13].
4. A frequent survey by the local municipalities or corporations or inspections by ward counsellors can be fruitful in finding out the current distress or challenges faced by the senior citizens in that locality and such report of the survey can be presented before the State Government so that the challenges can be addressed in its true sense[^14].
This needs to be borne in mind that the senior citizens are the prized possession of our society[^15]. Their welfare is not only the responsibility of the State but also ours. The personals laws depict the rich culture of the Indian society. The Hindu Adoption and Maintenance Act, 1956, under Section 20 talks about the obligation of the children to maintain their infirm and aged parents[^16].
The Mohammedan law on the other hand talks about the maintenance of not only of the infirm parents but also all aged infirm elderly relatives if they have sufficient means to maintain them[^17].
In Baban Alias Madhav Dagadu Dange vs. Parvatibai Dagadu Dange[^18], the Bombay High Court observed that although in the General Clauses Act, the expression 'mother' has not been defined but it does not mean that it shall be restricted in its strict sense and thus if the expression 'father' can include natural as well as adoptive father, the expression 'mother' can be interpreted in its wide sense to include both natural and adoptive mother. Thus, the Court concluded that even an adoptive mother has the right to claim maintenance from her children. In Kirtikant D. Vadodaria vs. State of Gujarat and Ors.[^19], the Supreme Court ruled that even a step-mother who is incapable of maintaining herself can claim maintenance from her step-son. Even a married daughter is liable to pay for the maintenance of her parents provided they are incapable of maintaining themselves as ordered by the Supreme Court in Vijay Manohar Arbat vs. Kashirao Rajaram Sawai[^20]. In Dr. Ashwani Kumar vs. Union of India & Ors[^21], in light of M/S Shantistar Builders vs. Narayana Khimalal Totame and Ors[^22], the Supreme Court pointed out that adequate accommodation plays a significant role in the intellectual and physical well-being of a senior citizen, therefore besides medical care, reasonable management of old age homes are also instrumental for the wellness of the senior citizens. Since, the right to life with dignity as enshrined under Article 21 of the Indian Constitution applies to all[^23], the senior citizens as well reserve their due right to live their remaining period of life with heads held high in peace.
$^{17}$ Kumar R and Vishwakarma M, 'Maintenance of Elderly People: A Critical Analysis of the Existing Legal Provisions in India' (2019) 6 IJRAR- International Journal of Research and Analytical Reviews 490 $^{18}$ Baban Alias Madhav Dagadu Dange vs. Parvatibai Dagadu Dange (1980 CrIJ256 = 1980 (82) BOMLR 116) $^{19}$ Kirtikant D. Vadodaria vs. State of Gujarat and Ors. (1996) 4 SCC 479 $^{20}$ Vijay Manohar Arbat vs. Kashirao Rajaram Sawai AIR 1987 SC 1100 $^{21}$ Dr. Ashwani Kumar vs. Union of India & Ors CWP No. 193 of 2016 $^{22}$ M/S Shantistar Builders vs. Narayana Khimalal Totame and Ors, AIR 1990 SC 630 $^{23}$ Indian Constitution 1950, art 21
[^1]: Sharma S and Bluck S, 'Older Adults Recall Memories of Life Challenges: The Role of Sense of Purpose in the Life Story' (2022) 42 Current Psychology 23464 _(p.1)_
[^2]: M. Kalavar J, Duwuru J and Thomas Jr. E, 'Caregiving for Older Adults in India: The Role of Kinship and Non-Kinship Networks' (2020) 02 Indian Journal of Health Studies 63 _(p.1)_
[^3]: Lieber J and others, 'Changing Family Structures and Self-Rated Health of India's Older Population (1995 _(p.1)_
[^4]: Sanevata Devi, and Vikas Kumar Jain, 'Problems and Rights of Senior Citizens in India' (2020) 4 Legal Research Development 40 _(p.1)_
[^5]: $^{5}$ Bhavani KA and Sasidhar AP, 'National Policy for Senior Citizen in Indian Context - A Thematic Study' (2017) 6 Global Journal for Research Analysis 152 _(p.1)_
[^6]: 'Senior Citizens| National Portal of India' (National Portal of India) accessed 27 December 2024 _(p.1)_
[^7]: 'Official Website of Barrackpore Sub-Division' (Social Welfare Department) accessed 27 December 2024 _(p.2)_
[^9]: The Maintenance and Welfare Of Parents And Senior Citizens Act 2007, s 21(i) _(p.7)_
[^10]: Abadana (a scheme for welfare and protection of senior citizens) | Social Security & Empowerment of Persons with Disabilities Department, accessed 27 December 2024 _(p.7)_
[^11]: Banerjee R, 'A Critical Analysis of The MWPSC Act in Light of the 2019 Bill and Other Decided Cases' (2021) VI NUJS Journal of Regulatory Studies 1 _(p.7)_
[^12]: Maintenance and Welfare of Parents and Senior Citizens Bill 2019, s 23(2) _(p.7)_
[^13]: 'Elder Helplines' (HelpAge India, 18 November 2024) accessed 27 December 2024 _(p.7)_
[^14]: Kurian A and others, 'An Investigation into the Problems of the Elderly Residents of Kolkata Municipal Corporation' (2023) 8 International Journal of Innovative Science and Research Technology 2035 _(p.7)_
[^15]: Jaspreet Kaur Hanspal, 'Rights and Dignity of Senior Citizens A Socio - Legal Analysis' (2022) 6 Legal Research Development 19 _(p.7)_
[^16]: Hindu Adoption and Maintenance Act 1956, s 20 _(p.7)_
Generating HTML Viewer...
Funding
No external funding was declared for this work.
Conflict of Interest
The authors declare no conflict of interest.
Ethical Approval
No ethics committee approval was required for this article type.
Data Availability
Not applicable for this article.
Dr. Sarbani Bhowmick. 2026. \u201cEfficacy and Realization of Welfare Schemes for Senior Citizens in Kolkata, North & South 24 Parganas Districts of West Bengal: A Statistical Analysis\u201d. Global Journal of Human-Social Science - H: Interdisciplinary GJHSS-H Volume 25 (GJHSS Volume 25 Issue H3): .
The steep rise in human life expectancy has resulted in a substantial increase in older people population particularly in the age group of 80 years and above. According to the National Policy for Senior Citizens, March 2011, the Indian demographic profile shows that in 2000-2050 the population in the age group 60 years to 70 years will increase by 326% and in 80 years above will increase by 700%. It has been seen that out of the total World Elderly Population, 1/8 of them resides in India. The elderly population in India never retires in its strict sense and they continue to work as long as they are physically capable to do. As aging is inevitable and physical infirmity entrails age, this result in steep decline in earning that eventually amounts to poor savings and decline in standard of living. It has been observed that most of the senior citizens of India live in destitute, therefore old age income security is one of the greatest challenges amongst the senior citizens. A lot of aspects of their standard of living have been taken into account by the government of India to ensure their social security namely, economic, health, socioeconomic and shelter to propose adequate social security schemes.
Our website is actively being updated, and changes may occur frequently. Please clear your browser cache if needed. For feedback or error reporting, please email [email protected]
×
This Page is Under Development
We are currently updating this article page for a better experience.
Thank you for connecting with us. We will respond to you shortly.