Enhancing Hajj Pilgrim Satisfaction: A Strategic Analysis of Service Quality Dimensions using the Analytic Hierarchy Process (AHP) in Alignment with Saudi Vision 2030
Saudi Arabia every year receives more than two million Muslims from all over the world to perform the Hajj (the Muslim pilgrimage to Makkah). “It must take place during a specific period of the year in a specific and limited space.” (“Asma BAHURMOZ | Faculty Member | Prof of Operations Research | King …”) To manage and satisfy such crowd, Considering the variety of cultures, languages, and different levels of socio-economic background, is next to impossible. Saudi vision 2030 has taken it as its duty to ensure that pilgrimages will have joyful experience and good memories to take back home. Authorities develop four categories of packages based on quality dimensions to meet different budgets. To manage and provide quality service for the pilgrimages is incredibly challenging task. In an effort from the authors to direct their research towards this goal. A multi criteria decision model MCDM is developed to evaluate the service quality dimensions (SQD) and identify essential criteria that achieve pilgrim’s satisfaction and keep up with hajj vision 2030, The aim is to provide an easy tool though a scientific one for companies providing these packages to adjust their services to match pilgrims’ expectations.
## I. INTRODUCTION
Hajj is the fifth pillar of Islam and the most significant manifestation of Islamic faith and unity. Undertaking Hajj once is a duty for Muslims who are physically and financially able to make the journey to Makkah. Allah says in the Qur'an [And pilgrimage to the House is a duty unto Allah for mankind, for him who can find a way thither](Aal`Imran 3:97). It must take place during a specific period of the year in a specific and limited space (Bahurmoz, 2006 a).
The Hajj experience brings together people from various socio-economic cultural and ethnic backgrounds the preservation of the tradition and the special atmosphere associated with Hajj can only be achieved through the efficiency of services provided to the pilgrims (Vision2030.gov.sa). Managing and organizing the various Hajj service providers has become increasingly complex as political, social, and environmental issues and problems relating to safety precautions and pilgrims' satisfaction have been added to other factors, including service delivery quality, cost, and service package provision (Grand & Wolff, 2022).
"Although the Hajj, fundamentally, is a religious affair drawing the line between where the rituals stop and where management starts is a difficult undertaking. Managing its operations represents a challenge to the Saudi government which assumes the responsibility and the honour of serving the pilgrims" (Bahurmoz, 2006). It is challenging to provide quality services to such enormous number in small space.
The program for realisation the KSA vision 2030 is to provide an opportunity for the largest possible number of Muslims to fully perform Hajj and Umrah and to work on enriching and enhancing their experience. This is through preparing the Two Holy Mosques, achieving Islam's universal message, preparing tourist and cultural sites, and providing the best services before, during and after their visit to Makkah, Medina, and the Holy Sites. In addition, this program will serve as a platform to confirm the effective role of the private sector to contribute and benefits from the economies of the Hajj season.
Over $100 billion in U.S. dollars has been spent in the last forty years on projects to expand and improve the general infrastructure of the Holy sites, not to mention other expenses incurred by other ministries and organizations that contribute to serve pilgrims directly. For example, the government has begun the Makkah
Metro project, with railroad and train initiatives, to transport pilgrims to the Holy Mosque and holy sites. The transportation network has been strengthened to allow access and help pilgrims perform their trips with more ease and convenience (Grand & Wolff, 2022). These expenditures provide a lucrative source of income for businesses related to service industries. Accommodations, catering, health, and communication services are among the top Hajj expenditures. The income generated from the pilgrims is minuscule in comparison to the investments made by the government. However, it is estimated that income generated this year (2023) through pilgrims from outside the kingdom accounts up to $11\%$ of total national income. To optimize and sustain such source of income there is need for launching a new concept of services provided to pilgrims.
Saudi Arabia has proposed a series of policies to improve the environment for pilgrims through regulatory reforms and tougher rules. These rules are set to guarantee the quality-of-service providers to serve pilgrims with facilities and services according to predetermined quality standards to provide a better experience for the pilgrims. The existing literature cites several studies that have dealt with various aspects of Hajj strategies, policies, and procedures (Bahurmoz, 2006; Eid, 2012; Othman et al., 2019; Mohammed, 2021). However, there is a lack of literature in terms of addressing (SQD) for services provided to pilgrims during Hajj. These services which is known as Hajj package that the external pilgrims must pay for before arrival. And before getting the permit to perform Hajj for internal pilgrims. These packages are classified into four categories and provided by many authorized agents like what is known worldwide tourism agents. This paper will propose an AHP model that identifies essential criteria that are relevant to the evaluation of reliable service standards for the continuous improvement of services provided during Hajj campaigns. The result of this research will be a program of support to policymakers to evaluate the services provided by Hajj campaigns. Service quality is important because it helps both public and private organizations understand and meet customer needs and expectations.
In line with this policy, the objective of this paper is to develop a scientific system to help policy makers and pilgrims as well to evaluate the Hajj services and assess the (SQD) based on pilgrims' preferences. SQD are mixed of tangible and non-tangible factors and of conflict nature when they are compared from point of view of pilgrims who are a small representation of the world population. Thus, we are managing a group multicriteria decision-making problem (GMCDM). Although there are many MCDM tools to manage this type of problems, we have selected the AHP to develop our proposed model. AHP can be applied to complex problems involving conflicting, tangible, and non-tangible, and qualitative and quantitative criteria. It can
manage group decision making problems as well. It is easy to learn and applied however it is based on robust mathematics. Thus, the quality of services provided can be effectively measured within the remit of the MCDM approach (Smith, 2020; Velasquez & Hester, 2013). The importance of this study lies in the analysis of (SQD) and their applicability to Hajj campaigns. This in turn, it will provide insights for decision-makers to control development the services offered to pilgrims.
Service quality is important because it helps both public and private organizations understand and meet customer needs and expectations. Research by Zeitham, Parasurman, and Berry (1985) uncovered five categories of customer preferences in evaluating service quality (Angelova & Zekiri, 2011). SQD helps to measure and improve service quality to increase organizations' profits and maintain a positive reputation (Pakurár et al., 2019). Factors relating to service quality that affect levels of customer satisfaction will be the criteria for our study, and these are Tangibility, Reliability, Assurance, Empathy and Responsiveness (Zeithaml, 2000). The provision of Hajj services depends on housing, transport, healthcare, catering and security (Bahurmoz, 2006). These services are offered to be sold to pilgrims as a single package to choose from four alternatives. Hajj campaigns are classified (A), (B), (C), and (D) based on the diverse services provided. These categories will be analysed through cost-benefit analysis and four packages will be the variants made available to suit all pilgrim's budgets. The result of the study will be an evaluation model to support policy makers in evaluating the services provided by Hajj campaigns. Hajj campaigns as Service providers must constantly evaluate and assess by the SQDs.
This paper will address the definition of service quality dimensions, examine their importance, and look at how they can be used to ensure a consistent level of service quality in haji campaigns to meet and maintain the Hajj vision 2030 in terms of pilgrim satisfaction. If service providers can understand these factors, namely, (SQDs) they will earn the loyalty and respect of their customers (Al-Dhani and Ali, 2019). The remaining of the paper will be devoted to explaining the Hajj context, Methodology, Results, Discussion and Conclusion.
## II. THE SCOPE OF THE PROBLEM
### a) Hajj Vision 2030
The goal of the Pilgrim Experience vision 2030 Program is to enable Muslim pilgrims to enjoy Umrah and Hajj to the greatest extent, and its job is to enrich and enhance the experience of all visitors. This is achieved through the preparation of the two Holy Mosques and other cultural and tourist before, during and after pilgrims' visits to the holy destinations of Medina Munawara and Makkah. The program should
reflect Saudi Arabia's positive image in serving both the pilgrims and the sacred sites (Ministry of Hajj, 2010).
Traveling without a bag, it was launched in 2019 and its aim is to facilitate the pilgrims' visits to the Holy Mosques, and to provide them with the services they require while enriching their cultural and religious experiences (Alsharief et al., 2022; Vision2030.gov.sa). The initiative shortens airport wait times by transporting pilgrims' luggage directly from the airport to their homes. During the 2019 Hajj season, approximately 600,000 bags were delivered to 500,000 pilgrims, reducing airport wait time by $51\%$ and saving over 400,000 working hours. In addition, the Umrah season has been extended to eight months, and the use of cutting-edge technology has decreased the visa waiting period for Hajj and Umrah travellers from fourteen days to five minutes. As a result, the number of Umrah tourists rose from 7.42 million in 2018 to 8.2 million in 2019 (Mohammed & Yaqub, 2024).
These programs were put into effect through the services provided in these categories in the Hajj campaigns. To successfully achieve this, service providers must constantly evaluate and assess the SQDs, which will be considered in the following sections.
### b) The Administration of Hajj
Managing the Hajj pilgrimage is the responsibility of the Ministry of Pilgrimage, overseen by the Supreme Hajj Committee which in turn is responsible to the King of Saudi Arabia in his role as Custodian of the Two Holy Mosques. The ministry coordinates arrangements in Saudi Arabia and abroad, dealing with the arranging, supervision, and implementation of the process. Other ministries also have roles to play in the proceedings, including the ministries of Religious Affairs, Information and Culture, Defence and Aviation, Health, Telecommunications, Interior, and Information Technology. There is also Ministry of Islamic Affairs, Dawa and Guidance. It cares for mosques and manages their assets and endowments (Ministry of Hajj, 2022). Coordination among ministries and other national provisions such as the KSA Red Crescent and the National Guard to prepare for and oversee the annual Hajj is a year-round issue. The costs of the process of enabling visitors to "perform the rites smoothly and comfortably" exceeds 4 billion US dollars. (Henderson, 2010; Ministry of Economy and Planning, 2020). Administering the Hajj is an extremely complicated process in which Saudi Arabia's private and public sectors are deeply involved. The private sector is represented "Tewafa" organizations work as the main organizers of Hajj affairs from the private sector, while two government bodies – the Central Hajj committee at local levels and the Supreme Hajj committee at national level – manage public sector affairs.
Hajj requires systemized management approaches to standardise activities related to the provision of services to pilgrims (Kemenag, 2018; Ahmad et al., 2014). Pilgrims pay fees for the service to perform Hajj, so they demand quality services to live up to their expectations. Those involved in the campaigns do not always know about service quality dimensions that must be in place and available as part of any service provided, regardless of the level of the category of the service. Providers must also be aware of the extent to which these criteria can be achieved and applied in the services provided in all Hajj categories to achieve the Hajj 2030 vision and meet the accepted level of satisfaction for the pilgrims.
## III. METHODOLOGY
### a) The Analytic Hierarchy Process (AHP)
AHP is a well-established MCDM methodology was founded by Saaty in the seventies to help decision makers organize their thought processes, so they lead them to good decisions. It "contributes to solving complex problem by deconstructing it into a hierarchy of undependable criteria, stakeholders, and outcomes and by eliciting judgments to develop priorities" (Saaty, 2016). Each level of the hierarchy consists of a few undependable components that can be devolved into a series of sub-components relating to the decision criteria, the problem, and any potential alternative decisions. Decomposition, priority synthesis and comparative pairwise assessment are the three main principles of AHP. (Saaty, 2016). In using the AHP, one constructs a hierarchy (consisting of goal, criteria, and alternatives), and then makes judgments (or performs measurements) on pairs of elements with respect to a controlling element. Ratio scales are derived from these judgments and then synthesized throughout the structure to select the best alternative (Bahurmoz, 2006 b).
## i. Problem Decomposition
The problem is structured in a hierarchy with a goal at the top and then criteria (and often sub criteria at several levels, for additional refinement) and alternatives of choice at the bottom. (Bahurmoz, 2006 b). The criteria can be subjective or objective depending on the means of evaluating the contribution of the elements below them in the hierarchy. Furthermore, criteria are mutually exclusive, and their priority or importance does not depend on the elements below them in the hierarchy. The number of alternatives should be reasonably small because there would then be a problem with improving the consistency of the judgments. Miller law states that an individual cannot simultaneously compare more than seven objectives (plus or minus two) without becoming confused & Group of citation. (Miller, 1956), ( Saaty & Ozdimer 2003)
Decomposing the problem in a hierarchy serves three purposes:
1. Providing an overall view of the complex relationships inherent in the situation.
2. Capturing the spread of influence from the more important and general criteria to the less important ones.
3. Permitting the decision maker to assess whether he or she is comparing issues of the same order of magnitude in weight or impact on the solution.
Decomposing the problem in a hierarchy structure is an important step. It should be done with thoughtfully matter. Therefore, the literature provides references to help designing the hierarchy, to name only few, Brugha (2004) has provided a complete guideline to structure a problem hierarchically. The Hierarchon (Saaty and Forman, 1993) a dictionary of hierarchically structured decisions and the Encyclicon (Saaty and Ozdemir, 2005), a dictionary of more general network structured decisions.
## ii. Pairwise Comparison
AHP is an absolute scale in which people use numbers to express how much one element dominates another with respect to a common criterion. The scale derived from these absolute numbers is a ratio scale. It does not require units in the comparison. The judgement is a quotient $\frac{a}{b}$ of two quantities $a$ and $b$ having the same units (intensity, meters, utility, etc.). The decision maker does not need to provide a numerical judgement; instead, a relative verbal appreciation, is sufficient. Comparisons are recorded in a positive reciprocal matrix (1).
$$
\mathsf {A} = \left[ \begin{array}{c c c c} 1 & a _ {1 2} & \dots & a _ {1 n} \\a _ {2 1} & \dots & a _ {i j} & \dots \\\dots & a _ {j i} = 1 / a _ {i j} & \dots & \dots \\a _ {n 1} & \dots & \dots & 1 \end{array} \right] \tag {1}
$$
where $a_{ij}$ is the comparison between element $i$ and $j$. If the matrix is perfectly consistent, then the transitivity rule (2) holds for all comparisons:
$$
a _ {i j} = a _ {i k} * a _ {k j} \tag{2}
$$
For example, if $A = 2B$ and $B = 3C$, then it is expected with the transitivity rule (2) that $A = 6C$. However, this is seldom the case because our world is inconsistent by nature. As a minimal consistency is required to derive meaningful priorities, a consistency test was proposed by Saaty (2012).
## iii. Judgement Scale
AHP enable the decision maker to evaluate equally quantitative and qualitative criteria and alternatives on the same preference scale. These can be numerical, verbal, or graphical. The use of verbal
responses is intuitively appealing, and more common in our everyday lives than numbers. Ratio scales are necessary to perform pairwise comparisons, which is the only way to be able to aggregate measurements, as in a weighted sum(Saaty, 1994). The verbal statements are converted into integers from one to nine. The resulting scale is called The Fundamental Scale of Absolute Numbers. It is reproduced below.
The Fundamental Scale of Absolute Numbers
Saaty's nine-point scale
<table><tr><td>Intensity of importance</td><td>Definition</td></tr><tr><td>1</td><td>Equal importance</td></tr><tr><td>3</td><td>Somewhat more important</td></tr><tr><td>5</td><td>Much more important</td></tr><tr><td>7</td><td>Very much more important</td></tr><tr><td>9</td><td>Absolutely more important</td></tr><tr><td>2, 4, 6, 8</td><td>Intermediate values</td></tr></table>
Elements in each level are compared pairwise with respect to their importance to an element in the next higher level, starting at the top of the hierarchy and working down, a number of square matrices called preference matrices are created in the process of comparing elements at a given level. Judgments of preference are made on pairs of elements in the structure using the fundamental scale mentioned above. It enables the decision maker to incorporate experience and knowledge in an intuitive and natural way (Ishizaka, A., Labib, A. (2011). "This scale is insensitive to small changes in a decision maker's preference, thereby minimizing the effect of uncertainty in evaluations." (Bahurmoz, 2006 b).
## iv. Synthesizing
After forming the preference (judgement) matrices, the process moves to the step of deriving relative priorities for the various elements. The goal is to find a set of priorities $\mathbf{P_i}$, $\mathbf{P_n}$ such that $\mathbf{P_i} / \mathbf{P_j}$ match the comparisons $a_{ij}$ in a consistent matrix and when slight inconsistencies are introduced, priorities should vary only slightly. Different methods have been developed to derive priorities. Saaty used the mean of the row. This old method is based on three steps (Ishizaka and Labib, 2011):
1. Sum the elements of each column $j$: $\sum_{i=1}^{n} a_{ij} \forall i, j$
2. Divide each value by its column sum: $\sum a_{ij} = a_{ij} / \sum a_{ij} \forall i, j$
3. Mean of row $i$ P<sub>i</sub> = ∑<sub>i=1</sub>n a<sub>ij</sub> /n
The relative priorities (weights) of the elements of each level with respect to an element in the next higher level are computed as the components of the normalized eigenvector associated with the largest
eigenvalue of their comparison matrix. The composite weights of the decision alternatives are then determined by aggregating the weights throughout the hierarchy. This is done by following a path from the top of the hierarchy to each alternative at the lowest level and multiplying the weights along each segment of the path. The outcome of this aggregation is a normalized vector of the overall weights of the options.
## v. Consistency Versus Inconsistency
AHP provides decision makers with a useful way of checking and improving consistency. A byproduct of solving the eigenvalue problem to measure priorities is the principal eigenvalue, $\lambda_{\mathrm{max}}$, from which we can derive the consistency index (C.l.) as follows: C.l. = ( $\lambda_{\mathrm{max}}\cdot n$ )/(n-1), where $n$ is the order of the comparison matrix.
Once judgements were elicited, A Judgment matrix is created based on the pairwise comparison made by the decision maker, A normalized matrix (N) must be created from the judgment matrix to be able to calculate the consistency ratio (CR) to check the consistency by using the following formula:
$$
\begin{array}{l} \mathrm {C R} = \frac {\text {C o n s i s t e n c y I n d e x}}{\text {R a n d o m C o n s i s t a n c y}} = \frac {C I}{R I}, \text {w h e r e} C I = \frac {\lambda \max - n}{n - 1}; \text {w h e r e} \\\text {R I} \text {i s t h e r a n d o m i n d e x w h i c h i s t h e a v e r a g e o f C l ' s o f} \\\text {l a r g e n u m b e r o f m a t r i c e s o f t h e s a m e o r d e r . S a a t y ,} \\\text {2 0 1 6)} \end{array}
$$
The measurement of consistency reflects whether the decision maker understands and captures the interactions among different factors of the problem, or his decision is a matter of random hitting the target. However, perfect consistency is hard to achieve in real life problem solving. Saaty states "inconsistency must be precisely one order of magnitude less important than consistency, or simply $10\%$ of the total concern with consistent measurement. If it were larger, it would disrupt consistent measurement and if it were smaller, it would make insignificant contribution to change in measurement" (Saaty 2016 & 2004).
Due to its pragmatic approach and adaptability, it has numerous applications in all aspects of decision making. Its widespread justifies having a specialized journal called "The International journal of the AHP (JAHP)" which is specialized in publishing theoretical and application papers related to the AHP and an international symposium (ISAHP) is held every other year to address developments in the process and its applications. To grasp the philosophy of the AHP readers are referred to read the following (Saaty, 2016, Saaty 2008 & Saaty, 2012).
In what follows, an AHP model is developed to select the best campaign to perform Hajj.
### b) Developing the AHP Model
Developing the AHP model involves the following steps:
Step 1: Structuring the hierarchy
The Goal: select the best campaign to perform Hajj in four categories.
The Criteria: In this regard SQDs are used as the main criteria, i.e. tangibility, reliability, responsiveness, assurance, and empathy which are known in the quality literature as the SERVQUAL model (Parasuraman, Zeithaml, and Berry, 1988). Depending on the industry involved, there are different definitions of service quality dimensions (Parasuraman et al., 1988; Angelova & Zekiri, 2011; Alsharief et al., 2022). Service quality dimensions represent the total of all the procedures that influence customers' opinions on the performance of a service or the delivery of a product. (Parasuraman et al., 1988). Meanwhile, according to Eid, (2012), the satisfaction of the pilgrims is linked to the service quality levels customers receive. Concepts of quality of service are strongly emphasized in marketing studies and literature, the concept acts as a main determining factor of satisfaction and response on the part of customers. Assuring service quality is challenging, however, as it varies from one industry to another, the nature of the service and the setting in which that service is provided, as well as external factors such as the economy, cultural preferences, and current trends in the market. Because of this, service quality can be assessed through different approaches, and there is no one-size-fits-all approach that could cover all markets - although numerous attempts have been made to generalize approaches to evaluating the way in which service quality is measured.
Scholars have stressed the significance of customer satisfaction and service quality across a wide range of sectors (Angelova & Zekiri, 2011; Emtu, 2017; Eid, 2012), and many studies have been made on the dimensions of service quality specifically within the haji context, as these factors are becoming increasingly important dimensions of the Hajj. Defining service quality for the pilgrimage is necessary, along with the development of a measuring process (Harris et al., 2020; Alsharif et al., 2022; Eid, 2012; Sadq et al., 2020). Service quality literature is broadly divided into two schools; the Nordic school that sees it as a two-dimensional process and the American school that contains the five-dimensional SERVQUAL model (Parasuraman, Zeithaml, and Berry, 1988). Scholars choose one of the two models as the basis for their studies. The SERVQUAL model is adopted in this study as mentioned above. Its five dimensions are considered as the main criteria for the proposed AHP model. (Table 1 and 2). Based on these dimensions, service providers must re-examine the quality of the services they provide to customers to improve their services and maintain customer satisfaction (Sadq et al., 2020).
Table 1: Criteria & Sub criteria for each dimension
<table><tr><td>Main Criteria</td><td>Sub criteria</td></tr><tr><td>Tangibility (TAN1-7)</td><td>Appearance of physical facilities such as housing, personnel, equipment, transport, and communication technology (modern equipment, appealing facilities, tidy employees, and attractive materials linked to the service provided). Providers must consider details and information, resulting in the straightforward appearance of physical surroundings.
(For example, understanding pilgrims' needs in terms of providing different choices of housing, food, and beverages).</td></tr><tr><td>Reliability (REL1-5)</td><td>Ability to undertake promised services accurately and dependably. Providing services within the promised deadlines, showing interest in problem-solving, doing things right the first time, and maintaining error-free paperwork.
(For example: using written contracts to demonstrate the level of service provision, and reliability and timeliness of performance and delivery; No complaints from pilgrims relating to how services were provided and how campaigns providers were effective in saving pilgrims time, effort, and money (Smith, 2020).</td></tr><tr><td>Responsiveness (RES1-5)</td><td>A willingness to assist pilgrims and provide a prompt and reliable service. Informing customers when things will be done, providing efficient service by helpful employees and always being ready to respond to questions. Responsiveness and effectiveness of service delivery, including operational efficiency and rapid response to specific demands (Parasuraman et al., 1985).
For example, using electronic services such as websites, apps, and emails to respond to pilgrims.</td></tr><tr><td>Assurance (ASS1-5)</td><td>Good levels of knowledge and courtesy from employees as well as ability to earn loyalty and confidence by being confident, making customers feel safe in any transactions with the suppliers. Employees always maintaining a polite demeanour and being sufficiently knowledgeable to answer pilgrims' questions). Showing confidence in ensuring security to protect pilgrims from crime, hygiene issues, illness, and accidents.</td></tr><tr><td>Empathy (EMP1-4)</td><td>Providing caring and tailored attention to pilgrims through convenient operating hours keeping the customers interests in mind and understanding their specific needs. Providing care relating to the numbers of pilgrims, their budgets and the size and standard of facilities. Providing specific needs for children and the elderly.</td></tr></table>
#### The alternatives:
Having explained the dimensions of service quality as criteria and sub criteria and contexts of "hajj", campaigns as alternatives, which are category of hajj campaign A, B, C and D as illustrated in table 2.
Table 2: Categories of Hajj campaigns from A to D as alternatives
<table><tr><td>Category of haji campaign A</td><td>campaigns that provide the highest level of luxury services in haji.</td></tr><tr><td>Category of haji campaign B</td><td>campaigns provide a high level of services to pilgrims but lower than that of haji campaign A.</td></tr><tr><td>Category of haji campaign C</td><td>campaigns that provide the lowest level of services than A, B campaigns but higher than D campaigns.</td></tr><tr><td>Category of haji campaign D</td><td>campaign that provides the services to limited income pilgrims.</td></tr></table>
The AHP hierarchy is shown in Figure 1
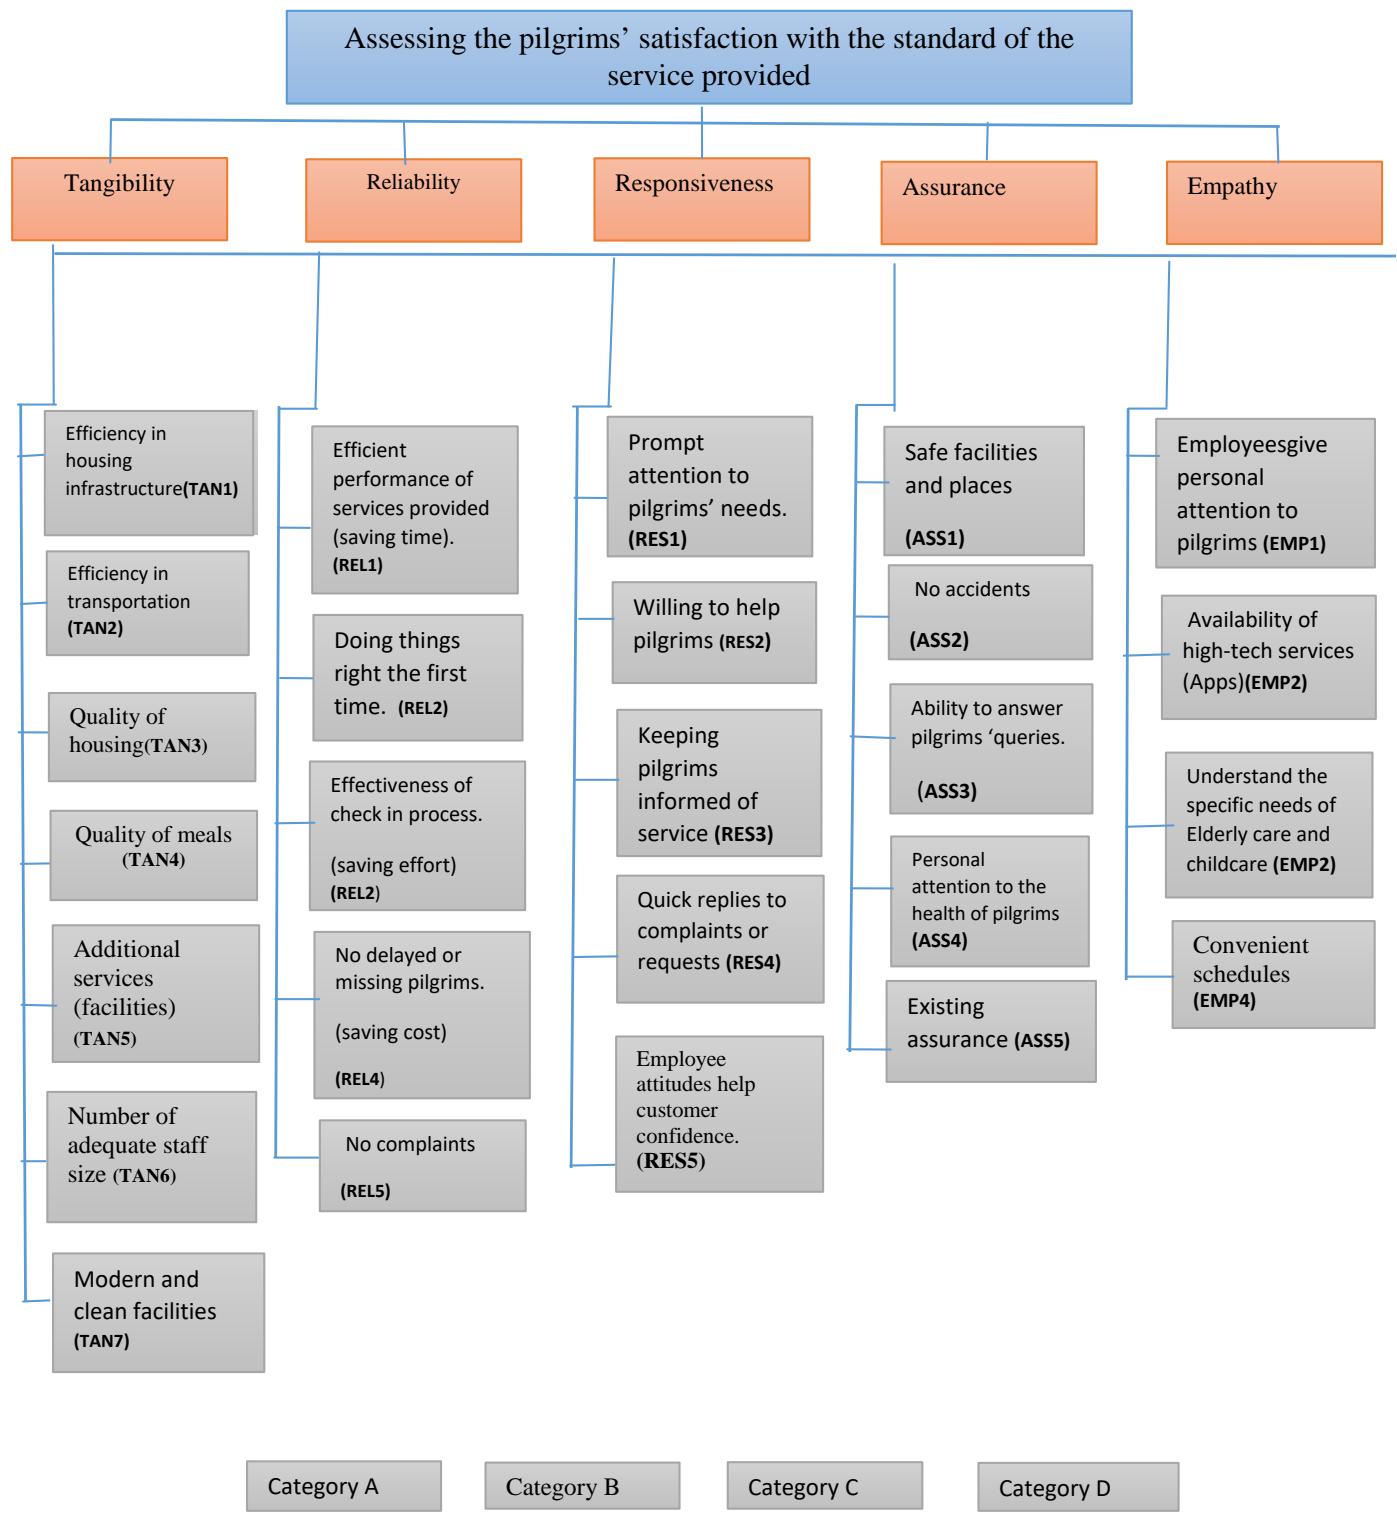
Figure 1: AHP model
Step 2: Compare criteria and sub-criteria in pairs to determine priority vectors. Construct a set of pairwise comparison matrices. Each element in an upper level is used to compare the elements in the level immediately below with respect to it. ("Urban Vulnerability Assessment Using AHP - Hindawi") Saaty's nine-point
scale (Table 0) is used to perform a pairwise comparison of the criteria and the sub-criteria involved.

according to Vision 2030 (Masoud, 2022). The aggregate pairwise comparison weight matrices and their associated CR values are shown in Table 3. According to Kannan (2010), the normalized weights of
each row were averaged to show the priority of each criterion over others to calculate the priority vector based on relative weights.
Table 3: Weighted aggregate pairwise comparisons of main criteria and priority vector with respect to the goal
<table><tr><td>Criteria</td><td>Tangibility</td><td>Reliability</td><td>Responsiveness</td><td>Assurance</td><td>Empathy</td><td>Priorities</td></tr><tr><td>Tangibility</td><td>1</td><td>2.98</td><td>3.2</td><td>4.13</td><td>5.00</td><td>0.456</td></tr><tr><td>Reliability</td><td>0.335</td><td>1</td><td>3.00</td><td>2.00</td><td>2.94</td><td>0.232</td></tr><tr><td>Responsiveness</td><td>0.312</td><td>0.333</td><td>1</td><td>2.11</td><td>0.78</td><td>0.119</td></tr><tr><td>Assurance</td><td>0.242</td><td>0.5</td><td>0.474</td><td>1</td><td>0.63</td><td>0.084</td></tr><tr><td>Empathy</td><td>0.2</td><td>0.341</td><td>1.28</td><td>1.59</td><td>1</td><td>0.11</td></tr><tr><td colspan="7">Notes: CI=0.095, CR=0.046</td></tr></table>
Table 4 shows the relative weights of the criteria and the sub-criteria, which can be seen in the priority
vector column. The priority weights can then be used to rank main and sub-criteria in the dimension of service.
Table 4: Aggregate pairwise weight comparisons of level 3 sub criteria and their priority vector
<table><tr><td>Tangibility</td><td>TAN1</td><td>TAN2</td><td>TAN3</td><td>TAN4</td><td>TAN5</td><td>TAN6</td><td>TAN7</td><td>Priority Vector</td></tr><tr><td>TAN1</td><td>1</td><td>0.5</td><td>3</td><td>2</td><td>2</td><td>0.5</td><td>0.333</td><td>0.138</td></tr><tr><td>TAN2</td><td>2</td><td>1</td><td>2</td><td>2</td><td>3</td><td>2</td><td>2</td><td>0.239</td></tr><tr><td>TAN3</td><td>0.333</td><td>0.5</td><td>1</td><td>2</td><td>2</td><td>2</td><td>0.333</td><td>0.125</td></tr><tr><td>TAN4</td><td>0.5</td><td>0.5</td><td>0.5</td><td>1</td><td>2</td><td>0.5</td><td>0.5</td><td>0.088</td></tr><tr><td>TAN5</td><td>0.5</td><td>0.333</td><td>0.5</td><td>0.5</td><td>1</td><td>0.5</td><td>0.5</td><td>0.660</td></tr><tr><td>TAN6</td><td>2</td><td>0.5</td><td>0.5</td><td>2</td><td>1</td><td>0.5</td><td>0.5</td><td>0.132</td></tr><tr><td>TAN7</td><td>3</td><td>0.5</td><td>3</td><td>2</td><td>2</td><td>2</td><td>1</td><td>0.212</td></tr><tr><td>Reliability</td><td>REL1</td><td>REL2</td><td>REL3</td><td>REL4</td><td>REL5</td><td></td><td></td><td>Priority Vector</td></tr><tr><td>REL1</td><td>1</td><td>2.11</td><td>2</td><td>2</td><td>0.5</td><td></td><td></td><td>0.243</td></tr><tr><td>REL2</td><td>0.474</td><td>1</td><td>2</td><td>2</td><td>0.333</td><td></td><td></td><td>0.184</td></tr><tr><td>REL3</td><td>0.5</td><td>2</td><td>1</td><td>0.333</td><td>0.5</td><td></td><td></td><td>0.109</td></tr><tr><td>REL4</td><td>3</td><td>2</td><td>3</td><td>1</td><td>0.5</td><td></td><td></td><td>0.121</td></tr><tr><td>REL5</td><td>3</td><td>3</td><td>2</td><td>2</td><td>1</td><td></td><td></td><td>0.342</td></tr><tr><td>Responsiveness</td><td>RES1</td><td>RES2</td><td>RES3</td><td>RES4</td><td>RES5</td><td></td><td></td><td>Priority Vector</td></tr><tr><td>RES1</td><td>1</td><td>2</td><td>0.5</td><td>0.5</td><td>0.5</td><td></td><td></td><td>0.132</td></tr><tr><td>RES2</td><td>0.5</td><td>1</td><td>2</td><td>0.5</td><td>2</td><td></td><td></td><td>0.361</td></tr><tr><td>RES3</td><td>2</td><td>0.5</td><td>1</td><td>0.5</td><td>2</td><td></td><td></td><td>0.079</td></tr><tr><td>RES4</td><td>2</td><td>2</td><td>2</td><td>1</td><td>2</td><td></td><td></td><td>0.194</td></tr><tr><td>RES5</td><td>2</td><td>0.5</td><td>0.5</td><td>0.5</td><td>1</td><td></td><td></td><td>0.234</td></tr></table>
<table><tr><td>Assurance</td><td>ASS1</td><td>ASS2</td><td>ASS3</td><td>ASS4</td><td>ASS5</td><td>Priority Vector</td></tr><tr><td>ASS1</td><td>1</td><td>0.5</td><td>2</td><td>2</td><td>2</td><td>0.180</td></tr><tr><td>ASS2</td><td>2</td><td>1</td><td>2</td><td>0.5</td><td>0.5</td><td>0.126</td></tr><tr><td>ASS3</td><td>0.5</td><td>0.5</td><td>1</td><td>2</td><td>0.333</td><td>0.094</td></tr><tr><td>ASS4</td><td>0.5</td><td>2</td><td>0.5</td><td>1</td><td>0.333</td><td>0.237</td></tr><tr><td>ASS5</td><td>0.5</td><td>2</td><td>3</td><td>3</td><td>1</td><td>0.362</td></tr><tr><td>Empathy</td><td>EMP1</td><td>EMP2</td><td>EMP3</td><td>EMP4</td><td></td><td>Priority Vector</td></tr><tr><td>EMP1</td><td>1</td><td>0.2</td><td>0.333</td><td>3</td><td></td><td>0.198</td></tr><tr><td>EMP2</td><td>5</td><td>1</td><td>0.5</td><td>3</td><td></td><td>0.275</td></tr><tr><td>EMP3</td><td>3</td><td>2</td><td>1</td><td>5</td><td></td><td>0.387</td></tr><tr><td>EMP4</td><td>0.333</td><td>0.333</td><td>0.2</td><td>1</td><td></td><td>0.140</td></tr><tr><td colspan="7">Notes: CI=0.095, CR=0.045</td></tr></table>
<table><tr><td>Assurance</td><td>ASS1</td><td>ASS2</td><td>ASS3</td><td>ASS4</td><td>ASS5</td><td>Priority Vector</td></tr><tr><td>ASS1</td><td>1</td><td>0.5</td><td>2</td><td>2</td><td>2</td><td>0.180</td></tr><tr><td>ASS2</td><td>2</td><td>1</td><td>2</td><td>0.5</td><td>0.5</td><td>0.126</td></tr><tr><td>ASS3</td><td>0.5</td><td>0.5</td><td>1</td><td>2</td><td>0.333</td><td>0.094</td></tr><tr><td>ASS4</td><td>0.5</td><td>2</td><td>0.5</td><td>1</td><td>0.333</td><td>0.237</td></tr><tr><td>ASS5</td><td>0.5</td><td>2</td><td>3</td><td>3</td><td>1</td><td>0.362</td></tr><tr><td>Empathy</td><td>EMP1</td><td>EMP2</td><td>EMP3</td><td>EMP4</td><td></td><td>Priority Vector</td></tr><tr><td>EMP1</td><td>1</td><td>0.2</td><td>0.333</td><td>3</td><td></td><td>0.198</td></tr><tr><td>EMP2</td><td>5</td><td>1</td><td>0.5</td><td>3</td><td></td><td>0.275</td></tr><tr><td>EMP3</td><td>3</td><td>2</td><td>1</td><td>5</td><td></td><td>0.387</td></tr><tr><td>EMP4</td><td>0.333</td><td>0.333</td><td>0.2</td><td>1</td><td></td><td>0.140</td></tr><tr><td colspan="7">Notes: CI=0.095, CR=0.045</td></tr></table>
After the relative priority for each criterion and sub-criterion were estimated, we can go on to work out the local priority score of each Hajj campaign based on the study of the sub-criteria.
Table 5 displays the aggregate pairwise comparison weight matrices for Hajj campaign
categories in terms of each sub criteria. The CR was also estimated for each matrix, and the results were found to be less than 0.10. This means that the judgments are consistent.
Table 5: Weighted averages of pairwise comparisons for level 4 alternatives
<table><tr><td></td><td>A</td><td>B</td><td>C</td><td>D</td><td>PV</td><td>CR</td><td></td><td>A</td><td>B</td><td>C</td><td>D</td><td>PV</td><td>CR</td></tr><tr><td colspan="11">TAN1</td><td colspan="3">TAN 2</td></tr><tr><td>A</td><td>1</td><td>2.06</td><td>7</td><td>9</td><td>0.424</td><td></td><td>A</td><td>1</td><td>2.57</td><td>3</td><td>4</td><td>0.487</td><td></td></tr><tr><td>B</td><td>0.2</td><td>1</td><td>5</td><td>7</td><td>0.332</td><td></td><td>B</td><td>.428</td><td>1</td><td>2</td><td>5</td><td>0.296</td><td></td></tr><tr><td>C</td><td>0.333</td><td>0.5</td><td>1</td><td>3</td><td>0.172</td><td></td><td>C</td><td>.333</td><td>0.5</td><td>1</td><td>3</td><td>0.173</td><td></td></tr><tr><td>D</td><td>0.2</td><td>0.333</td><td>0.333</td><td>1</td><td>0.078</td><td></td><td>D</td><td>.25</td><td>0.333</td><td>0.333</td><td>1</td><td>0.078</td><td></td></tr></table>

satisfaction score (the global priority score) for each of the of Hajj categories by multiplying the evaluated weight for each of the sub-criteria by each local priority score that corresponded to each of the sub criterion and adding them together for column. Table 6 shows the results of these calculations.
Table 6: Weighted averages of pairwise comparisons and normalized benefits
<table><tr><td>Level 2
Main Criteria</td><td>Priorities</td><td>Level 3
Sub Criteria</td><td>p</td><td>A</td><td>B</td><td>C</td><td>D</td><td>Rank</td><td>Normalized benefits</td></tr><tr><td rowspan="7">Tangibility</td><td rowspan="7">0.456</td><td>TAN1</td><td>0.138</td><td>0.424</td><td>0.332</td><td>0.158</td><td>0.085</td><td>3</td><td>6.29%</td></tr><tr><td>TAN2</td><td>0.239</td><td>0.487</td><td>0.260</td><td>0.158</td><td>0.158</td><td>1</td><td>10.9%</td></tr><tr><td>TAN3</td><td>0.125</td><td>0.557</td><td>0.221</td><td>0.138</td><td>0.084</td><td>5</td><td>5.7%</td></tr><tr><td>TAN4</td><td>0.088</td><td>0.522</td><td>0.240</td><td>0.159</td><td>0.078</td><td>6</td><td>4.01%</td></tr><tr><td>TAN5</td><td>0.066</td><td>0.557</td><td>0.221</td><td>0.138</td><td>0.084</td><td>5</td><td>3%</td></tr><tr><td>TAN6</td><td>0.132</td><td>0.519</td><td>0.234</td><td>0.162</td><td>0.085</td><td>4</td><td>6.01%</td></tr><tr><td>TAN7</td><td>0.212</td><td>0.490</td><td>0.258</td><td>0.172</td><td>0.080</td><td>2</td><td>9.6%</td></tr><tr><td rowspan="5">Reliability</td><td rowspan="5">0.232</td><td>REL1</td><td>0.243</td><td>0.468</td><td>0.296</td><td>0.153</td><td>0.084</td><td>1</td><td>5.6%</td></tr><tr><td>REL2</td><td>0.184</td><td>0.489</td><td>0.238</td><td>0.193</td><td>0.081</td><td>3</td><td>4.27%</td></tr><tr><td>REL3</td><td>0.109</td><td>0.500</td><td>0.247</td><td>0.148</td><td>0.105</td><td>5</td><td>3.52%</td></tr><tr><td>REL4</td><td>0.121</td><td>0.471</td><td>0.279</td><td>0.164</td><td>0.085</td><td>4</td><td>2.80%</td></tr><tr><td>REL5</td><td>0.234</td><td>0.387</td><td>0.275</td><td>0.198</td><td>0.140</td><td>2</td><td>5.41%</td></tr><tr><td rowspan="2">Responsiveness</td><td rowspan="2">0.119</td><td>RES1</td><td>0.132</td><td>0.439</td><td>0.277</td><td>0.186</td><td>0.098</td><td>4</td><td>1.57%</td></tr><tr><td>RES2</td><td>0.361</td><td>0.477</td><td>0.226</td><td>0.189</td><td>0.108</td><td>1</td><td>4.29%</td></tr><tr><td></td><td></td><td>RES3</td><td>0.079</td><td>0.429</td><td>0.303</td><td>0.170</td><td>0.098</td><td>5</td><td>1%</td></tr><tr><td></td><td></td><td>RES4</td><td>0.194</td><td>0.452</td><td>0.237</td><td>0.173</td><td>0.138</td><td>3</td><td>2.3%</td></tr><tr><td></td><td></td><td>RES5</td><td>0.234</td><td>0.523</td><td>0.202</td><td>0.202</td><td>0.073</td><td>2</td><td>2.78%</td></tr><tr><td></td><td>0.084</td><td>ASS1</td><td>0.180</td><td>0.509</td><td>0.251</td><td>0.152</td><td>0.088</td><td>3</td><td>1.51%</td></tr><tr><td></td><td></td><td>ASS2</td><td>0.126</td><td>0.453</td><td>0.265</td><td>0.184</td><td>0.098</td><td>4</td><td>1.05</td></tr><tr><td>Assurance</td><td></td><td>ASS3</td><td>0.094</td><td>0.498</td><td>0.249</td><td>0.150</td><td>0.103</td><td>5</td><td>0.7%</td></tr><tr><td></td><td></td><td>ASS4</td><td>0.237</td><td>0.446</td><td>0.237</td><td>0.218</td><td>0.098</td><td>2</td><td>1.99%</td></tr><tr><td></td><td></td><td>ASS5</td><td>0.362</td><td>0.523</td><td>0.202</td><td>0.202</td><td>0.073</td><td>1</td><td>3.04%</td></tr><tr><td></td><td>0.11</td><td>EMP1</td><td>0.198</td><td>0.461</td><td>0.252</td><td>0.201</td><td>0.085</td><td>3</td><td>2.18%</td></tr><tr><td>Empathy</td><td></td><td>EMP2</td><td>0.275</td><td>0.497</td><td>0.252</td><td>0.165</td><td>0.086</td><td>2</td><td>3.03%</td></tr><tr><td></td><td></td><td>EMP3</td><td>0.387</td><td>0.504</td><td>0.204</td><td>0.205</td><td>0.087</td><td>1</td><td>4.25%</td></tr><tr><td></td><td></td><td>EMP4</td><td>0.140</td><td>0.509</td><td>0.240</td><td>0.173</td><td>0.078</td><td>4</td><td>1.54%</td></tr><tr><td>Overall priority</td><td></td><td></td><td></td><td>0.477</td><td>0.256</td><td>0.173</td><td>0.094</td><td></td><td>100%</td></tr></table>
As a result, there will frequently be opportunities for efficiency improvements that are obvious from available techniques (which is going to be described below). We can see the end results in Table 6 as normalized and idealized priorities. According to Saaty (1990; 1994; 2008), Cost-Benefit Analysis (CBA) can be evaluated by combining absolute and relative measurements. CBA entails using the relevant criteria to normalize each set of measures on the same standard scale with respect to those criteria. The answers will not be the same as those obtained using standard arithmetic, leading to the premature conclusion that the AHP is faulty. To avoid such problems, caution must be exercised when converting standard scale measurements to comparative values when several criteria are involved. From different perspectives, Table 7 shows the relative cost, relative benefit, and the relative gap improvement. The effect is to make this category A as ideal with others getting their proportionate value. The interpret the results category B is about $53.7\%$ as good as one with category A.
Table 7: The Ideal Intensity for alternative decision Mode
<table><tr><td>Level 4 Category</td><td>Priorities weighted</td><td>idealized (Divide by largest value)</td><td>Relative Benefits</td><td>Relative gap improvement</td><td>Relative cost</td></tr><tr><td>Category A</td><td>0.477</td><td>1.000</td><td>100%</td><td>100%</td><td>100%</td></tr><tr><td>Category B</td><td>0.256</td><td>0.537</td><td>53.6%</td><td>46.4%</td><td>53.6%</td></tr><tr><td>Category C</td><td>0.173</td><td>0.362</td><td>36.2%</td><td>63.8%</td><td>36.2%</td></tr><tr><td>Category D</td><td>0.094</td><td>0.197</td><td>19.7%</td><td>80.3%</td><td>19.7%</td></tr></table>
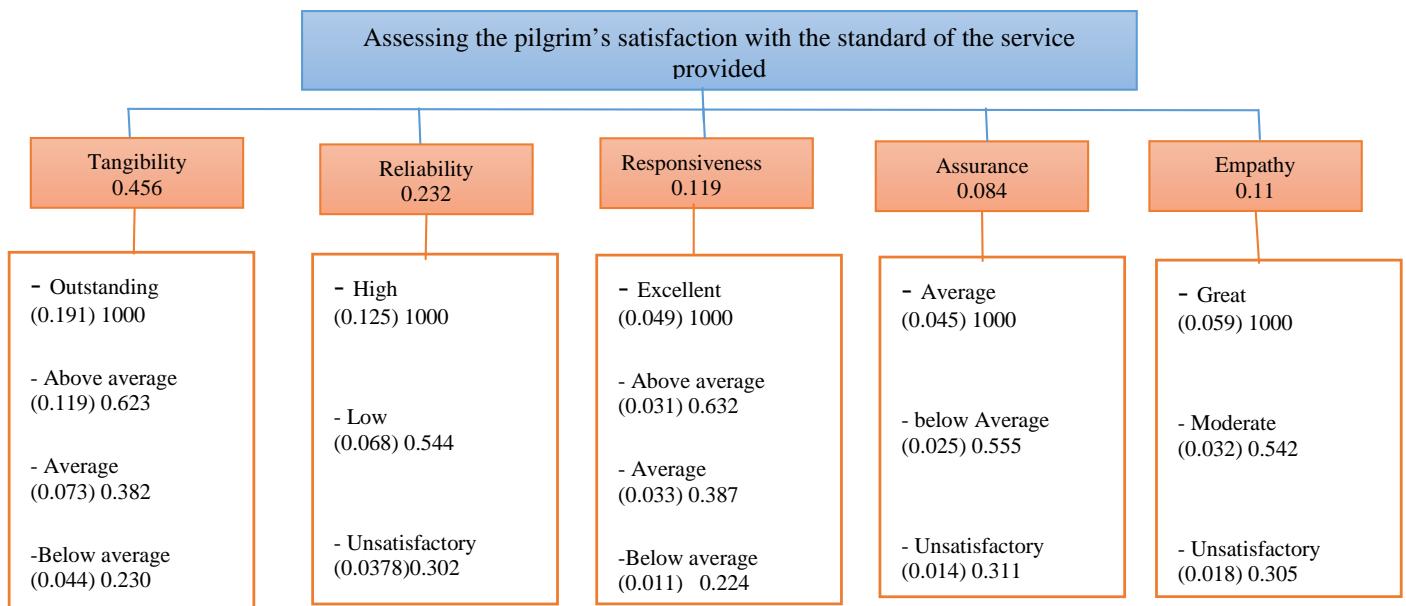
The rating categories for Tangibility criterion as outstanding, above average, below average, and unsatisfactory. Pilgrims compare them for preference using a pair-wise comparison matrix as giving in Table 8.
Table 8: Deriving priorities for rating on Tangibility
<table><tr><td>Intensities</td><td>Outstanding</td><td>Above average</td><td>average</td><td>Below average</td><td>Unsatisfactory</td><td>Priorities</td></tr><tr><td>Outstanding</td><td>1.0</td><td>2.0</td><td>3.0</td><td>4.0</td><td>5.0</td><td>0.419</td></tr><tr><td>Above average</td><td>0.5</td><td>1</td><td>2.0</td><td>3.0</td><td>4.0</td><td>0.263</td></tr><tr><td>Average</td><td>1/3</td><td>½</td><td>1.0</td><td>2.0</td><td>3.0</td><td>0.160</td></tr><tr><td>Below average</td><td>½</td><td>1/3</td><td>½</td><td>1</td><td>2</td><td>0.097</td></tr><tr><td>Unsatisfactory</td><td>1/5</td><td>¼</td><td>1/3</td><td>1/2</td><td>1</td><td>0.062</td></tr></table>
To obtain the idealized priorities normalized by dividing by the largest of the priorities. Table 9 gives covering criterion and Figure 5 their corresponding numerical ratings from Table 8 with their totals given in the first column on the left.
Table 9: Standards Criteria and Intensities for Rating service campaigns
<table><tr><td>Tangibility 0.456</td><td>Priorities weighted by 0.456</td><td>idealized (Divide by largest value)</td></tr><tr><td>Outstanding</td><td>0.191</td><td>1.000</td></tr><tr><td>Above average</td><td>0.119</td><td>0.623</td></tr><tr><td>Average</td><td>0.073</td><td>0.382</td></tr><tr><td>Below average</td><td>0.044</td><td>0.230</td></tr><tr><td>Unsatisfactory</td><td>0.028</td><td>0.146</td></tr></table>
Ratings for each criterion and sub-criterion identified the grade which best described it. The hierarchy for the evaluation and priorities derived through paired comparisons are shown in Figure 2 (for other calculation of SQD see appendix B). The rating categories for all the covering criteria and their priorities are established in analogous way are giving in Table 9. It is then followed by a rating of each Hajj campaign for
the quality's performance under each criterion and summing the resulting scores of obtain its overall rating. As a result, the evaluation program to support policymakers to evaluate the services provided by Hajj campaigns. For example, to show how to obtain the total score for evaluating campaign A: $0.00 \times 0.465 + 0.00 \times 0.232 + 0.00 \times 0.119 + 0.00 \times 0.084 + 0.00 \times 0.11$.

Figure 2: Hierarchy for evaluating Hajj campaigns.
Following this process, the framework for SQD in categories of Hajj campaigns were measured and evaluated using a series of different steps. The next section explores the findings and presents a discussion based on this analysis.
## IV. FINDINGS & DISCUSSION
Table 6 shows the overall findings of the research, which shows the ranking of priorities in the principal dimension of service criteria (level 2), the ranking of the sub-criteria in terms of priority (level 3), and the relative importance of various alternatives for the Hajj campaign categories relative to each sub-criterion.
### a) Interpretation of level 2 and level 3 priorities
The results show that pilgrims see Tangible services as the highest priority when it comes to assessing SQ, assigning it a weight of $45.6\%$ (Figure 3). It is therefore important that Hajj providers offer tangible physical services. We can see from the results that of the four Level 3 sub criteria, TAN2 - which is transportation handling mechanisms by Hajj service providers - is seen to be the as the most important service sub-criterion, carrying a weight of $23.9\%$, followed by TAN7 - which covers the provision of clean and modern facilities by Hajj agents - with a weight of $21\%$, TAN1 - which is efficient accommodation - at $13.9\%$ and TAN6 - providing enough staff - at $13.2\%$. Hence, Hajj campaigns should focus on places close to the holy sites, and the efficiency of providing transportation is more important. Cleaning and modern facilities are the second factors to focus on when it comes to packages differentiation.
Reliability ranked as the next most crucial factor in quality of service during Hajj pilgrimages, with a weight of $23.2\%$ (Figure 3). The results demonstrate that of the four Level 3 sub-criteria) REL1 – which is the efficient provision of service – is considered the most vital sub criterion of service with a weight of $24.3\%$, followed by REL5 – which is the absence of complaints and the good reputation of Hajj agents – was rated by pilgrims as the second-highest priority, followed by REL2 – that Hajj agents perform services right the first time – and REL4 – that Hajj agents prevent delays and do not lose any of their party of pilgrims. Hence, Hajj campaigns must stress on punctuality performance, and must improve their operations (processes) that not only operate on time but also make suitable arrangements to satisfy their clients.
Responsiveness was ranked third most important in terms of quality of service in the pilgrimages, with a weight of $11.9\%$ (Figure 3). The results demonstrate that in the four Level 3 sub-criteria, RES2 – that staff agents are always helpful – ranked as the most vital sub-criterion with a weight of $36\%$, followed by RES5 – service staff behaviour and attitude – at $23\%$, and RES4
- dealing with to requests or complaints. Hence, Hajj campaigns must lay stress on prompt service to pilgrims by providing sufficient training and qualifying staff.
Empathy was rated as the fourth most important aspect of service quality, with a weight of $11\%$ (Figure 3). Of the four Level 3 sub-criteria, EMP3 - understanding the specific needs of pilgrims such as caring for the elderly and children, was considered the most important sub-criterion, with a weight of $38\%$, followed by EMP2 - availability of technology services - at $27\%$, EMP1 - agents provide personal attention to pilgrims' needs - at $19.8\%$ and EMP4 - convenient schedules - at $14\%$. Hence, Hajj campaigns must lay stress on incorporating convenient services to all international pilgrims and suitable for all ages.
Assurance involves making pilgrims feel cared for by the service providers during the Hajj pilgrimage, and this category had a weight of $8.04\%$. Of the four Level 3 sub-criteria, ASS5 – the availability of Haj agents to provide assurance – was seen as the most vital sub-criterion with a weight of $36\%$, followed by ASS4 – caring about the health and welfare of the pilgrims – at $23\%$, and ASS2 – keeping the process accident-free – at $12.6\%$. Hence, Hajj campaigns must lay stress on pilgrims' safety by providing safe housing health care and safe facilities.
We can summarize this information by concluding that tangible physical services were the most vital sub criteria, with a weight of $45.6\%$ followed by Reliability $(23.2\%)$, Responsiveness $(11.9\%)$ and Empathy and Assurance $(11\%$ and $8\%$ respectively). These conclusions are summarized in Figure 3. The results show that the sub-criteria of service in each category of service provided from the most or least important in term of satisfaction rating. The data provide valuable insights into each sub criteria, and these will help service providers to design positive strategies to improve, modify or upgrade their current standards of service quality.
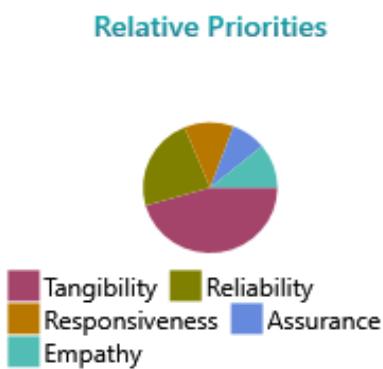
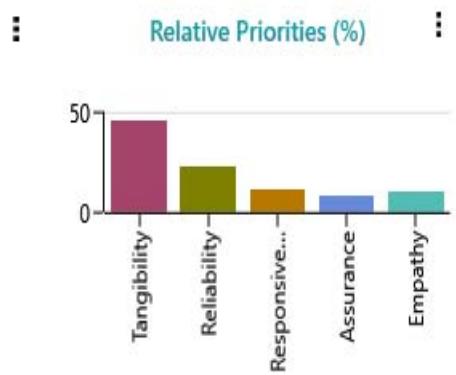
Figure 3: Priorities
### b) Interpretation of Level 4 Priorities and Decision Alternatives
Table 6 and Figure 4 show the importance of the standards of the four categories of Hajj campaigns in terms of each of the twenty-six services' dimension sub-criteria. The results show that of the twenty-six sub criteria, Category A has the most crucial factor and is considered as the highest service priority in tangibility, reliability, responsive, empathy, and assurance. The outcomes show that of the specific sub-criteria of the service dimension of each category, Category A has the highest priorities in the twenty-six sub-criteria while category B has the second highest. The results show that the sub-criteria of service in each category of
service provided from the most or least important in term of satisfaction rating.
The data provide valuable insights into each category, and these will help service providers to design positive strategies to improve, modify, or upgrade their current standards of service quality. These providers can be seen in their ideal form by dividing every one of the priorities by the largest priority (0.477 for category A as shown in Table 7). The effect of this is to see each category as an alternative to the ideal one to allow all categories to show their proportionate value. The results show that category B is $53.6\%$ and C is $36.2\%$ as important as Category A.
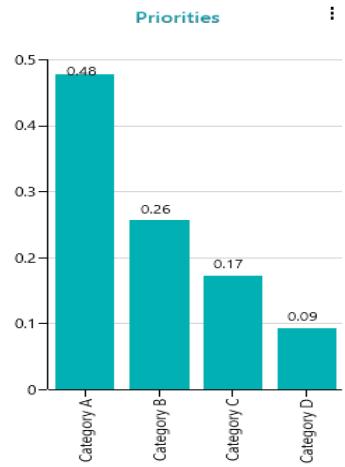
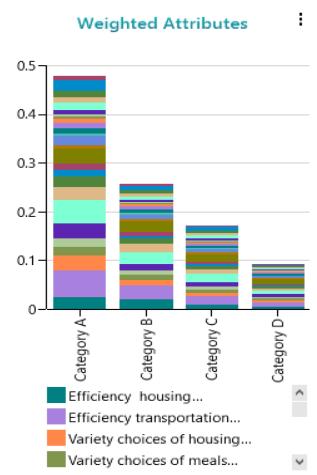
Figure 4: Priorities/Weighted attributes
### c) Interpretation of Standard Matrices for Services Provided According to Criteria and Decision Alternatives
Tables 7, 8 and Table 9 show the ratings where a hierarchy has been established depending on the level of the criteria and the sub-criteria. These ratings are subdivided into levels of intensity that show variations in the quality of specific criteria. Meanwhile, summarizes service capabilities through the intensity of preferred quality to obtain the priorities for dealing with decisions from all four categories. The rankings can then be
compiled into one overall mark by evaluating the best alternative for each benefit as well as cost for the strategic category that an individual or government will use to decide in terms of whether to choose one of the decisions, they find themselves facing. The four ratings demonstrate the priorities of the decision-making process, which can then be used to evaluate the weights of the priorities of all the alternatives in relation to their merit (Figure 2 & 5). The result of this research will be a program of support to policymakers to evaluate the services provided by Hajj campaigns.
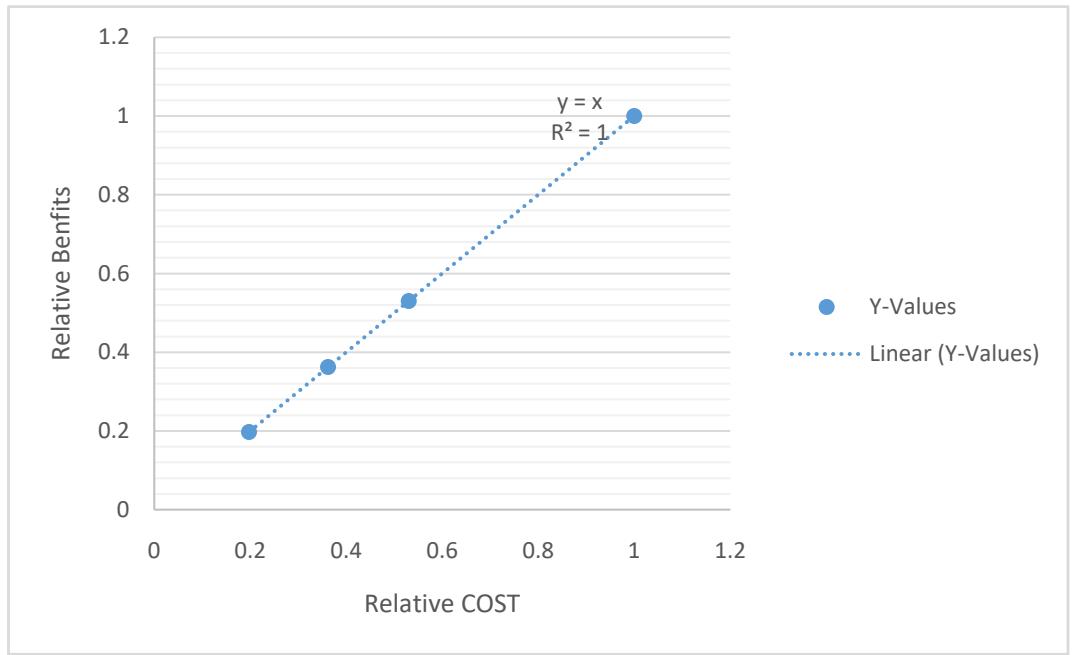
Figure 5: Categories of values
#### Improved SQ gap
In order to develop service improvement strategy for the Hajj campaigns (category B) there is a need to interpret SQ gap to identify areas of service improvement. Table 6 shows the service performances in four categories. The result shows that category A was rated as the best overall performer and is treated as ideal. For each service sub criteria were ranked with a satisfaction score. In order to assess category B position, the SQ gap was estimated for each SQ sub criteria. This implies that category B underperform category A in 26 SQ sub criteria when compared to the leader which is category A. In order to improve the Hajj campaign need to develop strategies based on these SQ gaps (Table 7). SQ ranking within each main SQ criteria, and overall SQ sub criteria has been estimated (Figure 2), which provide useful managerial insights.
## V. LIMITATIONS & SCOPE FOR FUTURE RESEARCH
There are limitations to this study. Firstly, SERVQUAL data was collected only from the perspective of Hajj pilgrims, which means that the results are valid only in the Hajj context because the data were derived from pilgrims' views. In addition, the possibility of bias where it was taken from the pilgrim's perspective. Secondly, the framework that was covered in this research work only helps identify and evaluate SQD in the categories of Hajj campaigns, and the approach does not address filling gaps or identifying future actions that need to be made to address deficiencies. However, the results of this study will serve as guided evidence for decision makers to identify weaknesses and improve them. Thirdly, in the present
research the AHP framework used modified SERVQUAL SQ dimensions to suit the context where five quality dimensions were used for quality assessment. Future research work should try to incorporate other dimensions to extend the framework that was proposed in this study or taking on other service dimensions. This would mean that the results would be more generalizable and would be applicable to other service sector industries.
For future studies, other scales of service quality measurement could be used to obtain data, such as fuzzy logic-based evaluation and service quality classification. Qualitative expert opinions could also be considered when evaluating service quality to prioritize other factors for improvement. In this case, pilgrims' satisfaction could be analysed and compared for pre- and post-improvement studies to measure the success of any activities that were implemented to improve service levels. Meanwhile, the number of observations could also be increased in future research to obtain a higher predictive performance.
## VI. MANAGERIAL IMPLICATIONS
Using the classification model, we propose will improve Hajj service quality provision by identifying necessary preventive actions that need to be taken and monitoring any fluctuations in observed or predicted quality of Hajj services. As such it should be possible to prevent the quality of services offered by Hajj service providers before any decrease in the quality level becomes irreversible. The study results have many managerial and practical implications, and the research offers a process based on the AHP-SQ framework for conducting the assessment of attributes of the service
quality dimensions in the Hajj context. The framework will help Hajj service providers to identify areas in which improvements in service quality need to be made and to compare the weaknesses and strengths of their services and identify any gaps by using SQD attributes. This will help decision makers to formulate strategies for the improvement of their SQ performance to achieve better levels of satisfaction for the pilgrims.
Using the AHP SQD framework in the Hajj context helps to identify categories of Hajj campaigns and their relative importance in terms of overall performance of service providers based on the SQD attributes. This framework will assist researchers when they identify service categories in Hajj campaigns service qualities need can be improved to improve the services offered and enhance pilgrims' satisfaction. In a modern world of resource constraints and changing market dynamics, this framework will help to identify which dimensions of SQ attributes need to be prioritized. The framework offers a holistic perspective of quality provision in literature in the Hajj context.
## VII. CONCLUSION
This research study has presented a framework to evaluate service quality to support the policymakers. It started by identifying service quality dimensions, and to evaluate attributes and decision alternatives, an AHP hierarchy was constructed to assess and identify aspects of service quality in different Hajj campaign categories to maintain the Hajj vision 2030 plans on terms of pilgrim satisfaction. Following this, pairwise comparisons were used to evaluate the relative priority weighting for each of the main criteria and subcriteria, and local priority weights were ascribed to each decision alternative with respect to each main and sub-criterion. These weights were added together to produce a global priority score. The priorities can be summarized by determining that tangible physical services were found to be the most crucial sub criterion, with a weight of $45.6\%$, followed by reliability $23.2\%$, responsiveness $11.9\%$, empathy $11\%$ and assurance $8\%$. The findings indicate the varying levels of importance for the sub-criteria within each service category, as reported in satisfaction ratings. This data offers valuable information on each sub-criterion, which can aid service providers in developing effective strategies for enhancing, adjusting, or elevating their existing levels of service quality. On the other hand, it can be acknowledged that the framework of this work can be applied to diverse services and sectors, whether governmental or private. For example, it can be applied to evaluate the quality of services provided in the healthcare sectors, education sectors, and in the aviation sector etc.
Overall, The AHP-SQ framework used in this study was proved to help decision makers to evaluate service quality during Hajj campaigns and service performance to improve the quality of services to keep up with Saudi Arabia's Vision 2030 goals.
### APPENDIX A
Questionnaire for measuring quality dimensions (SQD) provided in the categories of Hajj campaigns.
We use Analytical Hierarchical Method to compare each two criteria, for example, which please follow it.
For measuring and evaluating service quality dimensions in the categories of Hajj campaigns, which of the following criteria is most important and in which level.
#### 1. Tangibility or Reliability
Suppose that was your choice tangibility most important by 5 degrees than reliability where in
<table><tr><td>Intensity of importance</td><td>Definition</td></tr><tr><td>1</td><td>Equal importance</td></tr><tr><td>3</td><td>Somewhat more important</td></tr><tr><td>5</td><td>Much more important</td></tr><tr><td>7</td><td>Very much more important</td></tr><tr><td>9</td><td>Absolutely more important</td></tr><tr><td>2, 4, 6, 8</td><td>Intermediate values</td></tr></table>
Then we put a mark to the important criteria from your point of view
<table><tr><td></td><td>1</td><td>2</td><td>3</td><td>4</td><td>5</td><td>6</td><td>7</td><td>8</td><td>9</td></tr><tr><td>Tangibility</td><td></td><td></td><td></td><td></td><td></td><td></td><td></td><td></td><td></td></tr><tr><td>Reliability</td><td></td><td></td><td></td><td></td><td>✓</td><td></td><td></td><td></td><td></td></tr></table>
Note, in each question, please choose one number for intensity of importance in each criterion.
#### FIRST PART: GENERAL INFORMATION
Gender:
- Male
- Female
Age:
- 25-36
- 37-50
- 50+
Haji Experience:
- 。 2
- 。3
- 。4
- More than 4
#### SECOND PART: COMPARISON OF THE MAIN CRITERIA
Following criteria is most important and in which level.
#### 2. Tangibility or Reliability
<table><tr><td></td><td>1</td><td>2</td><td>3</td><td>4</td><td>5</td><td>6</td><td>7</td><td>8</td><td>9</td></tr><tr><td>Tangibility</td><td></td><td></td><td></td><td></td><td></td><td></td><td></td><td></td><td></td></tr><tr><td>Reliability</td><td></td><td></td><td></td><td></td><td></td><td></td><td></td><td></td><td></td></tr></table>
<table><tr><td></td><td>1</td><td>2</td><td>3</td><td>4</td><td>5</td><td>6</td><td>7</td><td>8</td><td>9</td></tr><tr><td>Tangibility</td><td></td><td></td><td></td><td></td><td></td><td></td><td></td><td></td><td></td></tr><tr><td>Reliability</td><td></td><td></td><td></td><td></td><td></td><td></td><td></td><td></td><td></td></tr></table>
#### 3. Tangibility or Responsiveness
<table><tr><td></td><td>1</td><td>2</td><td>3</td><td>4</td><td>5</td><td>6</td><td>7</td><td>8</td><td>9</td></tr><tr><td>Tangibility</td><td></td><td></td><td></td><td></td><td></td><td></td><td></td><td></td><td></td></tr><tr><td>Responsiveness</td><td></td><td></td><td></td><td></td><td></td><td></td><td></td><td></td><td></td></tr></table>
#### 4. Tangibility or Assurance
<table><tr><td></td><td>1</td><td>2</td><td>3</td><td>4</td><td>5</td><td>6</td><td>7</td><td>8</td><td>9</td></tr><tr><td>Tangibility</td><td></td><td></td><td></td><td></td><td></td><td></td><td></td><td></td><td></td></tr></table>
<table><tr><td></td><td>1</td><td>2</td><td>3</td><td>4</td><td>5</td><td>6</td><td>7</td><td>8</td><td>9</td></tr><tr><td>Tangibility</td><td></td><td></td><td></td><td></td><td></td><td></td><td></td><td></td><td></td></tr></table>
#### 5. Tangibility or Empathy
<table><tr><td></td><td>1</td><td>2</td><td>3</td><td>4</td><td>5</td><td>6</td><td>7</td><td>8</td><td>9</td></tr><tr><td>Tangibility</td><td></td><td></td><td></td><td></td><td></td><td></td><td></td><td></td><td></td></tr><tr><td>Empathy</td><td></td><td></td><td></td><td></td><td></td><td></td><td></td><td></td><td></td></tr></table>
#### 6. Reliability or Responsiveness
<table><tr><td></td><td>1</td><td>2</td><td>3</td><td>4</td><td>5</td><td>6</td><td>7</td><td>8</td><td>9</td></tr><tr><td>Reliability</td><td></td><td></td><td></td><td></td><td></td><td></td><td></td><td></td><td></td></tr><tr><td>Responsiveness</td><td></td><td></td><td></td><td></td><td></td><td></td><td></td><td></td><td></td></tr></table>
#### 7. Reliability or Assurance
<table><tr><td></td><td>1</td><td>2</td><td>3</td><td>4</td><td>5</td><td>6</td><td>7</td><td>8</td><td>9</td></tr><tr><td>Reliability</td><td></td><td></td><td></td><td></td><td></td><td></td><td></td><td></td><td></td></tr><tr><td>Assurance</td><td></td><td></td><td></td><td></td><td></td><td></td><td></td><td></td><td></td></tr></table>
#### 8. Reliability or Empathy
<table><tr><td></td><td>1</td><td>2</td><td>3</td><td>4</td><td>5</td><td>6</td><td>7</td><td>8</td><td>9</td></tr><tr><td>Reliability</td><td></td><td></td><td></td><td></td><td></td><td></td><td></td><td></td><td></td></tr><tr><td>Empathy</td><td></td><td></td><td></td><td></td><td></td><td></td><td></td><td></td><td></td></tr></table>
#### 9. Assurance or Empathy
<table><tr><td></td><td>1</td><td>2</td><td>3</td><td>4</td><td>5</td><td>6</td><td>7</td><td>8</td><td>9</td></tr><tr><td>Assurance</td><td></td><td></td><td></td><td></td><td></td><td></td><td></td><td></td><td></td></tr><tr><td>Empathy</td><td></td><td></td><td></td><td></td><td></td><td></td><td></td><td></td><td></td></tr></table>
#### THIRD PART: COMPARISON OF SUB CRITERIA
#### 1. Comparison of sub criteria for the main criteria (Tangibility)
With respect to measuring the tangibility, which of the following two sub criteria are more important and in which level?
<table><tr><td></td><td>1</td><td>2</td><td>3</td><td>4</td><td>5</td><td>6</td><td>7</td><td>8</td><td>9</td></tr><tr><td>Efficiency housing infrastructure</td><td></td><td></td><td></td><td></td><td></td><td></td><td></td><td></td><td></td></tr><tr><td>Variety choices of housing</td><td></td><td></td><td></td><td></td><td></td><td></td><td></td><td></td><td></td></tr><tr><td></td><td>1</td><td>2</td><td>3</td><td>4</td><td>5</td><td>6</td><td>7</td><td>8</td><td>9</td></tr><tr><td>Variety choices of meals</td><td></td><td></td><td></td><td></td><td></td><td></td><td></td><td></td><td></td></tr><tr><td>Additional services</td><td></td><td></td><td></td><td></td><td></td><td></td><td></td><td></td><td></td></tr><tr><td></td><td>1</td><td>2</td><td>3</td><td>4</td><td>5</td><td>6</td><td>7</td><td>8</td><td>9</td></tr><tr><td>Number of adequate staff size</td><td></td><td></td><td></td><td></td><td></td><td></td><td></td><td></td><td></td></tr><tr><td>Modern and clean facilities</td><td></td><td></td><td></td><td></td><td></td><td></td><td></td><td></td><td></td></tr></table>
#### 2. Comparison of sub criteria for the main criteria (Reliability)
With respect to measuring the reliability, which of the following two sub criteria are more important and in which level?
<table><tr><td></td><td>1</td><td>2</td><td>3</td><td>4</td><td>5</td><td>6</td><td>7</td><td>8</td><td>9</td></tr><tr><td>Efficient performance of services provided</td><td></td><td></td><td></td><td></td><td></td><td></td><td></td><td></td><td></td></tr><tr><td>Performing the services right at the first time.</td><td></td><td></td><td></td><td></td><td></td><td></td><td></td><td></td><td></td></tr><tr><td></td><td>1</td><td>2</td><td>3</td><td>4</td><td>5</td><td>6</td><td>7</td><td>8</td><td>9</td></tr><tr><td>Efficiency of check in - out process.</td><td></td><td></td><td></td><td></td><td></td><td></td><td></td><td></td><td></td></tr><tr><td>Remedial process for delayed or missing pilgrims</td><td></td><td></td><td></td><td></td><td></td><td></td><td></td><td></td><td></td></tr><tr><td></td><td>1</td><td>2</td><td>3</td><td>4</td><td>5</td><td>6</td><td>7</td><td>8</td><td>9</td></tr><tr><td>Remedial process for delayed or missing pilgrims</td><td></td><td></td><td></td><td></td><td></td><td></td><td></td><td></td><td></td></tr><tr><td>No complains</td><td></td><td></td><td></td><td></td><td></td><td></td><td></td><td></td><td></td></tr></table>
#### 3. Comparison of sub criteria for the main criteria (Responsiveness)
With respect to measuring the responsiveness, which of the following two sub criteria are more important and in which level?
<table><tr><td></td><td>1</td><td>2</td><td>3</td><td>4</td><td>5</td><td>6</td><td>7</td><td>8</td><td>9</td></tr><tr><td>Prompt services to pilgrims' orders.</td><td></td><td></td><td></td><td></td><td></td><td></td><td></td><td></td><td></td></tr><tr><td>Always willing to help pilgrims.</td><td></td><td></td><td></td><td></td><td></td><td></td><td></td><td></td><td></td></tr><tr><td></td><td>1</td><td>2</td><td>3</td><td>4</td><td>5</td><td>6</td><td>7</td><td>8</td><td>9</td></tr><tr><td>Keeping informed about the time of service.</td><td></td><td></td><td></td><td></td><td></td><td></td><td></td><td></td><td></td></tr><tr><td>Prompt response to passengers' requests or complaints</td><td></td><td></td><td></td><td></td><td></td><td></td><td></td><td></td><td></td></tr><tr><td></td><td>1</td><td>2</td><td>3</td><td>4</td><td>5</td><td>6</td><td>7</td><td>8</td><td>9</td></tr><tr><td>Prompt response to passengers' requests or complaints.</td><td></td><td></td><td></td><td></td><td></td><td></td><td></td><td></td><td></td></tr><tr><td>Employee behaviour and attitude instil confidence.</td><td></td><td></td><td></td><td></td><td></td><td></td><td></td><td></td><td></td></tr><tr><td>Safe places and facilities.</td><td></td><td></td><td></td><td></td><td></td><td></td><td></td><td></td><td></td></tr><tr><td>No accidents</td><td></td><td></td><td></td><td></td><td></td><td></td><td></td><td></td><td></td></tr><tr><td></td><td>1</td><td>2</td><td>3</td><td>4</td><td>5</td><td>6</td><td>7</td><td>8</td><td>9</td></tr><tr><td>Knowledge to answer pilgrims'</td><td></td><td></td><td></td><td></td><td></td><td></td><td></td><td></td><td></td></tr><tr><td>Individual attention to the health of pilgrims</td><td></td><td></td><td></td><td></td><td></td><td></td><td></td><td></td><td></td></tr><tr><td></td><td>1</td><td>2</td><td>3</td><td>4</td><td>5</td><td>6</td><td>7</td><td>8</td><td>9</td></tr><tr><td>Individual attention to the health of pilgrims</td><td></td><td></td><td></td><td></td><td></td><td></td><td></td><td></td><td></td></tr><tr><td>Existing assurance</td><td></td><td></td><td></td><td></td><td></td><td></td><td></td><td></td><td></td></tr></table>
#### 4. Comparison of sub criteria for the main criteria (Assurance)
With respect to measuring the assurance, which of the following two sub criteria are more important and in which level?
#### 5. Comparison of sub criteria for the main criteria (Empathy)
With respect to measuring the empathy, which of the following two sub criteria are more important and in which level?
<table><tr><td></td><td>1</td><td>2</td><td>3</td><td>4</td><td>5</td><td>6</td><td>7</td><td>8</td><td>9</td></tr><tr><td>Employees give personal attention to pilgrims.</td><td></td><td></td><td></td><td></td><td></td><td></td><td></td><td></td><td></td></tr><tr><td>Availability of high-tech services (webs, apps)</td><td></td><td></td><td></td><td></td><td></td><td></td><td></td><td></td><td></td></tr><tr><td></td><td>1</td><td>2</td><td>3</td><td>4</td><td>5</td><td>6</td><td>7</td><td>8</td><td>9</td></tr><tr><td>Understand the specific needs of Elderly care, children</td><td></td><td></td><td></td><td></td><td></td><td></td><td></td><td></td><td></td></tr><tr><td>Convenient schedules</td><td></td><td></td><td></td><td></td><td></td><td></td><td></td><td></td><td></td></tr></table>
#### APPENDIX B
Table Deriving priorities for rating on Reliability.
<table><tr><td></td><td>s</td><td>Low</td><td>Unsatisfactory</td><td></td></tr><tr><td>High</td><td>1.0</td><td>2.0</td><td>3.0</td><td>0.540</td></tr><tr><td>Low</td><td>0.5</td><td>1</td><td>2.0</td><td>0.297</td></tr><tr><td>Unsatisfactory</td><td>1/3</td><td>1/2</td><td>1.0</td><td>0.163</td></tr></table>
<table><tr><td>Reliability 0.232</td><td>Priorities weighted by 0.232.</td><td>idealized (Divide by largest value)</td></tr><tr><td>High</td><td>0.125</td><td>1.000</td></tr><tr><td>Low</td><td>0.068</td><td>0.544</td></tr><tr><td>Unsatisfactory</td><td>0.0378</td><td>0.302</td></tr></table>
Table Deriving priorities for rating on Responsiveness.
<table><tr><td></td><td>Excellent</td><td>Above average</td><td>Above average</td><td>Below average</td><td>Unsatisfactory</td><td></td></tr><tr><td>Excellent</td><td>1.0</td><td>2.0</td><td>3.0</td><td>4.0</td><td>5.0</td><td>0.419</td></tr><tr><td>Above average</td><td>0.5</td><td>1</td><td>2.0</td><td>3.0</td><td>4.0</td><td>0.263</td></tr><tr><td>Average</td><td>1/3</td><td>1/2</td><td>1.0</td><td>2.0</td><td>3.0</td><td>0.160</td></tr><tr><td>Below average</td><td>1/4</td><td>1/3</td><td>1/2</td><td>1</td><td>2</td><td>0.097</td></tr><tr><td>Unsatisfactory</td><td>1/5</td><td>1/4</td><td>1/3</td><td>1/2</td><td>1</td><td>0.062</td></tr></table>
Table Deriving priorities for rating on Assurance.
<table><tr><td>Responsiveness 0.119</td><td>Priorities weighted by 0.119.</td><td>idealized (Divide by largest value)</td></tr><tr><td>Excellent</td><td>0.049</td><td>1.000</td></tr><tr><td>Above average</td><td>0.031</td><td>0.632</td></tr><tr><td>Average</td><td>0.019</td><td>0.387</td></tr><tr><td>Below average</td><td>0.011</td><td>0.224</td></tr><tr><td>Unsatisfactory</td><td>0.007</td><td>0142</td></tr></table>
<table><tr><td></td><td>Average</td><td>Below average</td><td>Unsatisfactory</td><td></td></tr><tr><td>Average</td><td>1.0</td><td>2.0</td><td>3.0</td><td>0.540</td></tr><tr><td>Below average</td><td>0.5</td><td>1</td><td>2.0</td><td>0.297</td></tr><tr><td>Unsatisfactory</td><td>1/3</td><td>1/2</td><td>1.0</td><td>0.163</td></tr></table>
<table><tr><td>Assurance 0.084</td><td>Priorities weighted by 0.084.</td><td>idealized (Divide by largest value)</td></tr><tr><td>Average</td><td>0.045</td><td>1.000</td></tr><tr><td>Below average</td><td>0.025</td><td>0.555</td></tr><tr><td>Unsatisfactory</td><td>0.014</td><td>0.311</td></tr></table>
Table Deriving priorities for rating on Empathy.
<table><tr><td></td><td>Great</td><td>Moderate</td><td>Unsatisfactory</td><td></td></tr><tr><td>great</td><td>1.0</td><td>2.0</td><td>3.0</td><td>0.540</td></tr><tr><td>moderate</td><td>0.5</td><td>1</td><td>2.0</td><td>0.297</td></tr><tr><td>unsatisfactory</td><td>1/3</td><td>1/2</td><td>1.0</td><td>0.163</td></tr></table>
<table><tr><td>Empathy 0.11</td><td>Priorities weighted by 0.11.</td><td>idealized (Divide by largest value)</td></tr><tr><td>great</td><td>0.059</td><td>1.000</td></tr><tr><td>moderate</td><td>0.032</td><td>0.542</td></tr><tr><td>unsatisfactory</td><td>0.018</td><td>0.305</td></tr></table>
Generating HTML Viewer...
References
48 Cites in Article
Akhlaq Ahmad,Md. Rahman,Faizan Rehman,Ahmed Lbath,Imad Afyouni,Abdelmajid Khelil,Syed Hussain,Bilal Sadiq,Mohamed Wahiddin (2014). A framework for crowd-sourced data collection and context-aware services in Hajj and Umrah.
F Aldaihani,N Ali (2019). Impact of relationship marketing on customers loyalty of Islamic banks in the State of Kuwait.
B Angelova,J Zekiri (2011). Measuring customer satisfaction with service quality using American Customer Satisfaction Model (ACSI Model).
Masood Badri (2001). A combined AHP–GP model for quality control systems.
C Brugha (2004). Structure of multi-criteria decision-making.
Asma Bahurmoz (2006). A strategic model for safety during the Hajj pilgrimage: An ANP application.
A Bahurmoz (2006). The Analytic Hierarchy Process: A Methodology for Win-Win Management.
P Bradley (1994). What really matters?.
Amos Darko,Albert Chan,Ernest Ameyaw,Emmanuel Owusu,Erika Pärn,David Edwards (2019). Review of application of analytic hierarchy process (AHP) in construction.
M Dastorani (2022). Application of fuzzy-AHP method for desertification assessment in Sabzevar area of Iran.
Rola Masoud Mohammed,Wafa Ahmed Zaid,Prof. Bahurmoz (2024). Enhancing Hajj Pilgrim Satisfaction: A Strategic Analysis of Service Quality Dimensions using the Analytic Hierarchy Process in Alignment with Saudi Vision 2030.
Riyad Eid (2012). Towards a High-Quality Religious Tourism Marketing: The Case of Hajj Service in Saudi Arabia.
E Emtu (2017). Customer satisfaction evaluation of Al-Arafah Islami Bank ltd Mirpur-10 branch.
S Grand,K Wolff (2022). ASSESSING SAUDI VISION 2030: A 2020 REVIEW.
A Ishizaka,A Labib (2011). Review of the main developments in the analytic hierarchy process.
Osama Khassawneh (2022). An Evaluation of the Relationship between Human Resource Practices and Service Quality: An Empirical Investigation in the Canadian Hotel Industry..
V Kannan (2010). Benchmarking the service quality of ocean container carriers using AHP.
R Kugytė,L Šliburytė (2005). A standardized model of service provider selection criteria for different service types: a consumer-oriented approach.
Mohd Kurdi,Asniza Tharim,Noraidawati Jaffar,Abdul Wahid,Mohammad Shuib,Ismail Yusof,Balkhiz Ismail,Khairul Ma'arof (2012). Criteria for selection of service provider: Malaysian experience.
C Langley,G Allen,G Tyndall (2003). Thirdparty logistics study 2003: results and findings of the eighth annual study.
C Lynch (2000). Logistics outsourcing: a management guide.
R Mohammed (2021). Optimizing Temporal Business Opportunities.
R Mohammed,M Yaqub (2024). The Role of Relationship Quality in Collaborative Knowledge Networks and Organizational Learning in Enhancing the Quality of Hajj Services.
R Masoud (2022). Evaluate the Services Provided to Pilgrims According to Vision 2030.
George Miller (1956). The magical number seven, plus or minus two: Some limits on our capacity for processing information..
B Othman,A Harun,W Rashid,R Ali (2019). The impact of Umrah service quality on customer satisfaction towards Umrah travel agents in Malaysia.
Bestoon Othman,Amran Harun (2020). The Effect of Umrah Service Quality on Umrah Customer Satisfaction and Umrah Customer Loyalty: Evidence from Umrah traveling agents in Malaysia.
Miklós Pakurár,Hossam Haddad,János Nagy,József Popp,Judit Oláh (2019). The Service Quality Dimensions that Affect Customer Satisfaction in the Jordanian Banking Sector.
A Parasuraman,V Zeithaml,L Berry (1988). SERVQUAL: A multiple-item scale for measuring consumer perceptions of service quality.
A Parasuraman,Valarie Zeithaml,Leonard Berry (1985). A Conceptual Model of Service Quality and Its Implications for Future Research.
M Razzaque,C Sheng (1998). Outsourcing of logistics functions: a literature survey.
Robert Rickards (2003). Setting benchmarks and evaluating balanced scorecards with data envelopment analysis.
M Ridha,R Harris (2020). Service Quality Related to Customer Satisfaction with Umrah Worship Package Preparation at PT. Marco Tour and Travel Jakarta: Spearman's Correlation Coefficient.
Thomas Saaty (2016). The Analytic Hierarchy and Analytic Network Processes for the Measurement of Intangible Criteria and for Decision-Making.
Thomas Saaty (2008). Decision making with the analytic hierarchy process.
Thomas Saaty,M Ozdemir (2005). The Analytic Network Process – Dependence and Feedback in Decision-Making.
T Saaty,M Ozdemir (2003). Why the magic number seven plus or minus two.
Thomas Saaty,Luis Vargas (2001). How to Make A Decision.
Thomas Saaty (2012). Fundamentals of the Analytic Hierarchy Process.
T Saaty,E Forman (1996). The Hierarchon: A Dictionary of Hierarchies, Issue 5 of Analytic hierarchy process series, Expert choice.
Thomas Saaty,Kevin Kearns (1985). The Analytic Hierarchy Process.
Thomas Saaty (1994). Highlights and critical points in the theory and application of the Analytic Hierarchy Process.
R Shanker,S Jharkharia (2007). Selection of logistics service provider: An analytic network process (ANP) approach.
D Smith (2020). Structured Decision Making: Case Studies in Natural Resource Management.
Theodore Stank,Patricia Daugherty (1997). The impact of operating environment on the formation of cooperative logistics relationships.
Emmanouil Stiakakis,Christos Georgiadis (2009). E‐service quality: comparing the perceptions of providers and customers.
M Velasquez,P Hester (2013). An analysis of multi-criteria decision-making methods.
V Zeithaml (2000). Service quality, profitability, and the economic worth of customers: what we know and what we need to learn.
No ethics committee approval was required for this article type.
Data Availability
Not applicable for this article.
How to Cite This Article
Rola Younis Masoud. 2026. \u201cEnhancing Hajj Pilgrim Satisfaction: A Strategic Analysis of Service Quality Dimensions using the Analytic Hierarchy Process (AHP) in Alignment with Saudi Vision 2030\u201d. Global Journal of Management and Business Research - A: Administration & Management GJMBR-A Volume 24 (GJMBR Volume 24 Issue A3).
Explore published articles in an immersive Augmented Reality environment. Our platform converts research papers into interactive 3D books, allowing readers to view and interact with content using AR and VR compatible devices.
Your published article is automatically converted into a realistic 3D book. Flip through pages and read research papers in a more engaging and interactive format.
Our website is actively being updated, and changes may occur frequently. Please clear your browser cache if needed. For feedback or error reporting, please email [email protected]
Thank you for connecting with us. We will respond to you shortly.
Lorem ipsum dolor sit amet, consectetur adipiscing elit. Ut elit tellus, luctus nec ullamcorper mattis, pulvinar dapibus leo.
Enhancing Hajj Pilgrim Satisfaction: A Strategic Analysis of Service Quality Dimensions using the Analytic Hierarchy Process (AHP) in Alignment with Saudi Vision 2030