
I. INTRODUCTION
Power consumption of refrigeration plants makes to from total power consumption of retail store.
Because of ozone depletion and global warming risks, we ought to use new ecological friendly refrigerants, which require improving refrigeration components, processes and cycle architecture to increase energy efficiency.
We need to use methods that could help to improve energy efficiency based on scientific methods.
There are some methods that used for thermodynamic analysis - energy method, exergy method and entropic and statistical method.
Energy method of analysis based on first law of thermodynamic and does not allow getting information about energy losses by system components. Exergy and entropic and statistical method based both on first and second laws of thermodynamic, but usage of entropic and statistical methods for system analysis used for cold generation is preferable.
In this paper introduced usage of entropic and statistical method of analysis for refrigeration plants operation.
II. ENTROPIC AND STATISTICAL ANALYSIS OF REFRIGERATION PLANTS
a) Entropic and Statistical Method of Analysis
Real processes in refrigeration plants are irreversible and nonequilibrium.
The reason of irreversibility is finite difference of mass streams potentials (temperature difference, pressure difference etc.) due to processes nonequilibrium.
The measure of irreversibility is entropy production. According to second law of thermodynamics:
The entropy has property of additivity e.g. total entropy production of the system equal to the sum of entropy change of each sub-system.:
where - entropy production in sub-systems, - sub-systems quantity.
According to Gyui-Stodola's theorem, for it is necessary to perform work for entropy production compensation. This work will be transferred to environment as heat. The total work spent for refrigeration plant operation will equal:
- minimum work for ideal refrigeration cycle with total reversible processes.
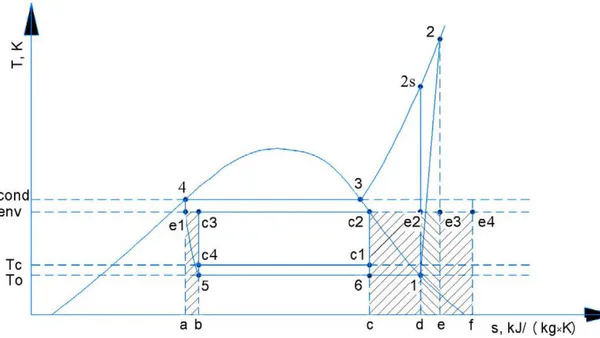
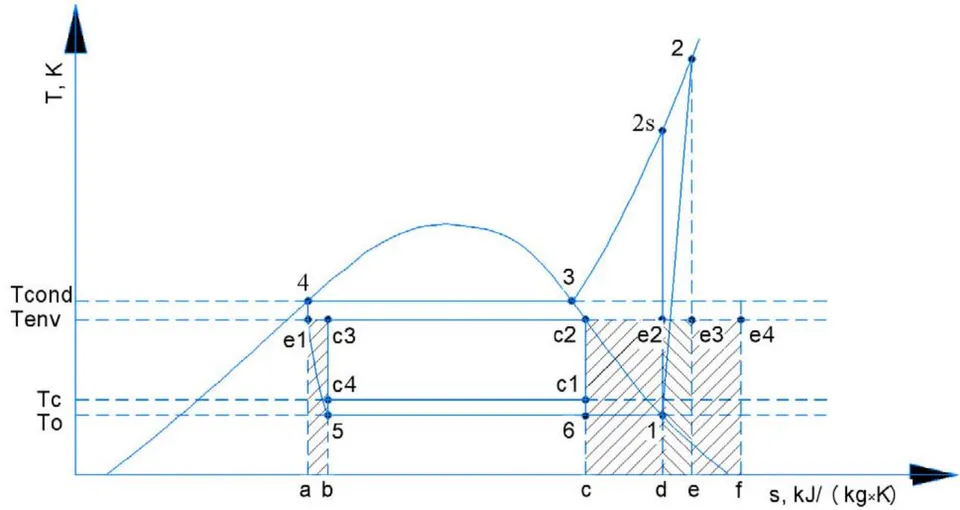
Distribution of energy expenses for entropy production compensation for one stage refrigeration cycle is shown on Figure 1.
Ideal Carnot cycle (c1-c2-c3-c4) is totally reversible, it means that work, which is spent for cold generation, will be minimum and is expressed by the area c1-c2-c3-c4. Real cycle is expressed by the area 1-2-3-4-5-6. Work, which is necessary for entropy production compensation in compressor, is expressed by area d-e-e3-e2. Area e3-2-3-4-e1 or equal to it in size e-f-e4-e3 expresses work, which is necessary for entropy production compensation in condenser. Work,
which is necessary for entropy production compensation in evaporator, is expressed by area c-d-e2-c2, in throttling devices – by area a-b-c3-e1.
Total real work for single stage refrigeration cycle is expressed by the sum of areas.
Analysis of the single stage refrigeration cycle analysis will be carried out in the following sequence.
Specific mass cooling capacity at evaporation temperature.
Minimum specific work which is necessary for cold generation.
Adiabatic compression work, calculated by using h-lgp diagram:
Actual specific compression work.
Degree of thermodynamic efficiency.
COP at adiabatic compression.
Actual value of COP.
Part of compression work, which is necessary for entropy production compensation in condenser, is the sum of parts of compression works for entropy production compensation in gas cooling process and condensation process :
where
Part of compression work, which is necessary for entropy production compensation in throttling process.
Part of compression work, which is necessary for compensation of entropy production in heat transferring processes from cooling object to refrigerant (evaporation).
Part of compression work, which is necessary for compensation of entropy production in heat transferring processes from cooling object to refrigerant (total).
Specific adiabatic compression work is a sum of parts of compression work for compensation of entropy production in all processes of refrigeration cycle.
Energetic losses in compressor.
Rated compression work.
By using analysis results, the chart of distribution losses on system elements can be constructed.
b) Refrigeration Plant Analysis in Case of Condensation Pressure Algorithm Change
One of the goals, which is very important to refrigeration equipment end user, is to evaluate results of implementation of new technical solution (usage of more efficiency compressors, heat exchangers, new control algorithms etc).
The goal of refrigeration plant optimization (it is located in Moscow, Russia) was energy consumption reduction. This plant work with R404A as refrigerant and used for 10 medium temperature consumers. Design date is shown in Table 1.
| Cycle | Single Stage |
| Refrigerant | R404A |
| Evaporation temperature, °C | -10 |
| Condensation temperature, °C | +45 |
| Suction gas superheat, K | 15 |
| Liquid subcooling, K | 0 |
| Condenser type | Air cooled |
| Cooling capacity, kW | 33,8 |
| Quantity of compressors, pcs. | 2 |
| Compressor type | scroll |
| Model | ZB76KCE-TFD - 1 pcs. ZBD76KCE-TFD - 1 pcs. |
| Consumers quantity, pcs. | 10 |
| Thermal processing | Storage |
| Product type | Egg (1 consumer), milk products (6 consumers), sausages (2 consumers), fish (1 consumer) |
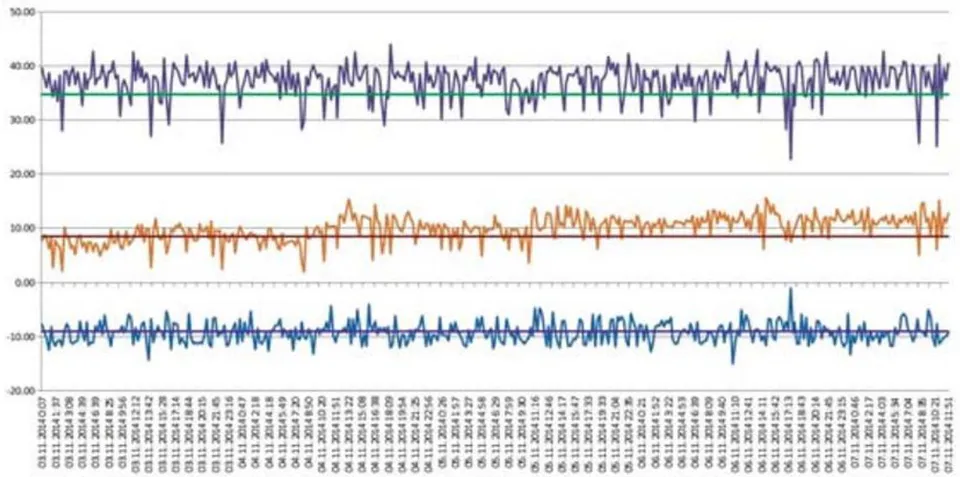
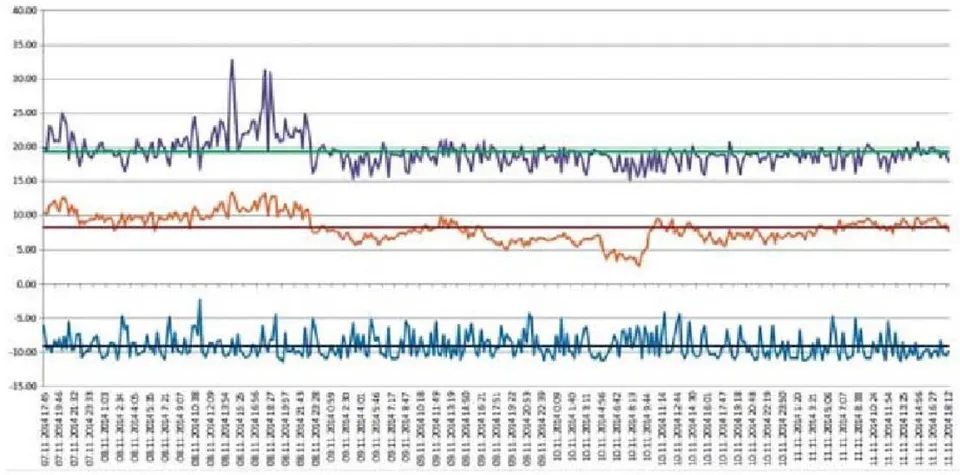
There were two measurement periods - 4.5 days with fixed condensing set point (condensation pressure was keeping on the same value) and 4.5 days with floating condensing set point (condensation pressure was changing depending on ambient temperature).
Initial date (average values for considered period) is given in Table 2, changing of operating parameters is shown on Figs. 2 and 3, where System 1 is refrigeration plant before algorithm change, System 2 is refrigeration plant after algorithm change.
| Temperatures, °C | System 1 | System 2 |
| Evaporation | -9.0 | -9.07 |
| Condensation | +34.79 | +19.33 |
| Ambient | +8.51 | +8.18 |
| Air in cooling volume | +1.95 | +2.1 |
| Adiabatic efficiency was taken from selection software of compressor manufactures | ||
| Adiabatic efficiency | 0.7117 | 0.6661 |
Because there was not possibility to measure all necessary values by using regular devices, some values were taken according to statistical information:
- Total superheat on suction line 12 K;
- Calculation of energetic losses in evaporator was done by using average value of cooling air temperature in all cooling room.


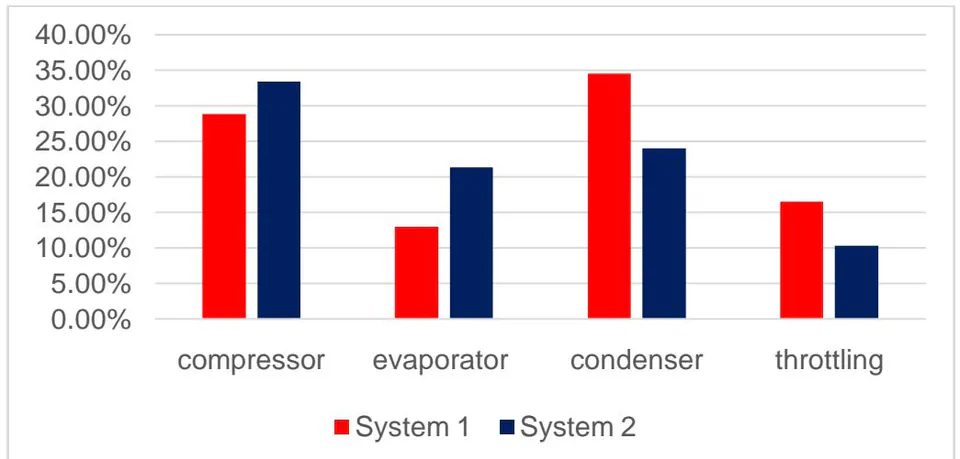
Analysis results are given in Table 3 and on Fig.
| - | System 1 | System 2 |
| q0, kJ/kg | 119.71 | 144.52 |
| Imin, kJ/kg | 2.88 | 3.19 |
| Is.calc, kJ/kg | 27.96 | 19.32 |
| Icomp, kJ/kg | 39.24 | 29.00 |
| ηtherm | 0.0795 | 0.1184 |
| εact | 3.05 | 4.98 |
| ΔIcond,% | 34.45 | 23.98 |
| ΔIthr,% | 16.47 | 10.29 |
| ΔIevap,% | 12.91 | 21.32 |
| ΔIcomp,% | 28.83 | 33.4 |
c) Efficiency Analysis at Refrigerant Plant Operation with Different Working Cycles
One more and, perhaps, more relevant task is the analysis of various systems with different working cycles.
Comparison of two systems is given below. System 3 works by using single stage refrigeration cycle, located in Moscow. System 4 works by using refrigeration cycle with economizer, located in Volgsky, Russia. Design date is shown in Table 4.
| System 3 | System 4 | |
| Refrigerant | R404A | R404A |
| Refrigeration cycle | Single stage | With economizer |
| Evaporation temperature, °C | -35 | |
| Condensation temperature, °C | +40 | |
| Suction superheat, K | 15 | |
| Liquid subcooling, K | 0 | |
| Temperatures, °C | ||
| evaporation | -33.46 | -32.58 |
| condensation | +36.75 | +31.35 |
| ambient | +10.58 | +15.98 |
| air in cooling volume | -15.14 | -16.25 |
| Average superheat in evaporators, K | 13.67 | 9.73 |
| Adiabat | ||
As in the previous case, operation parameters were taken from monitoring system for specified period. Initial average date for analysis is given in Table 5.
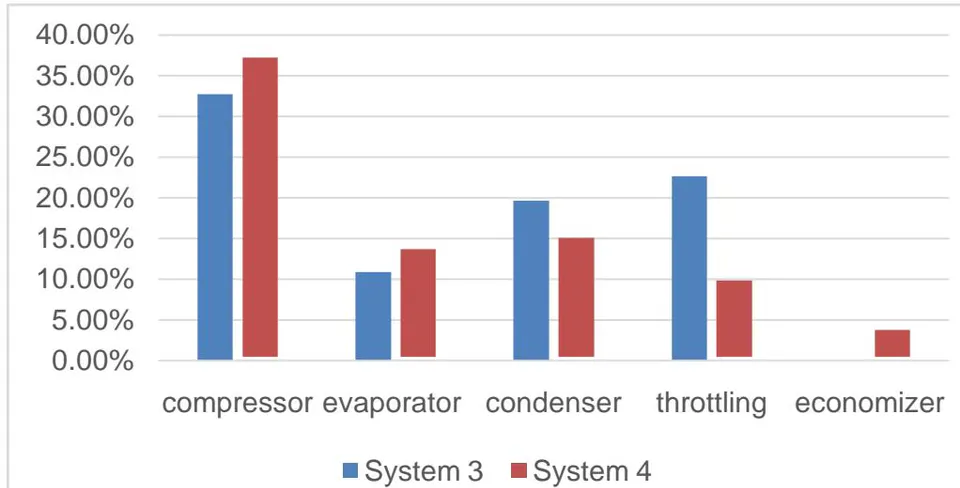
Analysis results are given in Table 6 and on Fig.
| System 3 | System 4 | |
| q0, kJ/kg | 101.89 | 167.31 |
| Imin, kJ/kg | 10.73 | 22.17 |
| Is.calc, kJ/kg | 50.67 | 61.91 |
| Icomp, kJ/kg | 75.31 | 97.97 |
| ηtherm | 0.149 | 0.214 |
| εact | 1.35 | 1.71 |
| ΔIcond,% | 19.59 | 14.64 |
| ΔIthr,% | 22.58 | 9.41 |
| ΔIevap,% | 10.88 | 13.2 |
| ΔIcomp,% | 32.7 | 36.78 |
| ΔIeco,% | - | 3.34 |
III. CONCLUSIONS
Application of entropic and statistical method of the analysis during cooling plant operation allows increasing energy efficiency because we can get information about losses in different refrigeration plant components and take measures to increase their operation efficiency. It is possible to use regularly installed sensors.
The most appropriate value for comparison of energy efficiency different cooling plants is the degree of thermodynamic efficiency.
Changing control algorithm of condensation pressure from maintenance of the fixed setting to floating setting allow to increase the degree of thermodynamic efficiency on and decrease power consumption on . Power consumption was measured by using special sensors.
The degree of thermodynamic efficiency refrigeration plant working with refrigeration cycle with economizer is higher than the degree of thermodynamic efficiency refrigeration plant working with single stage refrigeration cycle on . Date was received during operation of real refrigeration plants.