The demographic misrepresentation in organizations is a key business and social issue across the world in establishments of all kinds. In many institutions and businesses there is a conscious effort to improve diversity, but understanding and calculating what constitutes a diverse workforce is challenging. The purpose of this paper is to provide methodology for calculating diversity parameters for race and ethnicity based on country and business specifics.
## I. DIVERSITY DEFINITION AND HISTORY
There are numerous definitions of diversity published in dictionaries, publications and books. The most comprehensive definition is provided by the Global Diversity Practice organization: "Diversity is any dimension that can be used to differentiate groups and people from one another. In a nutshell, it's about empowering people by respecting and appreciating what makes them different, in terms of age, gender, ethnicity, religion, disability, sexual orientation, education, and national origin." (Global Diversity Practice, 2022).
## II. ANALYZING DIVERSITY IN ORGANIZATIONS
Governments and large corporations have been taking actions to improve diversity and inclusion within their organizations. Many of them have formed medium to large teams with high level management and the predominant goal of improving diversity. One of the main data points that they review first is employee structure, in most cases, by gender and ethnicity. This information is usually available as part of the organizations' employee records. The subsequent set of essential data is to establish diversity targets.
Many companies have simply adopted the target of a broader society diversity. These organizations are hence being partial to the following definition by Wah: "Diversity", refers to an employee base that is representative of the differences apparent in the broader society (Wah, 1999, p24-30). If the definition is interpreted as simple as what it states, then, for example, if the USA female population is $50.8\%$ (Census, 2022), subsequently $50.8\%$ of employees should be female at any level. Through various experiences it has been shown that a majority of larger organizations have made the same assumption and are using the overall population distribution as the diversity target at all levels.
This approach should not be followed as there are factors that have an impact on the population count and distribution. These variables must be considered when diversity targets are created. This paper will review the following two criteria: labor participation rate and completed degree. For better precision other factors can be evaluated including but not limited to geographical distribution, industry requirements, experience, etc.
## III. DIVERSITY TARGET CALCULATIONS
For one to calculate the diversity target by level, the starting criteria should always be the national population. Based on Census, the estimated USA populations as of July 2021 is 331,893,745. The base population should be first adjusted with these numbers— $6\%$ under 18 and $16.5\%$ over 65—as we are looking for people of working age. The updated population will then be adjusted for participation rate which varies by gender and race, and consequently the college gradate percentages will be applied.
The calculations will be made for Female, Asian Americans (Asian), African Americans (AA), Hispanic and White (Hispanic not included).
When the total population is adjusted for people of working age then the total population is changed from $332M to $257M, or a reduction of $65M. The assumption here is that the 6% under the age of 18 and 16.5% over the age of 65 are the same for all genders and races. An additional level of precision can be added if gender is reduced by the actual percent of under 18 and over 65 years old for each race mentioned above.
The percent split by race and gender remains the same: female $50.8\%$, AA $13.4\%$, Asian $5.9\%$,
The details for the calculations are provided in Table 1.
Table 1: Diversity Calculations
<table><tr><td rowspan="2" colspan="3">Ovarall Population</td><td>Working</td><td rowspan="2" colspan="3">Participation Rate</td><td rowspan="2" colspan="3">College Degree</td></tr><tr><td>W/0 <18 >66</td></tr><tr><td>Total Population</td><td></td><td>331,893,745</td><td>257,217,652</td><td></td><td>159,109,695</td><td></td><td></td><td>59,568,212</td><td></td></tr><tr><td>under 18</td><td>6%</td><td></td><td></td><td></td><td>163,607,918</td><td></td><td></td><td>49,826,147</td><td></td></tr><tr><td>>65</td><td>16.50%</td><td></td><td></td><td></td><td></td><td></td><td></td><td></td><td></td></tr><tr><td>Female</td><td>50.8%</td><td>168,602,022</td><td>130,666,567</td><td>56.2%</td><td>73,434,611</td><td>46.2%</td><td>38.3%</td><td>28,125,456</td><td>47.2%</td></tr><tr><td>Male</td><td>49.2%</td><td>163,291,723</td><td>126,551,085</td><td>67.7%</td><td>85,675,085</td><td>53.8%</td><td>36.7%</td><td>31,442,756</td><td>52.8%</td></tr><tr><td>White</td><td>76.3%</td><td>253,234,927</td><td>196,257,069</td><td></td><td></td><td></td><td></td><td></td><td></td></tr><tr><td>AA</td><td>13.4%</td><td>44,473,762</td><td>34,467,165</td><td>60.5%</td><td>20,852,635</td><td>12.7%</td><td>25.2%</td><td>5,254,864</td><td>10.5%</td></tr><tr><td>AIAN</td><td>1.3%</td><td>4,314,619</td><td>3,343,829</td><td>61.0%</td><td>2,039,736</td><td>1.2%</td><td></td><td></td><td></td></tr><tr><td>Asian</td><td>5.9%</td><td>19,581,731</td><td>15,175,841</td><td>61.0%</td><td>9,257,263</td><td>5.7%</td><td>56.5%</td><td>5,230,354</td><td>10.5%</td></tr><tr><td>NHO</td><td>0.2%</td><td>663,787</td><td>514,435</td><td>61.0%</td><td>313,806</td><td>0.2%</td><td></td><td></td><td></td></tr><tr><td>Hispanic</td><td>18.5%</td><td>61,400,343</td><td>47,585,266</td><td>65.6%</td><td>31,215,934</td><td>19.1%</td><td>18.3%</td><td>5,712,516</td><td>11.5%</td></tr><tr><td>Two or more races</td><td>2.8%</td><td>9,293,025</td><td>7,202,094</td><td>61.0%</td><td>4,393,278</td><td>2.7%</td><td></td><td></td><td></td></tr><tr><td>White alone</td><td>60.1%</td><td>199,468,141</td><td>154,587,809</td><td>61.8%</td><td>95,535,266</td><td>58.4%</td><td>35.2%</td><td>33,628,414</td><td>67.5%</td></tr></table>
### a) Adjustment calculation for Participation Rate by gender and race
The labour force participation rate is the percentage of the working-age population — the civilian noninstitutional population age is 16 or older — in the labour force. The labour force measures how many Americans are working or are actively seeking work — it's the sum of the employed population and the unemployed population. Unemployed is defined by a person who is out of a job but has looked for work in the past month. Meanwhile, anyone who is not employed and has not looked for work in the past month is not considered to be in the labour force. (usafacts.com, 2022).
The data for the analysis in this paper is taken from the Bureau of Labor statistics (bls.gov, 2022). The following are the rates by race and gender: Female $56.2\%$, male $67.7\%$, AA $60.5\%$, Asian $61\%$, Hispanic $65.6\%$, and White $65.8\%$. When these rates are applied to the working age population, the percent for gender and race are adjusted as follows:
Female from $50.8\%$ to $46.2\%$
Male from $49.2\%$ to $53.8\%$
AA from $13.4\%$ to $12.7\%$
Asian from $5.9\%$ to $5.7\%$
Hispanic from $18.5\%$ to $19.1\%$
White from $60.1\%$ to $58.4\%$
Labour force participation is a dynamic number and should be constantly reviewed and subsequently the diversity calculations should be readjusted.
### b) Adjustment calculation for College Degree by gender and race
Another important factor that impacts the population base and should be included in the diversity calculation is college attainment. Educational attainment
refers to the highest level of education that an individual has completed.
The data for education attainment in this paper is founded on statista.com (statista.com, 2022)
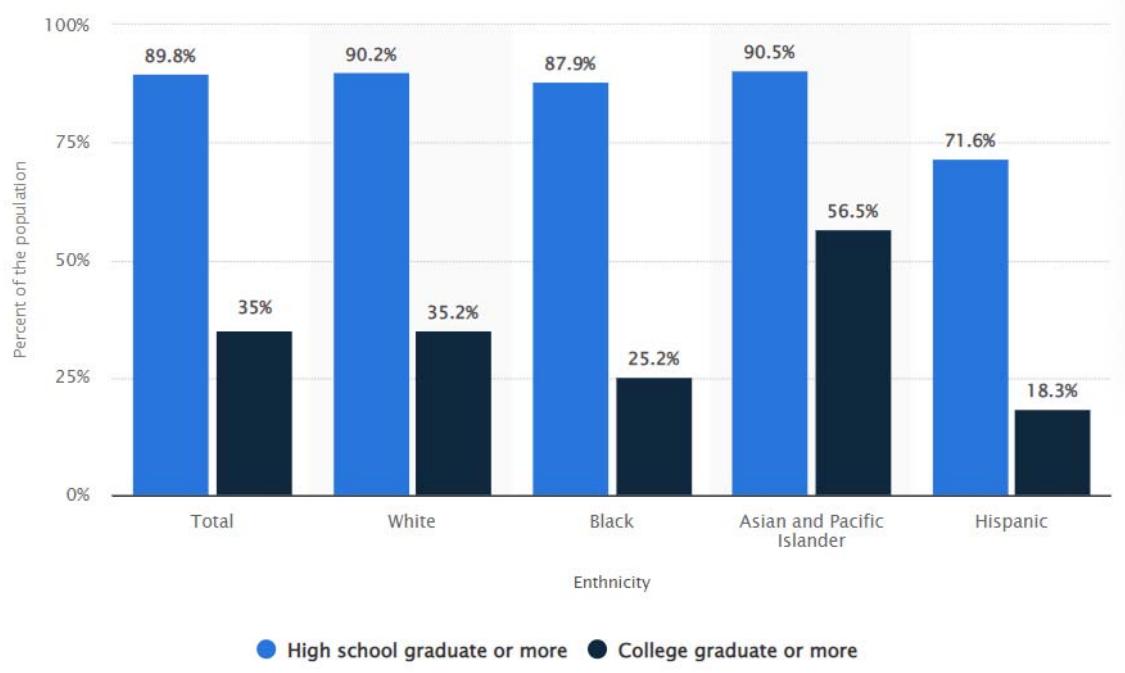
Figure 1: College attainment in USA by race
Source: statista.com
As you can see there are vast variances in education attainment by race.
Those variances have an impact on the population for diversity as follows:
AA from $12.7\%$ to $10.5\%$
Asian from $5.7\%$ to $10.5\%$
Hispanic from $19.1\%$ to $11.5\%$
White from $58.4\%$ $67.5\%$
There is an impact based on gender and college attainment as well. The data is sourced from statita.com (statista.com, 2022). The most recent data shows that female college attainment is $38.3\%$, while male college attainment is $36.7\%$.
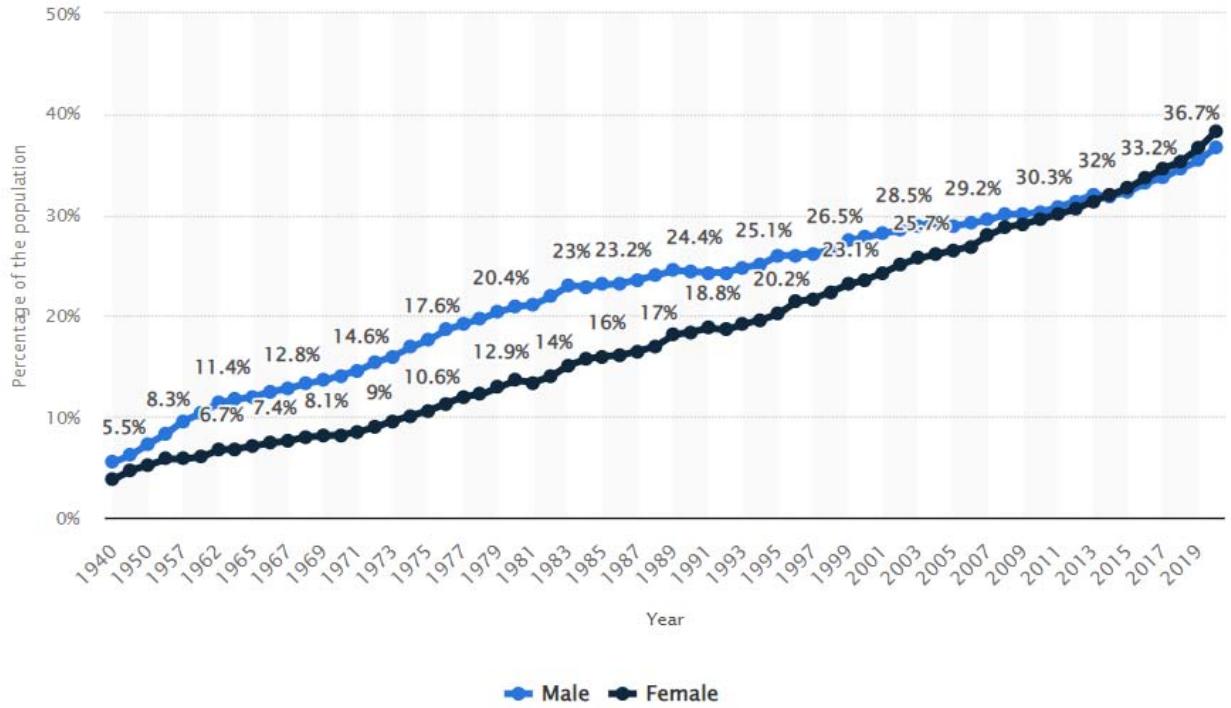
Figure 2: College attainment in USA by gender
Source: statista.com
Based on gender and college attainment the diversity calculations will change as follows:
Female from $46.2\%$ to $47.2\%$
Male from $53.8\%$ to $52.8\%$.
The college attainment by gender number is dynamic, therefore the diversity calculation should be readjusted on a regular basis.
Diversity distribution numbers change whether the factors are population distribution by race and gender or other applied factors such as working population, participation rate and college attainment are adjusted for.
These are the recommended diversity targets based on the factors that were applied:
Female $47.2\%$ (changed from $50.8\%$ )
Male $52.8\%$ (changed from $49.2\%$ )
AA $10.5\%$ (changed from $13.4\%$ )
Asian $10.5\%$ (changed from $5.9\%$ )
Hispanic $11.5\%$ (changed from $18.5\%$ )
White $67.5\%$ (changed from $60.1\%$)
Unfortunately, while there are more females with higher education than males, female work participation is lower than the forecasted female population that is appropriate for management level roles.
For the AA population and even more so for the Hispanic population, the factor that has the largest impact on reducing the population available for higher roles is their college degree. It is important to consider socioeconomic factors which may have an impact on these results. Therefore, nationwide programs should make higher education available to everyone equally.
On the contrary, increased college degree rates among Asians stand to increase the number of Asians suitable for higher level positions.
There are many other factors that should be considered when calculating diversity. These targets should be calculated by each level (entry, associate, senior) and should be based on each level's unique requirements. Each level will look different in terms of gender and diversity as these factors do not have the same population distribution.
## IV. CONCLUSION AND RECOMMENDATIONS
Large organization utilize analytics to make decisions daily, therefore doing these analytics correctly is essential. When analytics is used for sensitive topics such as diversity, it can have a huge impact (negative or positive) on the organization's productivity, legal responsibilities, and moral obligations.
When considering diversity targets there cannot simply be an overall population split that is expected to have the same distribution applied to all levels in the organization. The higher the role, the higher the expectations. Therefore, the job criteria will vary, and numerous factors should be considered while calculating diversity targets.
This paper does not provide the complete impact of all factors when calculating for diversity, but rather, it aims to show the basics for calculating diversity targets of an organization.
Generating HTML Viewer...
References
6 Cites in Article
Anne Ubersfeld (2011). Références des articles.
L Wah (1999). Diversity at Allstate.
(2022). Bureau of Labor Statistics (BLS).
Julie O'mara (2022). Global Benchmarks for Diversity and Inclusion.
No ethics committee approval was required for this article type.
Data Availability
Not applicable for this article.
How to Cite This Article
Galina Manahilova. 2026. \u201cEstablishing Diversity Targets for Race and Ethnicity in the Organization\u201d. Global Journal of Management and Business Research - A: Administration & Management GJMBR-A Volume 22 (GJMBR Volume 22 Issue A3).
Explore published articles in an immersive Augmented Reality environment. Our platform converts research papers into interactive 3D books, allowing readers to view and interact with content using AR and VR compatible devices.
Your published article is automatically converted into a realistic 3D book. Flip through pages and read research papers in a more engaging and interactive format.
Our website is actively being updated, and changes may occur frequently. Please clear your browser cache if needed. For feedback or error reporting, please email [email protected]
Thank you for connecting with us. We will respond to you shortly.