Estimation of Land Surface Temperature (LST) and Soil Moisture Index (SMI) using Satellite Image: A Case Study in BharatpurMunicipality, Chitwan, Nepal
Monitoring and predicting variations in land surface temperature (LST) and soil moisture index (SMI) using remote sensing technology and modeling methodologies has become essential for making knowledgeable choices regarding crop production, surface evaporation calculation, identification of potential groundwater, and sustain able land use practices. LANDSAT data has opened new possibilities for studying land processes through remote sensing. This study aims to estimate LST and SMI in the Bharatpur municipality, Chitwan, Nepal using ArcGIS software and Landsat 8 data. The four bands of Landsat 8 including band 4, band 5, band 10, and band 11 are used. Running various empirical formulas including normalized difference vegetation index, atmosphere radiance, satellite brightness temperature, land surface emissivity and using the Landsat bands within ArcGIS, processing on the geographic coordinate system (World Geodetic System 1984) and the projected coordinate system UTM (Universal Transverse Mercator) zone 45 N, facilitates the estimation of both land surface temperature and soil moisture index.
## I. INTRODUCTION
L and surface temperature is the recorded radiative skin temperature of the land surface measured in the direction of the remote sensor. It refers to how hot the surface of a specific location is, where radiative skin temperature is the temperature of the Earth's surface as measured by its emitted thermal radiation. It is computed by using the top-of-atmospheric brightness temperature from the infrared spectral channels of a constellation of geostationary satellites where the top-of-atmospheric brightness temperature indicates the temperature of the Earth's surface as observed from space without any atmospheric interference. Advan & Jovanovska (2016)identified that LST is a critical factor in many studies, including global climate change, hydrological and agricultural processes, and urban land use & land cover, while Anandababu et al. (2018) state that LST is the key factor for calculating the highest and lowest temperature of a particular location. Land surface temperature affects the rate of evaporation from the soil. High LST increases surface evaporation, which directly affects the soil moisture condition and may lead to drought in a particular area. The Soil Moisture Index (SMI) measures the moisture content of the soil at various depths, which is prominently influenced by precipitation through infiltration. It is a highly changeable variable that varies on a small scale depending on soil properties and drainage patterns. Entezari et al., (2019) insist the soil moisture index plays an essential role in managing water and soil resources. It is measured in index value, which ranges from 0 to 1, with 0 indicating extreme dry conditions and 1 indicating extreme wet conditions.
The land surface temperature and soil moisture index can be regularly estimated for a large region using remote sensing and GIS techniques. In this case study, the estimation of land surface temperature and soil moisture index focuses on near-surface soil moisture, which is typically the top 5 centimeters or less of the topsoil profile. Tajudin et al. (2021) argue that in recent years, remote sensing and GIS have emerged as advanced and more effective tools for monitoring soil moisture index and land surface temperatures. In this study, land surface temperature and soil moisture index are estimated using thermal emission, vegetation cover, and reflected radiation. Thermal emission is the energy released by any object in the form of electromagnetic radiation due to its temperature, vegetation cover reduces the land surface temperature, and reflected radiation from the surface are the factors that directly affect the rate of the temperature of the earth's surface.
## II. STUDY AREA
Bharatpur municipality is part of Chitwan Dune Valley nestled between the range of Mahabharat and Siwalik, at the foothills of the Himalayas (Malla and Karki 2016), which is located in the mid-southern part of Nepal. It experiences a tropical to subtropical climate, with a variety of weather seasons in a year. The average temperature in the area is reported to be $25^{\circ}\mathrm{C}$ with annual rainfall ranging from 2000 to $2500\mathrm{mm}$ (Luitel et al., 2020). Approximately, $80\%$ of the total annual rainfall occurs during the monsoon months between June and September (Pant et al., 2021). The municipality is about $146\mathrm{km}$ from the capital, Kathmandu, with an area of $433\mathrm{km}^2$ with an elevation of $138\mathrm{m} - 1178\mathrm{m}$ above sea level. According to the National Census 2021, the population of this area is 369,377.
Figure 1 shows the map of Bharatpur municipality with physical features consists rivers, classified elevation, road networks, and forests. The municipality is bounded by two rivers, Narayani from the west and Rapti from the south. The topography of the southern part is plain and consists of fertile land, while the northern part exhibits varying elevations, ranging from small to high hills. Land cover analysis reveals that the mid southwestern area predominantly comprises agricultural land and settlements, whereas forests dominate the northern to southeastern regions. Bharatpur is also known as the medical city of Nepal and has emerged as a key commercial center for the Chitwan district and the central region of Nepal. Owing to abundant opportunities and facilities, the population of the municipality has witnessed notable growth in recent years.
Figure 2 exhibits the obvious map of types of land use & cover, which is created by using the same Landsat 8 images in the ArcGIS processed through the WGS 1984 geographic coordinated system and UTM zone $45\mathrm{N}$ projected coordinated system. The land use & land cover map demonstrates significant agricultural land occupying the southwestern region, while forests dominate the southeastern to northern areas. The midwestern section consists of urban or developed areas, with water bodies scattered throughout, including two rivers in the west and south, as well as small lakes and ponds within the municipality.
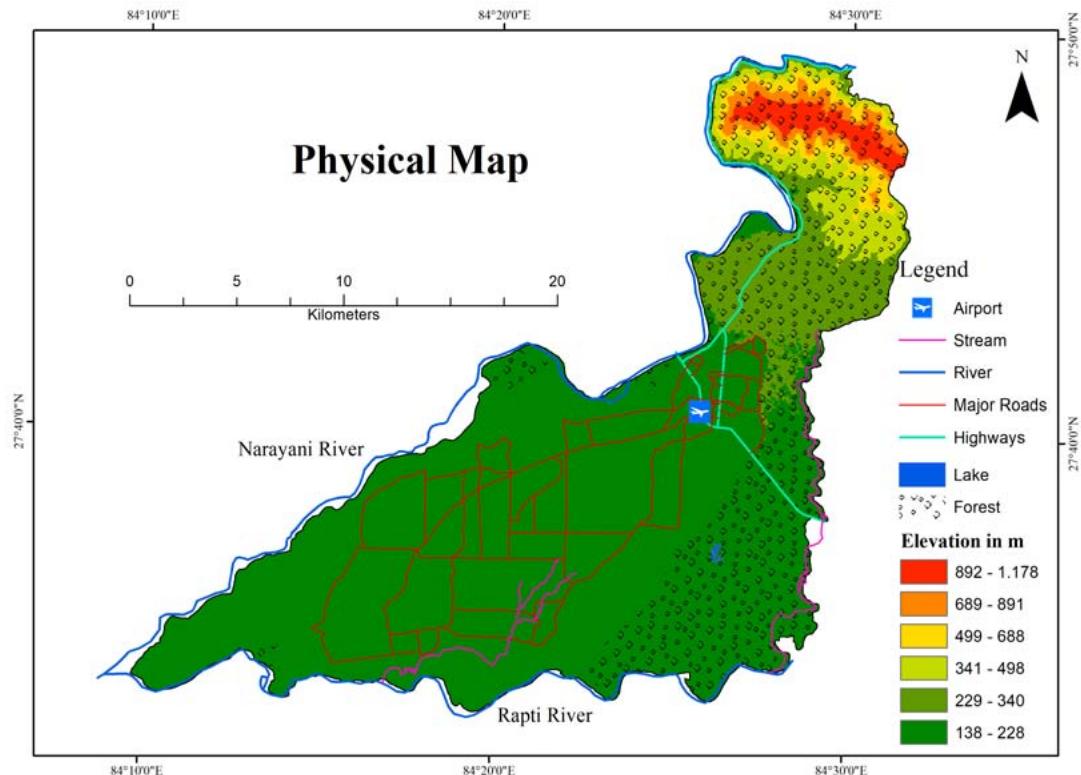 Figure 1: Study area map
Source: Ministry of Federal Affairs and General Administration, Government of Nepal.
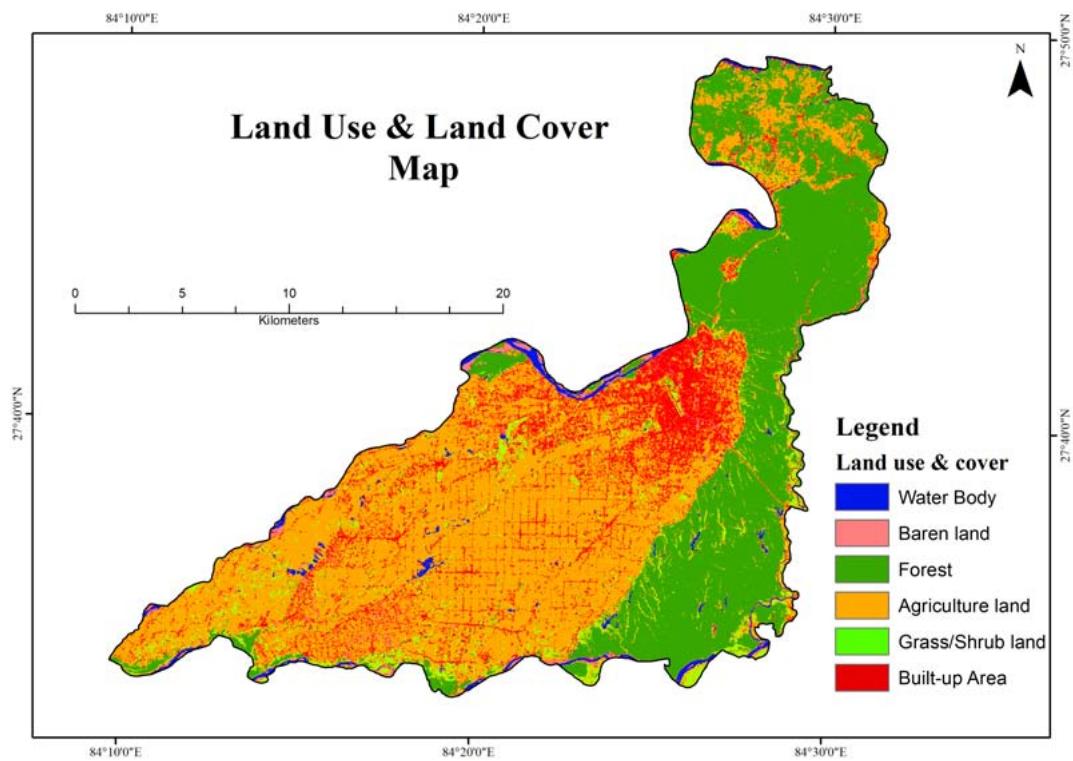 Figure 2: Land use & Land Cover Map of the Bharatpur Municipality.
## III. MATERIAL AND METHODS
### a) Data Used
The Landsat 8 OLI/TIRS C1 level-1 image with a 30-meter resolution was obtained from the official website of the United States Geological Survey (earthexplorer.usgs.gov), with an acquisition date recorded in October 2021. The downloaded image is used to create the LST and SMI maps with the help of some empirical formulas. Landsat image is processed through ArcGIS software under the worldwide accepted geo-referenced system, World Geodetic System (WGS 1984) and Projected Coordinate System, Universal Transverse Mercator (UTM) 45 N by using four bands of Landsat 8 images level 1(band4, band5, band 10, and band11), and different empirical formulas shown below. The value of LST and SMI must be different in the other seasons because the study area has various climates and temperatures throughout the year. However, it can be useful to represent the land surface temperature and soil moisture index of a particular place at a specific time.
### b) Software Used
- ArcGIS 10.8
- LaTeX
### c) Flow Chart
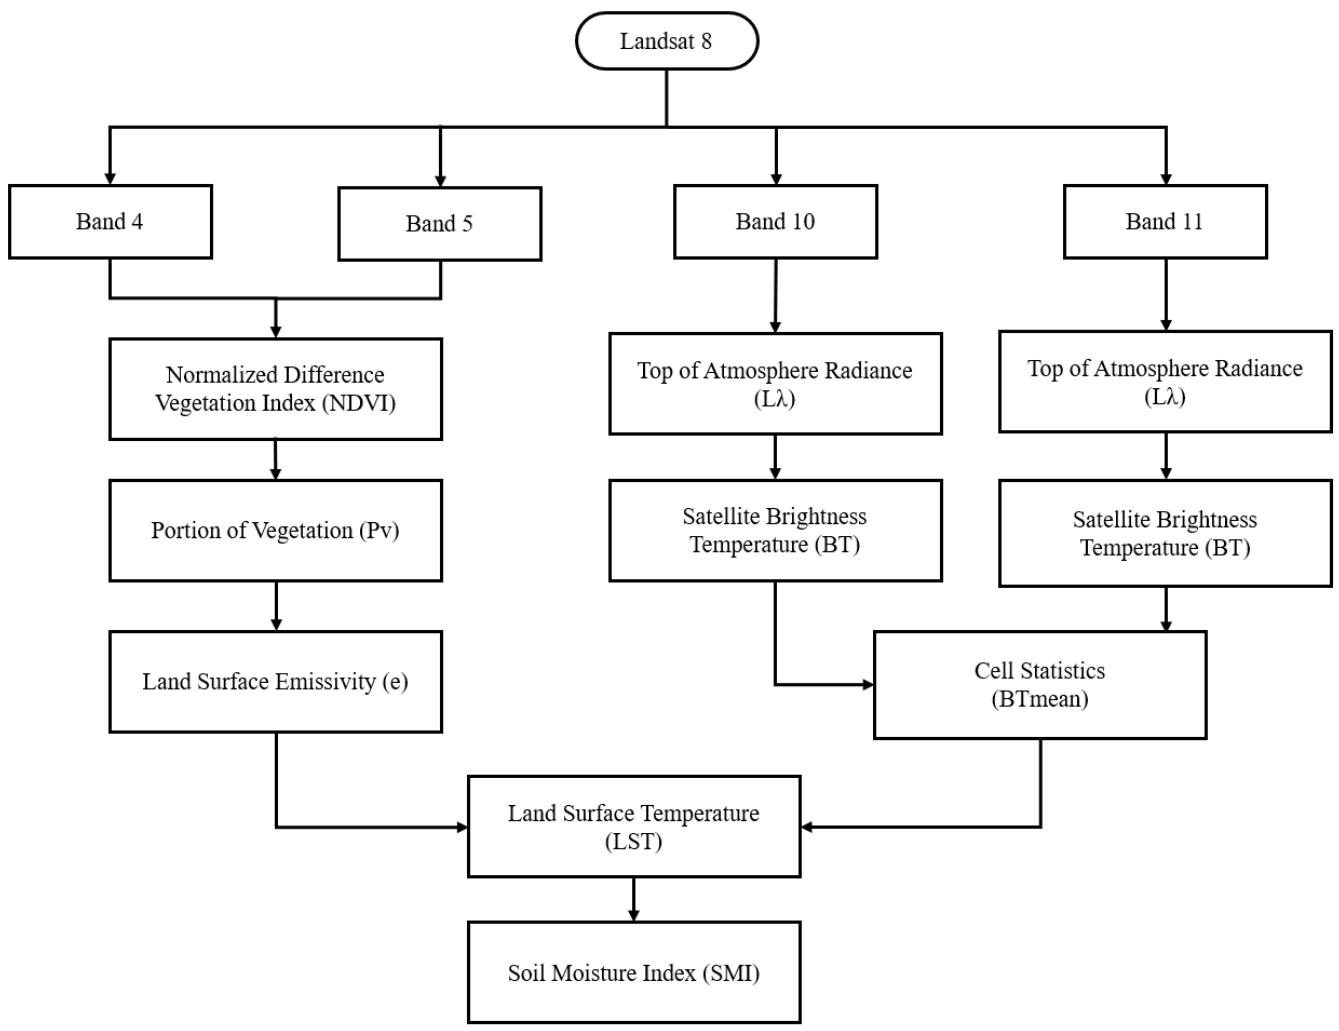 Figure 3: Flow Chart of Land Surface Temperature and Soil Moisture Index Evaluation.
### d) Calculation Process
i. Normalized Difference Vegetation Index (NDVI) The Normalized Difference Vegetation Index (NDVI) serves as an indicator to assess the extent of vegetation coverage within the study area. The index gives a value between -1 and 1 indicating the density of vegetation cover. Entezari et al., (2019) state that NDVI value 1 indicates extensive vegetation, a value close to 0 represents sparse or non-vegetated areas, whereas anything less than zero denotes water and clouds.
NDVI = (NIR - Red) / (NIR + Red) [Anandababu et al. (2018), Sahana et al. (2016), Entezari et al. (2019)] NIR (band5) = DN values from Near Infrared Band
Red (band4) = DN values from Red Band
$$
NDVI = (band5 - band4) / (band5 + band4)
$$
## ii. Top of Atmosphere Radiance $(L_{\lambda})$
Remote sensing tools directly measure radiance. Radiance includes radiation reflected from the surface, as well as radiation bouncing in from nearby pixels and radiation reflected from clouds. Top of atmosphere radiance is calculated by using thermal bands, which are band 10 and band 11 respectively. The formula for top-of atmosphere radiance is obtained from (Mission, L., n.d)
$$
L _ {A} = M _ {L} * Q _ {i} \text{(cal)} + A _ {L} [ \text{A n and ababuetal . (2 0 1 8) , USGS (Mission , L . , n . d)} ]
$$
where,
$$
L _ {\lambda} = \text{TOASpectralRadiance} (W a t t s / \left(m ^ {2} * s r a d * \mu m\right))
$$
$$
M _ {L} = \text{RadianceMultiplicativeB and (N o .)}
$$
For band $10 = 3.3420\mathrm{E} - 04 = 0.0003342$ (value taken from Metadata file)
$$
For band 11 = 3.3420E-04 = 0.0003342 (value taken from Metadata file)
$$
$Q_{i}cal$ = Quantized and Calibrated Standard Product pixel value (DN)
$A_{L} =$ Radiance Add Band (No.)
For band $10 = 0.00001$ (value taken from Metadata file)
$$
For band 11 = 0.00001 (value taken from Metadata file)
$$
## iii. Satellite Brightness Temperature (BT)
Satellite Brightness Temperature (BT) is calculated by using thermal bands, which are band 10 and band 11 respectively.
BT = K2/ln((k1/La) + 1) - 272.15 [Avdan and Jovanovska (2016), Tajudin et al. (2021)](converting kelvin to degree Celsius) where,
BT = Top of atmosphere brightness temperature in degrees Celsius
$$
L _ {\lambda} = T O A \text{SpectralRadiance} (W a t t s / \left(m ^ {2} * s r a d * \mu m\right))
$$
$$
K _ {1} = \text{Constantb and (N 0 .)}
$$
$$
K _ {2} = \text{Constantb and (N 0 .)}
$$
For Landsat 8,
Band 10, $K_{1} = 774.89$ & $K_{2} = 1321.08$ (value taken from metadata file)
Band 11, $K_{1} = 480.89$ & $K_{2} = 1201.14$ (value taken from metadata file)
## iv. Cell statistics
Calculate the mean brightness temperature for the study area by using the brightness temperature of both bands 10 and 11.
## v. Portion of Vegetation (Pv)
$\mathrm{Pv} = ((\mathrm{NDVI} - \mathrm{NDVlmin}) / (\mathrm{NDVImax} - \mathrm{NDVImin}))^{2}[\mathrm{Anandababu}$ et al. (2018), Tajudin et al. (2021)] NDVI $=$ DN values from NDVI images
NDVImax = Maximum DN values from NDVI images
NDVImin = Minimum DN values from NDVI images
## vi. Land Surface Emissivity (LSE)
It is an average emissivity of an element of the earth's surface, calculated from NDVI values. $e = 0.004^{\star}$ Pv + 0.986 (correction value for Landsat image, Cv) [Anandababu et al. (2018), Tajudin et al. (2021)]
## vii. Land Surface Temperature (e)
$LST = BTmean / (1 + (\lambda *BTmean / \rho) * In(e))$ [Entezari et al. (2019), Rajendran and Mani (2015)] $\lambda = Wavelength$ of emitted radiance $= 10.895\mu m k$
$$
\rho = h * c / \sigma = 1.4388 * 10^{2} M k = 14388 \mu k
$$
$$
\sigma = \text{Boltzmannconstant} (1.3 8 * 1 0 ^ {- 2 3} J / K)
$$
$$
h = \text{Planck's} constant\(6.626 * 10^{-34} \text{Js})
$$
$$
c = \text{Velocity} (2.9 9 8 * 1 0 ^ {8} m / s)
$$
## viii. Soil Moisture Index (SMI)
$$
SMI = (LSTmax - LST) / (LSTmax - LSTmin) [Tajudin et al. (2021)]
$$
LSTmax = Maximum surface temperature for given NDVI
LSTmin = Minimum surface temperature for given NDVI To begin with the land surface temperature and soil moisture index assessment in the Bharatpur municipality, the Landsat 8 image was obtained from the official website of the United States Geological Survey, earthex plorer.usgs.gov. The file consists of 11 bands of Landsat and metadata file in mtl format. Among them, we need only band 4, band 5, and thermal bands 10 & 11 for GIS processing and some values from the metadata file. GIS processing includes various mathematical computations performed using the raster calculator tool. This tool is typically located within an Arc
toolbox, under Spatial Analyst tools, within the Map Algebra section.
Normalized Difference Vegetation Index (NDVI) is calculated by using band 4 and band 5 from the Landsat image. Band 4 corresponds red light spectrum (visible red) also called the red band, which is absorbed by chlorophyll in vegetation. On the other hand, band 5 corresponds to near-infrared light (NIR), which is reflected by vegetation. The vegetation cover is calculated by using the empirical formula given above (Section 3.4, i).
Top of Atmosphere Radiance $(L_{\lambda})$ and Satellite Brightness Temperature (BT) are calculated for both thermal bands 10 and 11 respectively. The values of $M_{L}, A_{L}, K_{1},$ and $K_{2}$ are taken from the metadata file to identify both $(L_{\lambda})$ and BT, where $Q(\mathrm{cal})$ is the standard product pixel value of both bands 10 and 11 respectively. As shown in the flow chart, a mean value of brightness temperature is calculated from both bands. Mean brightness temperature is used to calculate the Land Surface Temperature (LST) for more accuracy.
Both Portion of Vegetation (Pv) and Land Surface Emissivity (e) are calculated correspondingly from NDVI values. Both land surface emissivity (e) and mean brightness temperature (BTmean) with other standard values such as the wavelength of emitted radiance, Boltzmann constant, Planck's constant, and velocity of light are used to identify land surface temperature. The empirical formulas for Land Surface Temperature and Soil Moisture Index are previously stated in the calculation process section.
After applying the given formulas and processing the Landsat 8 image through GIS software using the raster calculator tool, the study area's final maps depicting land surface temperature and soil moisture index were generated. These maps were then presented, analyzed, and discussed in detail in the results section.
## IV. RESULTS
### a) Normalized Difference Vegetation Index (NDVI)
The Normalized Difference Vegetation Index (NDVI) serves as an indicator of vegetation presence. Landsat image bands 4 and 5 are employed to calculate this index. The result shows the presence of water bodies, null vegetation, and partially dense vegetation in the study area. Figure 4 shows the vegetation cover in the study area where a large part is dominated by a green color indicating dense vegetation including forests, cultivated fields, and nurseries. Notably, this dense vegetation is particularly prominent in the eastern region and has $74\%$ of the total area. The yellow-shaded area indicates the area has partial to negligible vegetation cover, which consists of $23\%$ of the total study area and typically represents bare land and urban area as referenced in Figure 2. Additionally, the red spot area typically lacks vegetation, indicating water bodies including rivers and lakes, accounting for $3\%$ of the total area as referenced in Figure 2.
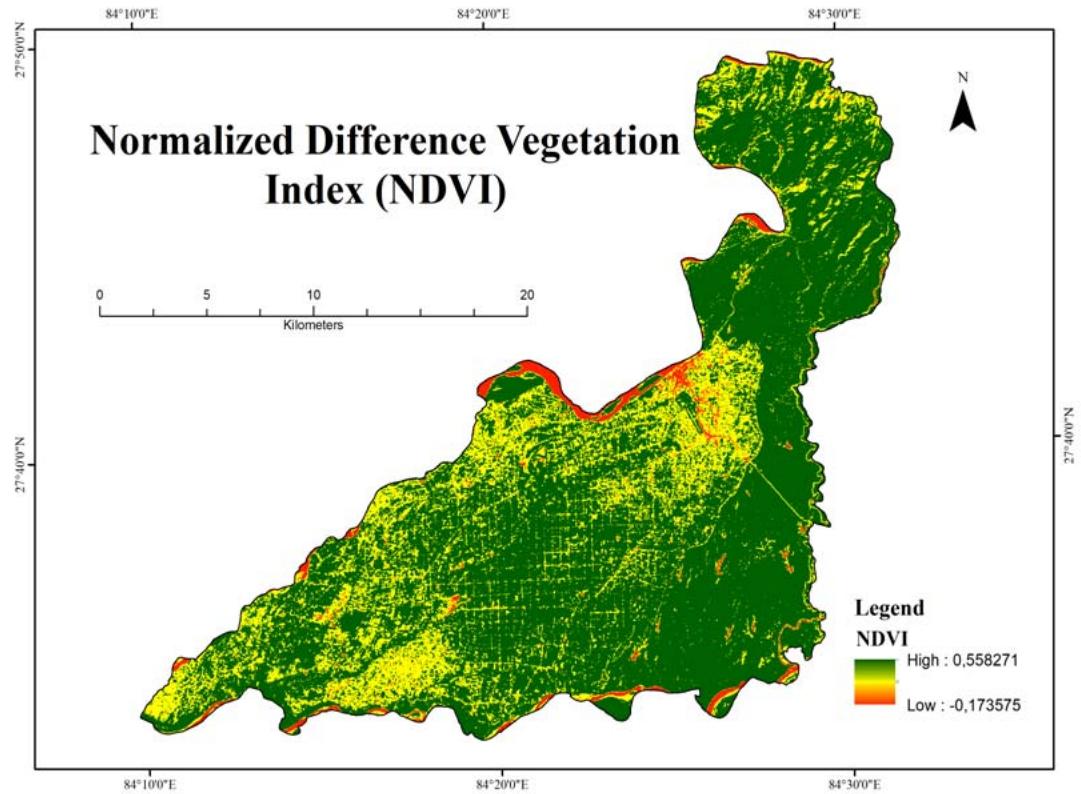 Figure 4: Normalized Difference Vegetation Index (NDVI) Map for October 2021.
### b) Land Surface Temperature (LST)
The land surface temperature and soil moisture index range has been determined in the study area following GIS analysis. Figure 5 illustrates the land surface temperature variation in the Bharatpur municipality in October 2021. High land surface temperatures were observed in densely inhabited lowland areas, while low surface temperatures were found in high-altitude areas in the north and underwater regions as referenced in Figure 1 and Figure 2 respectively. The map of the land surface temperature groupings is presented in Table 1 for a better
understanding of the places, which could be useful for the selection of crops for farming, fish farming, and land use planning. The larger part of the area has temperatures between $25^{\circ} \mathrm{C}$ and $28^{\circ} \mathrm{C}$, constituting approximately $56\%$, followed by temperatures between
$23^{\circ} \mathrm{C}$ and $25^{\circ} \mathrm{C}$, accounting for about $32\%$. To overview the above results, it can be concluded that the study area exhibits an average temperature of land is approximately $25^{\circ} \mathrm{C}$.
Table 1: Land Surface Temperature Classes with Area in Square Kilometers.
<table><tr><td>S.No.</td><td>LST Classes in °C</td><td>Area (km2)</td><td>Area (%)</td></tr><tr><td>1</td><td>30.00 – 33.71</td><td>0.92</td><td>0.21</td></tr><tr><td>2</td><td>28.00 – 30.00</td><td>33.28</td><td>7.67</td></tr><tr><td>3</td><td>25.00 – 28.00</td><td>240.38</td><td>55.38</td></tr><tr><td>4</td><td>23.00 – 25.00</td><td>137.84</td><td>31.76</td></tr><tr><td>5</td><td>20.67 – 23.00</td><td>21.56</td><td>4.98</td></tr></table>
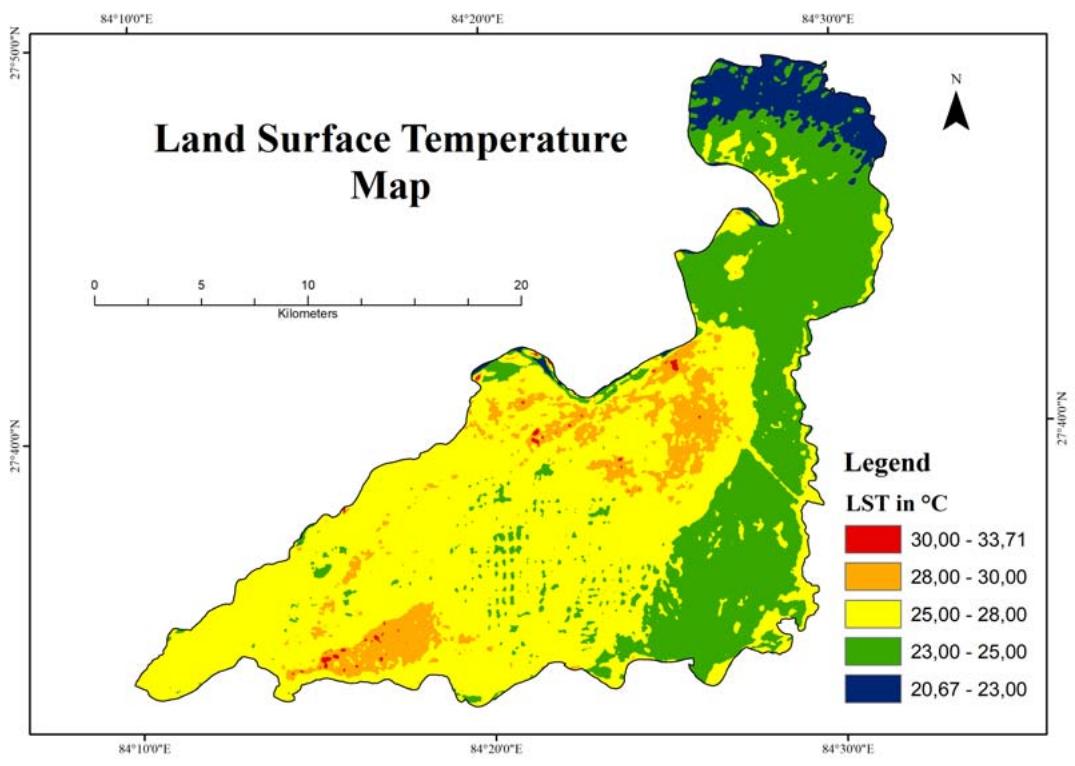 Figure 5: Land Surface Temperature Map of Bharatpur Municipality.
### c) Soil Moisture Index (SMI)
The soil moisture index map shown in Figure 6 demonstrates that areas with higher altitudes and water bodies surrounded by forests have greater soil moisture levels as referenced in Figure 1 and Figure 2 respectively. Additionally, regions with dense forest cover on low-lying terrain have good moisture conditions aligning with observations from Figures 1 and 2 respectively. Conversely, low-lying regions characterized by built-up areas have a lower moisture content as referenced in Figure 2. In total, more than $50\%$ of an area has more than $50\%$ moisture content in the soil, which depicts a large part of an area has a wet condition and a few areas have a dry to slightly moist condition. However, the analysis was done just before winter and after the monsoon season (October). So, there will be a high chance of decreasing moisture content in the spring and summer seasons. The range of soil moisture index from very low to very high and their area are shown in Table 2, respectively. The result shows that most of the area has an SMI value of $40\%$ to $80\%$. The division of soil moisture index $0\%$ to $100\%$ is useful for land use practice because it plays a crucial role in supporting plant growth, maintaining the fertility of the soil by providing water for irrigation, and groundwater recharge.
Table 2: Soil Moisture Index Classes with Area in Square Kilometers.
<table><tr><td>S.No.</td><td>SMI Classes in Range</td><td>Area (km2)</td><td>Area (%)</td></tr><tr><td>1</td><td>0.8 – 1.0</td><td>25.05</td><td>5.77</td></tr><tr><td>2</td><td>0.6 – 0.8</td><td>255.25</td><td>58.82</td></tr><tr><td>3</td><td>0.4 – 0.6</td><td>136.1</td><td>31.36</td></tr><tr><td>4</td><td>0.2 – 0.4</td><td>17.47</td><td>4.02</td></tr><tr><td>5</td><td>0.0 – 0.2</td><td>0.11</td><td>0.03</td></tr></table>
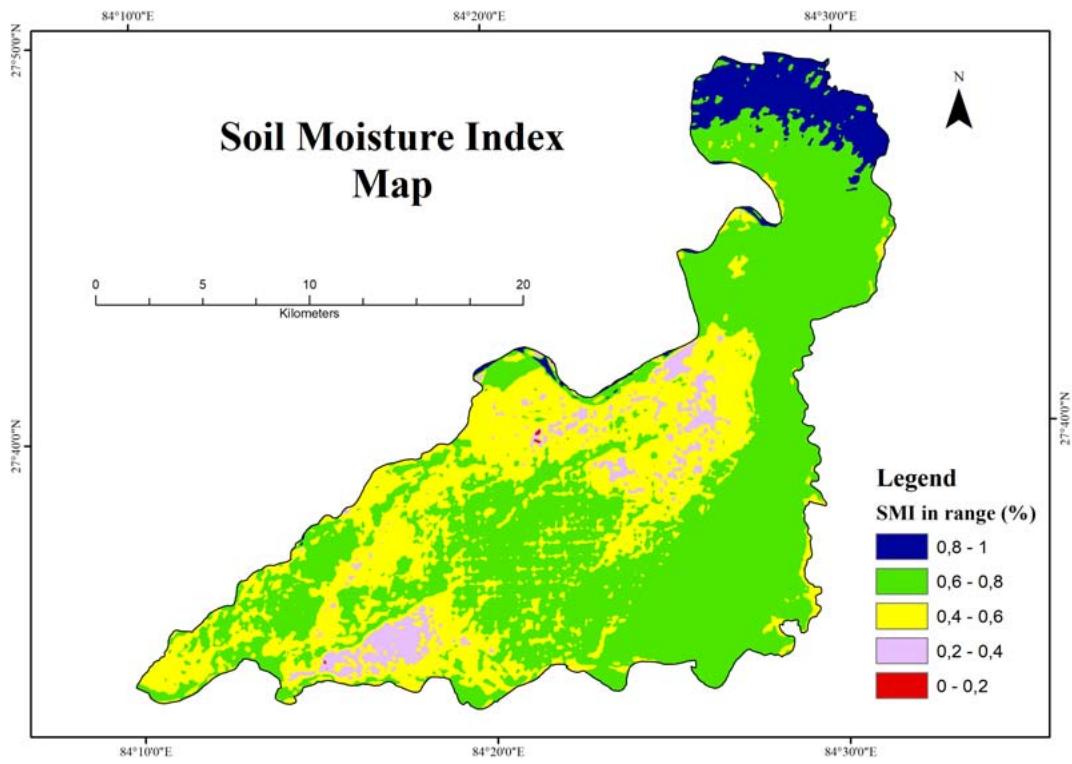 Figure 6: Soil Moisture Index Map of Bharatpur Municipality.
## V. CONCLUSION
The estimation of land surface temperature and soil moisture index using remote sensing and GIS techniques has successfully identified the variation of these two climatic factors over the study area. The result shows variations in the land surface temperature across the municipality from $20.6^{\circ}\mathrm{C}$ to $34.7^{\circ}\mathrm{C}$. At the same time, the soil moisture index indicates some parts of the study area are waterlogged and some areas have water drought. The results indicate the inverse relation between land surface temperature and soil moisture index, where a higher land surface temperature area has a low soil moisture index and low land surface temperature has a high soil moisture index. However, the relation between these could be reversed in different locations, particularly in high altitude areas, where high land surface temperature facilitates the snow melt, leading to increased soil moisture despite the high temperature. The obvious picture of these two environmental facilitates environmental monitoring including heat distribution and moisture conditions over the study area and integrating them enables a drought monitoring system by identifying locations with high temperatures and low soil moisture levels. In addition, a combined analysis of these two environmental factors
helps to identify the heat-prone, water scarcity, and waterlogged areas, which enables a guide to make decisions regarding town planning, agriculture planning, crop selection, and irrigation scheduling across the area.
The outcome results derived from this technique demonstrated that this model can estimate the variation of both land surface temperature and soil moisture in the shortest time and with acceptable accuracy over a large geographical area. Landsat 8 OLI/TIRS C1 level 1 is used to determine the thermal and environmental characteristics of the land surface environment. The distribution of Land Surface Temperature (LST) and Soil Moisture Index (SMI) across the study area was determined through a comprehensive process including normalized difference vegetation index, satellite brightness temperature, the portion of vegetation, and land surface emissivity. The findings of this investigation illustrate how the technique achieves a higher degree of precision when evaluating land surface characteristics.
In a nutshell, this study demonstrates the effectiveness of remote sensing and geographic information system tools in understanding ground surface environmental dynamics. These modern methods not only allow for greater depth of knowledge, but also significantly reduce the time, cost, and manpower for environmental assessments.
### ACKNOWLEDGEMENTS
I am grateful to the second author Mr. Dipesh Dahal for his invaluable contributions to this research. I (Ramji Kshetri), the first author, would like to express deep gratitude to my parents for their unwavering love, faith, and role as the most powerful motivators.
Author Contribution: The authors have the original idea for the paper and took overall responsibility for the study, including data collection and analysis, preparation of figures, and finalization of the manuscript.
Conflict of Interest: The authors declare that there is no conflict of interest regarding the publication of this paper.
Data Availability: The data supporting this study's findings are available from the USGS/NASA.
Generating HTML Viewer...
References
11 Cites in Article
D Anandababu,B Purushothaman,B Suresh (2018). Estimation of land surface temperature using Landsat 8 data.
Ugur Avdan,Gordana Jovanovska (2016). Algorithm for Automated Mapping of Land Surface Temperature Using LANDSAT 8 Satellite Data.
M Entezari,A Esmaeily,S Niazmardi (2019). ESTIMATION OF SOIL MOISTURE AND EARTH’S SURFACE TEMPERATURE USING LANDSAT-8 SATELLITE DATA.
Bolun Li,Chaopu Ti,Yongqiang Zhao,Xiaoyuan Yan (2016). Estimating Soil Moisture with Landsat Data and Its Application in Extracting the Spatial Distribution of Winter Flooded Paddies.
Dol Luitel,Pramod Jha,Mohan Siwakoti,Madan Shrestha,Rangaswamy Munniappan (2020). Climatic Trends in Different Bioclimatic Zones in the Chitwan Annapurna Landscape, Nepal.
R Malla,K Karki (2016). Groundwater environment in Chitwan, Nepal.
(null). Table 2: Characteristics of landsat sensors (https://www.usgs.gov/landsat-missions/landsat-satellite-missions)..
R Pant,T Chalaune,A Dangol,Y Dhital,M Sharma,K Pal,. Thapa,L (2021). Hydrochemical assessment of the Beeshazar and associated lakes in Central Nepal.
P Rajendran,K Mani (2015). Estimation of spatial variability of land surface temperature using Landsat 8 imagery.
Noraisyah Tajudin,Norsuzila Ya'acob,Darmawaty Mohd Ali,Nor Adnan (2021). Soil moisture index estimation from landsat 8 images for prediction and monitoring landslide occurrences in Ulu Kelang, Selangor, Malaysia.
Mehebub Sahana,Raihan Ahmed,Haroon Sajjad (2016). Analyzing land surface temperature distribution in response to land use/land cover change using split window algorithm and spectral radiance model in Sundarban Biosphere Reserve, India.
No ethics committee approval was required for this article type.
Data Availability
Not applicable for this article.
How to Cite This Article
Ramji Kshetri. 2026. \u201cEstimation of Land Surface Temperature (LST) and Soil Moisture Index (SMI) using Satellite Image: A Case Study in BharatpurMunicipality, Chitwan, Nepal\u201d. Global Journal of Human-Social Science - B: Geography, Environmental Science & Disaster Management GJHSS-B Volume 24 (GJHSS Volume 24 Issue B3).
Explore published articles in an immersive Augmented Reality environment. Our platform converts research papers into interactive 3D books, allowing readers to view and interact with content using AR and VR compatible devices.
Your published article is automatically converted into a realistic 3D book. Flip through pages and read research papers in a more engaging and interactive format.
Our website is actively being updated, and changes may occur frequently. Please clear your browser cache if needed. For feedback or error reporting, please email [email protected]
Thank you for connecting with us. We will respond to you shortly.
Lorem ipsum dolor sit amet, consectetur adipiscing elit. Ut elit tellus, luctus nec ullamcorper mattis, pulvinar dapibus leo.
Estimation of Land Surface Temperature (LST) and Soil Moisture Index (SMI) using Satellite Image: A Case Study in BharatpurMunicipality, Chitwan, Nepal