I. INTRODUCTION
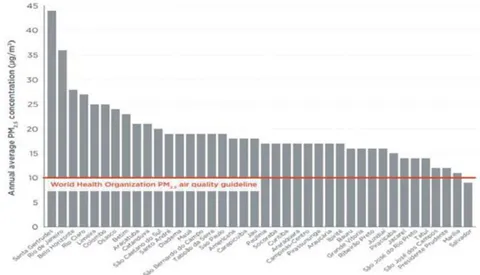
World Health Organization declared in its update (WHO, 2016) that more than of people living in urban areas that monitor air pollution are exposed to elevated levels of particulate matter that exceed the air quality limits. This update on the air quality database registers that only of cities in low and middle-income countries with more than 100,000 inhabitants meet WHO air quality guidelines. In high-income countries, the scenario increases to . Similarly, according to the Irish Environmental Protection Agency, the WHO estimates that more than 400,000 premature deaths are attributable to poor air quality in Europe annually. Locally in Brazil, this matter is not different; the number of deaths is also scary. Figures from the Institute for Health Metrics and Evaluation, 2016, related to 2015, showed that the cause of 52,284 deaths was exposure to particulate matter of fine particles, PM2.5 (Dallmann, 2017). Still, according to (WHO, 2014), the Ambient Air Quality Database reports annual average PM2.5 concentrations in 40 Brazilian cities. It shows that only one city is below the WHO air quality guideline of ; the other 39 cities are exceeded, Figure 1.
Regarding particulate matter produced by flex-fuel vehicles, Salvo et al. (2017) presented a recent paper investigating the effect of ethanol-gasohol fuels usage shifts in ultrafine particle generation (from 6 nm to 100 nm diameter particles). It was found that the shift from gasohol to ethanol reduced the amount of ultrafine concentration by one-third, and the opposite occurred when flex-fuel vehicles shifted from ethanol to gasohol.
Based on all of these facts, the control of PM pollution is crucial for human well-being. The effect of ethanol in flex-fuel vehicles and the injection technology, PFI or DI, are relevant factors in this topic. This paper aims to contribute to this discussion by generating data with current production vehicles.
II. THEORETICAL FOUNDATION
a) Definition & Sources
i. Definitions of Particulate Matter & Amp; Particle Number
It is vital to disambiguate the different meanings that the term particulate matter has been subjected to. Sometimes, the terms Particulate Matter, Particulates, Particles, PM, PN, Smoke and Soot can be treated interchangeably in emissions discussions for general purposes without the rigor of the academic. In contrast, discussions of emissions measurements use a distinction between Smoke, PM and PN.
According to the EPA, Particulate Matter can also be called particle pollution, a mixture of solid particles and liquid droplets in the air. Some are big enough to be seen with the naked eye, such as dust, soot, or smoke, while others are so tiny that they can only be seen on an electronic microscope.
A good explanation is given by EEA when they outline Particulate Matter (PM) as "a collective name for fine solid or liquid particles added to the atmosphere by processes at the earth's surface. Particulate matter includes dust, smoke, soot, pollen and soil particles". Related to Smoke, the same institution defines it as "an aerosol, consisting of visible particles and gases, produced by the incomplete burning of carbon-based materials, such as wood and fossil fuels." As for Soot, they state it as an "impure black carbon with oily compounds obtained from the incomplete combustion of resinous materials, oils, wood, or coal." At last, the EEA definition for Particle Number (PN) is "a variety of measurements characterizing the number of particles in an aerosol sample."
ii. Particulate Matter Sources
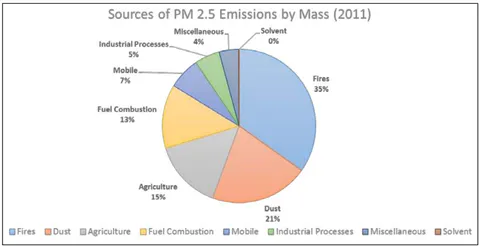
For EPA, particulate matter sources can come from natural or anthropogenic sources. Natural sources, such as salt spray, wildfires, sand, dust, and volcanoes, are generated by nature. It is considered an anthropogenic source of anything caused by humans or their activities, highlighting the products of combustion and agriculture. Figure 2 demonstrates that anthropogenic sources, in 2011, were responsible for of the PM2.5 emissions by mass, while natural sources were responsible for .
Particulate matter is divided into two distinct categories: primary and secondary. Primary particles are directly emitted, and secondary particles form due to atmospheric reactions involving gaseous emissions. Both are regulated, though secondary particles are regulated indirectly.
b) Particulate Matter in Engine Exhaust and Importance i. Composition
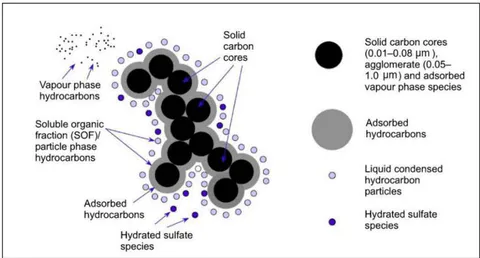
Once diesel fuel is one of the main contributors to particulate matter emissions, its composition is highlighted. According to (Johnson et al., 1994), particle matter diesel emissions are divided into three phases: gas, solid and liquid/vapor. The gas phase emission includes NOx, CO, and sulfur dioxide (SO2). Figure 3 demonstrates the components of the solid and liquid/vapor phases. It shows that solid phase emissions are initially constituted of small (10-80 nm) solid carbon cores - SOL - and agglomerates (50-1,000 nm). The liquid/vapor phase comprises the organic, named SOF - Soluble organic fraction - and hydrocarbon component and sulfate (SO4), which water can remove.
Part of the hydrocarbons are absorbed into the SOL, and part remains as a vapor.
Generally speaking, the whole composition involves some hydrocarbons absorbed in an agglomerate of SOL. The SOF, an organic hydrocarbon solvent, can remove those hydrocarbons.
ii. Characterization
It is noticeable that the European Regulatory Agency evolved from mass-based air pollution regulation for particulate matter to particle number, which is more accurate about the particulate matter's physical properties regarding the effects on human health. Surface area can also be measured as a parameter to be regulated.
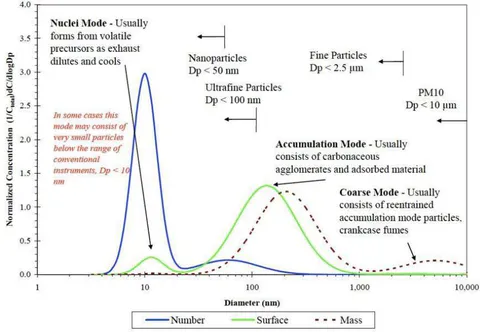
There is an essential correlation between mass, particle number and surface area of the particulate matter that is explained by (Kittelson et al., 2006), which includes the size range defined for the atmospheric particles as PM10 (diameter ), fine particles PM2.5 (diameter ), ultrafine particles PM0.1 (diameter or ), and nanoparticles (diameter or ). A diesel fuel distribution is exposed in Figure 4, and according to the author, distribution from a spark ignition engine would be similar but with relatively less material in the accumulation mode region.
The practical meaning of this demonstration is that the total mass does not correctly reflect the number of small particles that harm human health.
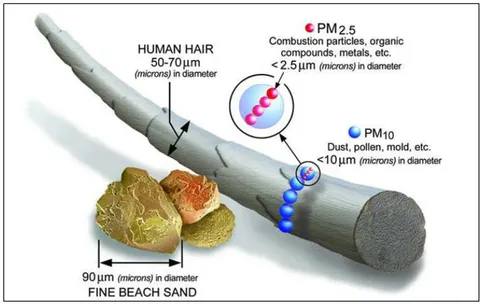
Complementing the explanation related to the size of the particles, EPA provides a helpful description of the size of the particles when compared to human hair. It shows that the average human hair is about 70 m in diameter – making it 30 times larger than the largest fine particle. EPA calls the particle sizes PM10:
inhalable particles, with diameters that are generally 10 m and smaller; PM2.5: fine inhalable particles, with diameters that are generally and smaller; PM0.1, with diameters that are generally and smaller, as seen on Figure 5.
iii. Impact On Health and Climate Change
Several studies about the health of the past decades have pointed out strong evidence that elevated levels of particulate matter air pollution are associated with increased cardiovascular and respiratory diseases (Kayser, 2018). In this matter, small particles from engines are particularly worrisome.
(Tollefson, 2018) stated that soot is a significant contributor to climate change. Similarly, it is defined that soot, also known as black carbon, "is the second most important human emission in terms of its climate forcing in the present-day atmosphere; only carbon dioxide is estimated to have a greater forcing" (Bond et al., 2013). (Bullis, 2013) expound in his article "Cleaning Up Diesel Trucks and Cooking Stoves Could Reduce Climate
Change" that selective reductions of particulate pollution might help the climate change issue.
c) Regulations and Test Cycles
In the U.S. and Europe, and are currently regulated.
i. US Emissions Standards
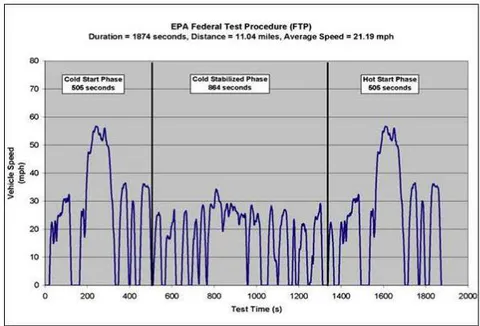
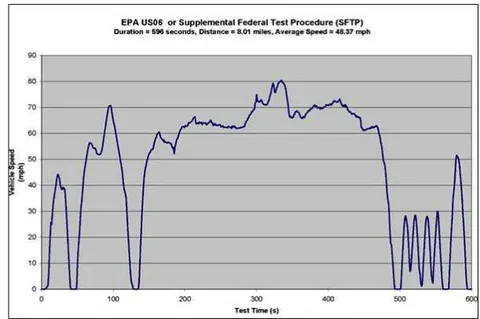
The United States Emissions standards have two bodies regulating emissions – the EPA and CARB. Both regulate particulate matter using a mass limit. EPA established Tier III 3mg/mi on the FTP driving cycle in 2017, while CARB took LEV III 3mg/mi in 2017, 1mg/mi (begin phase-in 2025), also on the FTP driving cycle—Figure 6.
European Emission Standards
The European Union implemented a Particle Number limit in addition to the mass standard. Starting with Euro5b, Diesel vehicles were limited to 6x10¹¹ particles/km. For Direct Injection Gasoline engines, Euro 6, in 2014, initially met a limit of 6x10¹² particles/km; in 2017, Euro 6c met the full standard of 6x10¹¹ particles/km. The particle number standard must be met
in addition to the 5mg/km particle mass standard. The NEDC driving cycle was replaced in 2017 by WLTP, and the RDE on-road cycle was included as a supplemental test to verify real-world compliance with emissions limits. Particulate measurement protocol - PMP - was established to carefully define the sampling and measurement conditions to obtain repeatable measurements. In order to achieve repeatable measurements, only solid particles are counted, volatile particles are removed by using an evaporation tube or thermodenuder, and, to further ensure volatile particles are not counted, only particles between 23 nm and 1,000 nm are counted.
d) Formation in Engines
The formation of the soot happens during the combustion of hydrocarbons. However, most of it will be oxidized in the presence of oxygen (stoich or lean) and sufficient temperature. In rich flames, there is insufficient oxygen to oxidize all of the soot – that which remains is emitted.
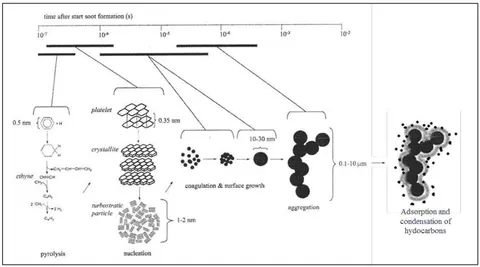
(Smith, 1981) explains that the formation mechanism of the soot particles in diesel engines follows a sequence that starts with pyrolysis, the decomposition of the molecules brought about by high combustion temperatures. As a result, the platelets are formed and then become microscopic crystals, also known as crystallite. All the crystallites together transform into turbostratic particles. After that, there is the coagulation phase and the surface growth. The grown particles, later on, form an aggregation. As mentioned in Figure 3, there is the absorption and condensation of hydrocarbons. The increasing size of the particles along the mechanism of their formation is also shown in Figure 7. They start at as platelets and end from to at the aggregation of the grown surface particles.
Generally speaking, in internal combustion engines, soot forms due to reactions in localized fuel-rich regions. While the mechanisms differ, this is true for both Diesel and Gasoline engines. In Diesel engines, soot forms on the fuel-side of the diffusion flame.
In Gasoline engines, the fuel-rich regions may be split into two categories: liquid fuel in-cylinder, in which either aerosol droplets or surface films (or pools) of fuel result from poor fuel spray characteristics, and pockets of the fuel-rich mixture, that is, a result of poor mixing.
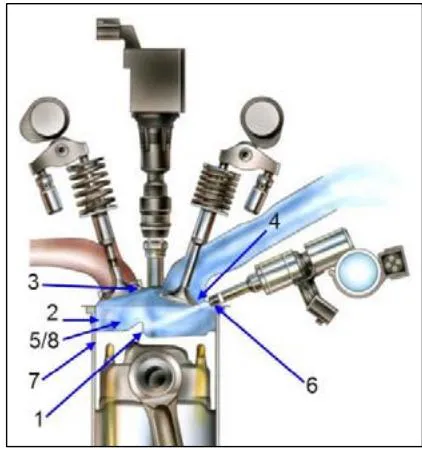
(Ketterer, 2016) describes that in DI engines, the sources of PM formation are directly related to the combustion chamber surfaces. The following characteristics impact its influence: (1) piston crown (poorly chosen injection timing); (2) bore liner (excessive penetration may be due to poorly chosen injection timing, spray pattern, insufficient or mismatched charge motion); (3) combustion chamber roof (direct - poor spray pattern, indirect - may splash off of the piston);
e) Factor Influencing Soot Formation
As already described, the soot formation is influenced by several parameters such as temperature, air-fuel ratio, chamber pressure, fuel composition, residence time and addition of additives.
Experimental studies from (Boing et al., 1990) and (Pires da Cruz 2010) have shown that soot formation increases with combustion temperature in the region below since the pyrolysis and crystallite rate production depends mainly on temperature, which contributes to aggregation growth and finally to form the structure of the adsorption and condensation of hydrocarbons. In the high-temperature region around
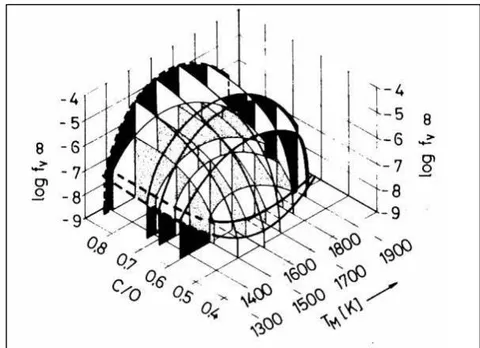
1500 to 1700 K, where the oxidation process is dominant, the soot formation is significantly reduced, Figure 9. Many experimental investigations confirm that temperature is the dominant influence parameter on soot formation, even at elevated pressure levels.
Another parameter that strongly impacts the soot formation is the air-fuel ratio. Generally, the soot mass and particle diameter increase with the equivalence ratio (EQR), as shown in Figure 9, with the combined effect of temperature and air-fuel ratio (as the C/O ratio). A critical C/O ratio below which no soot is formed can be observed.
The type of fuel and its composition is another critical parameter. As the aggregation process results from the fuel's thermal composition, its chemical structure strongly impacts the kind and quantity of products. The soot formation increases with the hydrocarbon chain size. Polyaromatics and aromatics chains produce more aggregation than alkenes (Boing, 1990). In this way, E100 fuel has chemically less tendency to soot formation than E22 fuel since its chemical structure is small (C2H6O) and without aromatic molecules (E22 fuel contains 15 to in volume of aromatic chain).
As a result of this efficiency in soot formation, some recent studies have shown the environmental and social benefits of E100 fuel. (Salvo et al., 2017) reported that the ultrafine particle (7-100 nm diameter) falls by one-third during the morning commute when a higher gasoline price induces 2 million drivers in the real-world megacity of São Paulo to refuel their vehicles with E100 fuel instead of E22 fuel. The opposite trend was measured for fueling shifts from E100 to E22, figure 10.
In addition, (Pires da Cruz, 2010) relates that additives can also change soot formation. He also explains that when inert additives like H2O, CO2 or SO2 are added to the fuel (from dilution via internal or external gas recirculation), the profiles of species concentration and temperature change, decreasing the
shooting tendency and overriding the temperature effect. His studies showed that adding water is an efficient way to reduce the soot formation.
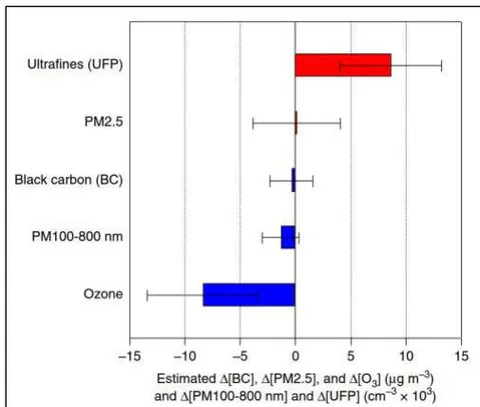
points (Salvo et al., 2017).
f) Mitigation
One way to mitigate particulate matter is by reducing engine-out emissions. Design and calibration efforts can be aimed at reducing the amount of particulate matter entering the exhaust stream. Related to exhaust aftertreatment, devices in the exhaust stream are necessary to capture or oxidize the particles after they have entered the exhaust stream. Unfortunately, it is ineffective because it is tightly dependable on engine-out reductions. Generally, it has more significant impacts on vehicle performance and or fuel consumption and requires the use of particulate filters. (Whitaker, 2011) provides an example of the efforts that come from improvements obtained on engine hardware combined with improvements made on engine calibration to reduce the PN emissions on a Gasoline DI engine at NEDC driving cycle, is shown in Figure 11. These improvements together achieved a reduction in PN emissions at the NEDC driving cycle. This study's results demonstrated that most particulates are created during the cold start and at transient accelerations during cold engine operation. The contribution of each work package used for the considerable reduction of particulate emissions are as follows: cold start ; catalyst heating ; transients during cold engine operation ; steady state and transient operation of a hot engine . Details of the PN formation mechanisms, calibration actions and influencing hardware related to each work package are shown in Figure 12.
Work Package\nMechanism Of PN Formation\nCalibration Actions\nInfluencing Hardware\nCold Start\nInsufficient mixture preparation\nDroplet accuement\nWall wetting\nHigh pressure start\nMultiple injection\nOptimized injection\nsettings\nPiston geometry\nInjector\nHigh pressure pump\nFuel rail volume\nCombustion chamber\ngemetry\nFast synch cam wheel\nCatalyst Heating\nInsufficient mixture preparation\nIncorrect injection timing\nWall wetting\nStratification effects\nPN optimized injection\nstrategy\nMultiple injection\nRail pressure\nCamshaft position\nIgnition timing\nPiston geometry\nInjector\nHigh pressure pump\nCombustion chamber\ngemetry\nCamshaft\nCold Transient\nInsufficient mixture preparation\nIncorrect injection timing\nWall wetting\nStratification effects\nToo rich air/fuel ratio\nDynamic calibration of\n injection settings\nMultiple injection\nRail pressure\nCamshaft position\nIgnition timing\nPiston geometry\nInjector\nHigh pressure pump\nCombustion chamber\ngemetry\nCamshaft\nWarm Transient & Steady State\nInsufficient mixture preparation\nIncorrect injection timing\nWall wetting\nStratification effects\nToo rich air/fuel ratio\nSteady state injection\nstrategy\nMultiple injection\nRail pressure\nPiston geometry\nInjector\nHigh pressure pump\nCombustion chamber\ngemetry\nSwitchable water pump
| Work Package | Mechanism Of PN Formation | Calibration Actions | Influencing Hardware |
| Cold Start | Insufficient mixture preparation Droplet accuement Wall wetting | High pressure start Multiple injection Optimized injection settings | Piston geometry Injector High pressure pump Fuel rail volume Combustion chamber gemetry Fast synch cam wheel |
| Catalyst Heating | Insufficient mixture preparation Incorrect injection timing Wall wetting Stratification effects | PN optimized injection strategy Multiple injection Rail pressure Camshaft position Ignition timing | Piston geometry Injector High pressure pump Combustion chamber gemetry Camshaft |
| Cold Transient | Insufficient mixture preparation Incorrect injection timing Wall wetting Stratification effects Too rich air/fuel ratio | Dynamic calibration of injection settings Multiple injection Rail pressure Camshaft position Ignition timing | Piston geometry Injector High pressure pump Combustion chamber gemetry Camshaft |
| Warm Transient & Steady State | Insufficient mixture preparation Incorrect injection timing Wall wetting Stratification effects Too rich air/fuel ratio | Steady state injection strategy Multiple injection Rail pressure | Piston geometry Injector High pressure pump Combustion chamber gemetry Switchable water pump |
III. METHODOLOGY
Once exposed to the mechanisms and characteristics of particulate matter and its importance and relation with human health and climate change, developed countries adopted regulations for careful PN control. Considering PN is generated in all engine technologies, and with the use of all fuels, it is inevitable that discussions about PN emissions for passengers' vehicles in Brazil will eventually consider Flex-Fuel engines of all injection technologies that run with E100 and E22 and any blend that comes from that. To provide reference data to help the initial discussions, a group of tests were conducted on four normal production Flex-Fuel vehicles, fueled with E100 and E22, focusing on PN emissions on the Brazilian standard driving cycle NBR6601 (EPA75). Those vehicles belong to two groups of Flex-Fuel engine technologies, DI and PFI.
All measurements were performed on a chassis dynamometer (48-inch roller diameter) at GM Mercosul Emissions Laboratory configured with Particle Number Counter (PNC) model AVL 489, which works with the particle's diameter between to , according to UNECE Regulation 83 (Light Duty Vehicles), Figure 13.
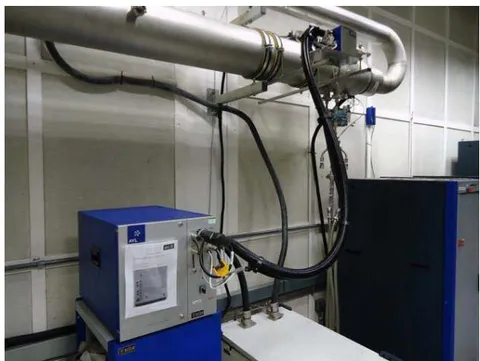
Two sets of DI engines and one PFI engine were used in this study, according to Figure 14.
| Injection Type | Test Vehicle | Test Fuel | Vehicle Category |
| DI #1 Flex | A | E100 | Passenger |
| E22 | |||
| B | E100 | ||
| E22 | |||
| DI #2 Flex | C | E100 | Light Commercial |
| E22 | |||
| PFI Flex | D | E100 | Passenger |
| E22 |
A total of 26 tests were run to generate all test batches and allow the comparison between different injection technologies and fuel blends.
IV. RESULTS
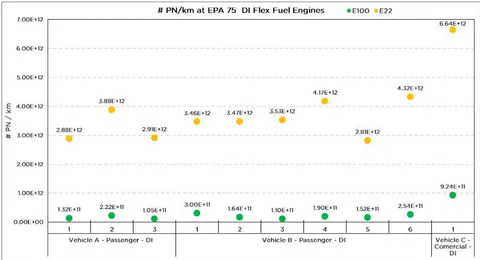
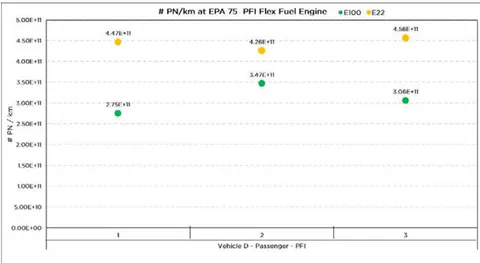
For the measurements with DI engines, two standard production passenger vehicles of the same model were tested, both equipped with the same engine type (vehicle A run 3 test batches and vehicle B run 6 test batches with each fuel) and also one light commercial vehicle with a different DI engine (1 test batch with each fuel), Figure 15. Another passenger vehicle assembled with a PFI engine was tested (1 test batch with each fuel), Figure 16.
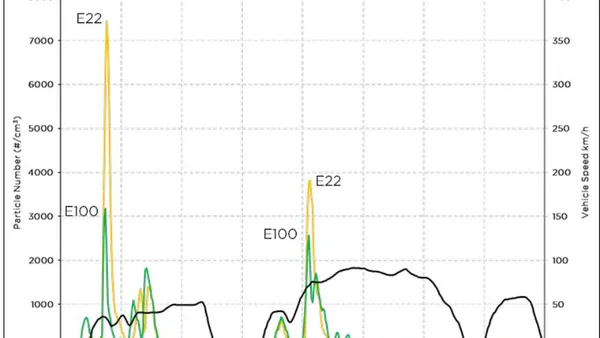
The results showed that PN emissions with E100 fuel are much lower than PN emissions with E22 fuel in all tests. E100 PN emissions with both DI and PFI engines are lower, as seen in Figures 15 and 16.
Most of the PN are generated during cold the PN picks with both E100 and E22 fuels after cold engine operation of the emissions test. Figure 17 shows start and during cold drivability transient accelerations.
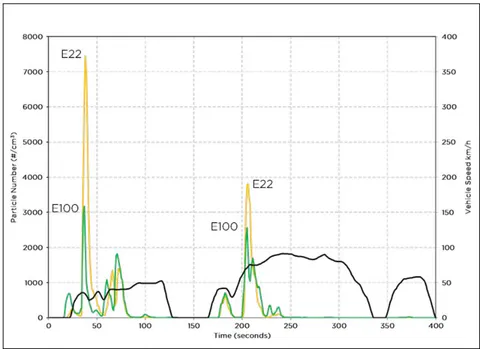
Figure 18 shows the average results with each Flex-Fuel engine technology. DI and PFI show that E100 fuel produces significantly less PN emissions. E100 combustion produces about less PN on both DI engines than E22. On the PFI engine, PN emissions are much lower than seen on DI engines, and E100 performance is even better, generating less than E22.
| Average PN (#/km) | ||||
| Vehicle Category | Injection Type | E100 | E22 | % Difference |
| Passenger | DI #1 Flex | 1.8E+11 | 3.5E+12 | -94.81 |
| Comercial | DI #2 Flex | 9.2E+11 | 6.6E+12 | -86.09 |
| Passenger | PFI Flex | 3.1E+11 | 4.4E+11 | -30.16 |
Figure 18: Final average results with E100 and E22 fuels.
V. CONCLUSIONS
Tests confirmed that DI engines produce higher amounts of particle numbers than PFI engines. However, the E100 particle number in both DI engines is one magnitude lower than the E22 emissions level. It gets closer to the amount of PNs generated by the PFI engine.
Based on the results, E100 is a strategic fuel for reducing and controlling PM pollution. Its application is key to obtaining environmental, social and economic sustainability.