Evaluating the Factors that Contribute to the Shopping through Social Media, using Exploratory factor Analysis and Partial Least Square Structural Equation Modeling – Insights from Tanzania
The purpose of this study is to apply exploratory factor analysis and Partial least square Structural equation to analyze the factors contributing thriving of online shopping through social media in Tanzania. Seven areas of Social and Economic factors, social media behavior factors, Buying and Shopping Behavior, Technology Internet Acceptance factors, Security and Risk assessment factors, Customer care, pre-purchasing, and Post Purchasing service and Cost factors were theoretical conceptualized to construct latent factors. An online questionnaire was used as a data collection tool with 344 participants, and data were analyzed using R software for statistical analysis and Smart PLS software for partial least square modeling. Exploratory factor analysis was used to evaluate variable factor loadings, and variables with more than or equal to 0.3 loadings were used in structural equation modeling.
## I. INTRODUCTION
The investigation of consumer behavior is a topic that has been studied extensively by researchers in order to gain insights into the various factors that affect purchasing decisions. One of the earliest models of consumer decision-making was proposed by Engel, Kollat, and Blackwell in 1968, which outlined a five-stage process that consumers go through when making a purchase. This process includes problem recognition, information search, evaluation of alternatives, purchase decision, and post-purchase evaluation (Engel et al., 1968). In the 1970s, Joseph and Inchbald expanded upon the Engel-Kollat-Blackwell model by incorporating additional stages that emphasized the impact of social and cultural factors on consumer behavior. Their modified model, known as the EKB model, provided a more comprehensive framework for understanding
consumer behavior (Joseph and Inchbald, 1979). Since the development of the EKB model, numerous researchers have built upon it and developed their own models and theories of consumer behavior. These models have incorporated a wide range of factors such as social and cultural influences, psychological factors, and environmental factors to provide a more in-depth understanding of consumer behavior. This continuous evolution of consumer behavior models has contributed to the advancement of marketing strategies and has helped businesses gain insights into the complex nature of consumer decision-making. Several factors, such as the environment and essential survival needs, contribute to an individual's inclination to modify their behavior, and such changes have significant implications for both personal lifestyles and businesses. Despite the internet's existence since the 1960s, it was not accessible to the general public until the early 1990s. With the widespread adoption of the internet, the World Wide Web has emerged as a new medium, revolutionizing various aspects of human life, including daily routines and consumer purchasing behavior. Online shopping is a form of e-commerce that enables consumers to purchase goods or services directly from a vendor through the internet using a web browser.Venkatesh et al (2022) proposed that the concept of online shopping dates back to 1967, although its commercialization and innovation have accelerated due to the widespread use of the internet. This has led to a significant transformation in shopping and purchasing, and has given rise to a new field of research focused on examining consumer behavior in the online context, known as online consumer behavior. Numerous studies have been conducted to explore the various factors that motivate users to engage in online shopping activities. Kuswanto et al. (2020) found that risk, social influence, and joy of shopping are significant factors that influence online shopping. According to Davis et al. (2021), several factors such as variety seeking, advertising, shopping convenience, and trust significantly influence online shopping. Furthermore, researchers have investigated the impact of demographic factors on online shopping behavior, including gender (Kanwal et al., 2022; Sramova and Pavelka, 2019), age (Sorce, Perotti, and Widrick, 2005), and education (Petroman et al., 2015). Despite the various research domains in this field, online buying and selling behavior can be classified into two categories: external and internal factors. Inside factors explain features that exist within the user and influence their behavior due to certain traits. Further research in the field of online consumer behavior has revealed that various attributes such as gender, age, education, and subjective norms significantly influence consumer behavior (Ling and Yazdanifard 2015). The external factors that influence consumer behavior are determined by external stimuli and how they drive consumers to take a specific course of action. This category encompasses technological and social pressures that can motivate consumers to change their decisions. Studies have also explored other areas of online consumer behavior such as impulse buying behavior, hedonic motivation, personality, and emotions (Chuah and Gan 2013). For instance, impulse buying behavior is a key area of interest in online consumer behavior research, with scholars examining how emotions and other factors influence impulse buying. Similarly, research has also explored how hedonic motivation, which is driven by pleasure-seeking, influences online consumer behavior. Studies have also examined the role of personality traits in online consumer behavior, particularly in relation to impulse buying behavior. Overall, the field of online consumer behavior is continually expanding as new factors and variables are explored to provide a more comprehensive understanding of how consumers behave in the online marketplace. In recent years, the impact of social media platforms on consumer behavior has become a subject of significant interest to researchers. Social media has transformed the way people interact with one another, and this has had a profound impact on how individuals and organizations operate. One of the most significant impacts of social media is the way it has changed the relationship between businesses and their customers. Customers are now able to interact with businesses in real-time, and this has led to a new level of engagement between businesses and their customers. Researchers have studied the ways in which social media platforms are being used to create social constructs and shape the future of certain countries (Trusov, Bodapati, and Bucklin 2010). They have also investigated how the use of popular social media platforms is associated with shopping preferences with respect to specific, familiar retail stores, including online and physical channels (Vithayathil, Dadgar, and Osiri 2020). In addition, researchers have studied the impact of social media advertisements on the dynamics of online shopping (Misra, Goyal, and Maurya 2022).
### a) Study Modeling
This study aims to investigate the factors that have contributed to the increasing use of social media as a platform for online shopping in Tanzania, where entrepreneurs have turned to social media in the absence of a large ecommerce platform. The study draws on an old academic debate about the variables that influence behavior change in relation to environmental adaptation, with a focus on how environmental adaptation affects business in both positive and negative ways. Seven categories of factors that may contribute to behavior change are identified in the study. While there has been considerable research on social media and online purchasing, little attention has been paid specifically to social media as a platform for online shopping. Tanzania, as a new emerging market economy in East Africa with an average GDP growth of $5\%$ over the last five years, presents an interesting case for investigating this phenomenon. The number of internet users in Tanzania has been steadily increasing, with 15.15 million users in January 2021 and a $3\%$ growth between 2020 and 2021. Social media users in Tanzania also increased by $20\%$ between 2020 and 2021, with 5.40 million active users in January 2021, accounting for $8.9\%$ of the country's total population. Considering that shopping behavior is influenced by social conventions, cultural viewpoints, and technology adoption, the study seeks to shed light on the behavior transformation occurring in Tanzania as entrepreneurs turn to social media as a shopping platform. The results of this study can inform policy decisions and business strategies in Tanzania and other emerging markets facing similar challenges. While previous research has explored the factors that influence online shopping behavior in general, there is a gap in the literature regarding social media as a platform for online shopping in emerging economies like Tanzania. Therefore, this study aims to fill this gap by investigating the factors that drive the adoption of social media as a shopping platform in Tanzania. The study utilizes a mixed-methods approach, which includes Online surveys with Tanzanian entrepreneurs and consumers who use social media for shopping. The research focuses on seven categories of factors that may influence the adoption of social media as a shopping platform: social norms, trust, convenience, variety, advertising, hedonic motivation, and perceived risk. The results of this study may help Tanzanian entrepreneurs and policymakers to better understand the factors that contribute to the growth of social media as a shopping platform in the country. Additionally, the findings may provide insights into the challenges that need to be addressed to ensure the sustainability of this trend. By understanding the factors that influence consumer behavior, businesses and policymakers can develop strategies to maximize the benefits of social media as a shopping platform and mitigate potential risks.
## II. LITERATURE REVIEW
### a) Social Media Behavior Factors (SMBF)
Previously conducted studies have already established the significance of social media in building personal connections and enabling companies to reach potential customers. In this section, we have grouped together various characteristics that researchers believe signify an interrelationship between online shopping behavior and social media. Social media users actively create, share, and consume content related to products or brands with the intention of educating others about a company's sustainable practices and supply chain (Ngai, Tao, and Moon 2015). The sharing of personal, sustainable product experiences by consumers on social media leads to an increase in perceived word-of-mouth marketing for these products (Buzzetto-More 2013). These features of social media give users the ability to establish trust and security towards a company or brand and create a potential for viral marketing that can inspire many other users (Brown, Broderick, and Lee 2007). Establishing online trust is crucial to understanding the association between social media and behavioral adaptation. Furthermore, promotions and free delivery fees are also seen to encourage online shopping, along with recognition of social media buying behavior (Al Hamli and Sobaih 2023). This category was also designed to investigate online and offline purchasing preferences to determine if there is a relationship between the time spent on social media and shopping through social media.
### b) Social and Economic Factors (SEF)
There is asubstantial economic growth in Tanzania, word bankreport rise of per capita income from below 1000 $\$ 10$ to 1024 $\$ per day$ (Richter 2019). Relationship between purchasing power and economic growth was explained by(Jonsson et al. 2001)in reference to inflation, supporting this theory, (Tariku Kolcha Balango 2020)express the positive growth in purchasing power with relationship in Gross National Product(GPD) growth. purchasing power positive growth with economic, have been challenged by various studies where they find, regardless of economic growth, there is no guarantee in increase in individual growth economically. (Tariku Kolcha Balango 2020) explain there is no clear indication to correlate consumer purchasing power and macroeconomic growth, and (Kouton 2019) argue that, notwithstanding economic growth in sub- Saharan Africa still there is poor pace in povertycontraction.
In prospect of consumer behavior (Ansari 2018) explain that consumer Social Factors, Cultural factors and Social Class play significance influence on shopping behavior. (Al-Azzam 2014), finds there is positive correlation between family, price, quality, color, and purchasing decision. Exploring this category, five variable were included, Age (Hervé and Mullet 2009; Pour Mohammad and Drolet 2019), marital status (Velaudham 2019), education (Petroman et al. 2015), family(Ibáñez, Alonso Dos Santos, and Llanos-Contreras 2022), job and Income(Rehman and Jamil 2016).
### c) Technology Internet Acceptance Factors (TIAF)
This category is adaptation of Technology acceptance model designed by (Davis n.d.) to understand the degree on which users are willing to accept new technology. The TAM was designed to understand the causal relationship between external variables of user acceptance and actual use of technology, seeking to understand the behavior of these users through knowledge of the usefulness and ease of use perceived by them. TAM explains that there is two principal factors that might influence an individual to try new technology which is perceived usefulness[^1] and perceived easy to use[^2]. Adaptability of new technology varies with age and other factors, the older generation tend to be more reluctant to new technology than young age and find using of social media is wasting of time(Li et al. 2022). In context of TAM and Social media, studies discovered that an increase in social media usage develops only when the user learns that social media is informative, implying a good interaction between social media and the user(Rauniar et al. 2014).
### d) Security and Risk Assessment Factors (SRAF)
The concept of risk in decision-making is defined as having prior knowledge about available options and the potential outcomes of choices made, as explained by risk theorists such as Dowling (1986). This concept was further developed by Bauer (n.d.), who explored the relationship between consumer behavior and perceived risk. Dowling (1986) suggested that uncertainty is a common experience for consumers before and after making purchases. Several studies have investigated the concept of perceived risk in consumer behavior, and how it influences decision-making processes. For instance, (Stone and Gronhaug, 1993) argued that perceived risk is a key factor in the consumer decision-making process, and that different types of perceived risk (such as performance, financial, psychological, and social risks) can significantly affect consumer behavior. In the context of online shopping, (Jarvenpaa and Todd, 1997) found that the perceived risk of privacy invasion, product quality, and delivery reliability were significant concerns for online consumers. Furthermore, (Hofacker et al., 2003) identified that the lack of sensory information and the inability to physically examine products were major sources of perceived risk in online shopping. Regarding social media as a platform for online shopping, (Chen and Barnes, 2007) investigated the impact of word-of-mouth communication on consumer trust in online shopping. The study found that positive word-of-mouth communication significantly increased consumers' trust in the online retailer and decreased their perceived risk.
# e) Customer Care, Pre Purchasing and Post Purchasing Service (CCPSF)
In his book "The Psychology of Customer Care," James J. Lynch elaborates on the concept of customer care and identifies two types of care: total quality and total care. Both types of care are essential for managing customer expectations, as customers have a constant need for high-quality service and products. To meet these needs, it is crucial to consider human resources and compliance issues (Sheth and Mittal, 1996). Customer care has become increasingly important in the online business landscape, as it can significantly impact customer satisfaction and loyalty. By providing excellent customer care, businesses can improve their brand reputation, increase customer retention rates, and gain a competitive edge in the market. Therefore, understanding the factors that influence customer care is essential for businesses looking to succeed in the online marketplace. To better understand the importance of customer care in online shopping behavior through social media, this study examines six variables related to customer care: service quality, reliability, responsiveness, empathy, assurance, and tangibility. By evaluating these variables, the study aims to create hypotheses and determine how each variable influences the latent construct of customer care in the context of online shopping through social media.
### f) Cost Factors
Online commerce entails a multitude of expenses, among which transaction cost and product cost are the most commonly associated. In this study, we aim to explore the significance of cost factors in conducting online business. Specifically, we adopt a transactional perspective to investigate consumers' perceptions of the costs involved in online transactions, including the cost of using the internet and the cost comparison between local and international merchant-dise. Through a comprehensive analysis of these cost factors, we hope to shed light on the impact of cost considerations on online purchasing behavior and provide insights for businesses looking to improve their online operations.
## III. RESEARCH METHODOLOGY
### a) Study Approach
This study utilized both partial least square and structural equation modeling techniques to analyze the factors that affect online shopping behavior through social media. The research process is depicted in Figure 2, which was designed to address the issues raised in this study. The study also employed several data scaling techniques to maximize the variable loading.
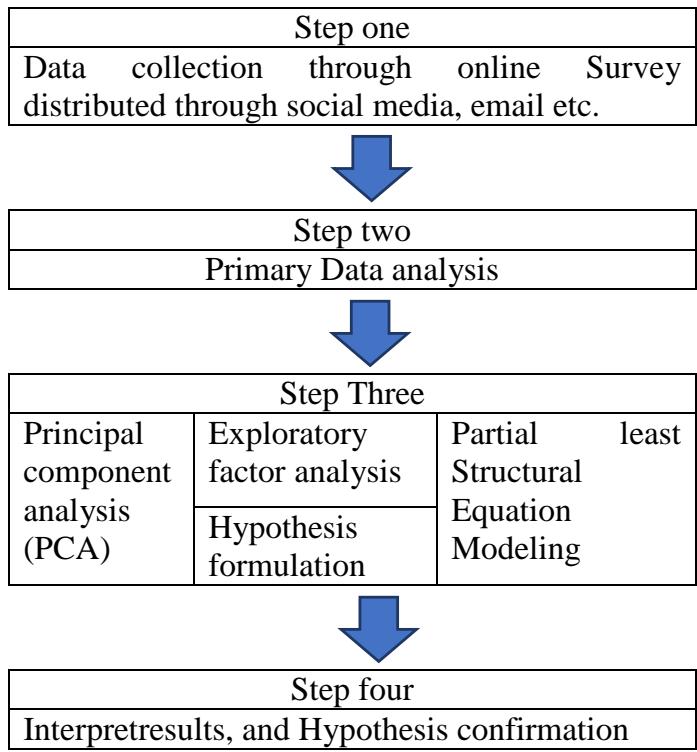 Figure 2: Research Development Workflow
### b) Survey Instrument
The survey tool used in this study aimed to assess the impact of various factors on online shopping behavior through social media. The questions were designed to cover seven categories, including the participant's social and economic profile, social media behavior, buying and shopping behavior, the influence of technology and technology acceptance, online risk assessment, customer care, and cost analysis
### c) Survey Measurement Scale
The research used various methodologies to gather responses from the participants. The questions were categorized into different sections, and each section used a different measurement weight that was specifically chosen to measure the relevant variables. The first section collected demographic information about the participants, such as their age, marital status, level of education, whether they have a family and dependents, their job, income range, and the city they reside in. The questions in the second section were designed based on specific categories, and a market survey was conducted to establish the basis for these questions. For sections three to seven, the participants were asked to respond to the questions using a five-point Likert scale. The scale ranged from "strongly disagree/never" to "strongly agree/always." This allowed the researchers to quantify the participants' responses and analyze them using statistical techniques. Overall, this methodology ensured that the data collected was comprehensive, reliable, and valid for the study's purposes.
### d) Data Collection
### e) Hypothesis formulation
According to the introduction and literature review, as well as interviews with industry owners and social media users, latent indicators can be classified into different categories. Five variables were created by reorganizing latent variables. Incorporating certain observable variables into one domain of latent construct yields the maximum number of variables per latent variable required to provide a decent outcome. The composition of five hypotheses that cross-check cause and effect between latent variables and observable variables in structural equation modeling was ascribed to the formation of these five latent variables.
H1: Social and economic factors (SEF) have significant effects on online and social media shopping and buying behavior (SMBF)
H1.b: Adaptability of Technology and Internet comes easy with better social economic status, so social and economic construct has significant impact on technology and internet adaptability. (TIAF)
H2: Technology Internet Acceptance factors (TIAF) has significant on online and social media shopping and buying behavior (SMBF).
H3: Security and Risk assessment factors (SRAF) has significant on online and social media shopping and buying behavior (SMBF).
H3.b: Security and Risk assessment factors (SRAF) has significantly influence on how user adopt technology and internet use (TIAF).
H4: Cost Analysis (CAF) has significant on online and social media shopping and buying behavior(SMBF).
H4.b: Cost Analysis (CAF) has significant impact on the Technology Internet Acceptance factors (TIAF)
H5: Customer care, pre purchasing and Post Purchasing services factors (CCPSF) has significant on online and social media shopping and buying behavior(SMBF).
H5. b: Customer care, pre purchasing and Post Purchasing services factors (CCPSF) has significant on cost factors (CAF).
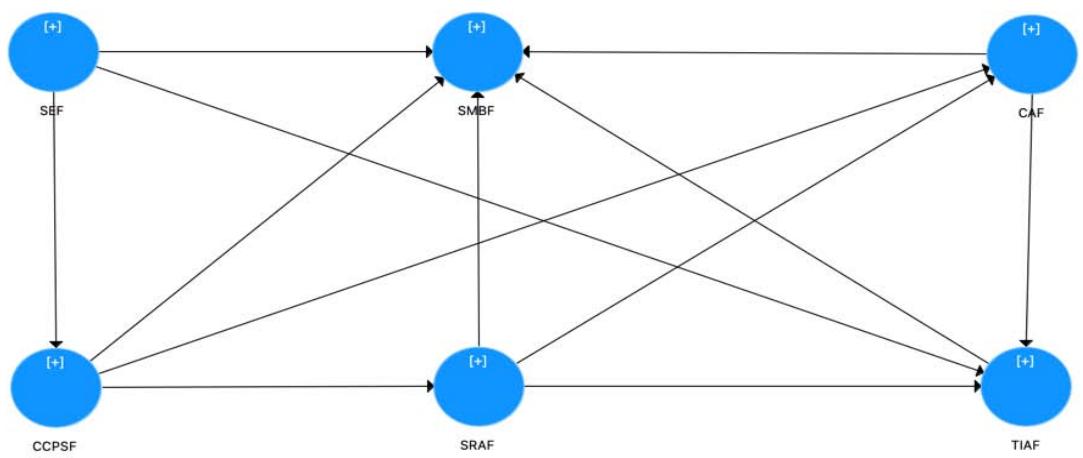 Figure 3: Proposed Theoretical Model to Conceptualize H1:H5
## IV. RESULTS DISCUSSION AND FINDINGS
### a) Statistical Summary of Data Collected from Participants form
Total of 344 participants partake online survey aim to measure seven categories as summarized in Table 1. Survey was segmented into eight sections with 50 questions in total. The first section aimed to obtained participant basic information such as age, economic status, second section meant to capture participants internet and social media knowledge, in section three question was designed to obtain partaker shopping behavior information. In section four it aimed to measure customer buyer selection, how costumer made a choice about buyer. Section five is about acceptance of Internet and use of social media as shopping platform. Risk assessment and risk acceptance were measured in question designed in section six, section seven questioner designed to capture Customer care, pre purchasing and Post Purchasing service and last section was cost analysis, cost comparison about online shopping and physical shopping with reference to cost of internet. Participant demographic distribution were explained in Table 1. Participants data collected indicate that, $50.58\%$ are female and $49.41\%$ are male. $16\%$ of female age are in range between 18-25, $41.6\%$ are between 26-30 and the rest are above 30 years old. Male participants age, $17.6\%$ are in range of 18-25 years, $55.5\%$ age range between 26-30, and $26\%$ are above 31 years old. Education data distribution signifies that participant were well educated so that they understood questions, $46.6\%$ of participants have bachelor degree and $35.9\%$ has postgraduate degree. $60.89\%$ of study female participants are single and $33.97\%$ are married while 56.2 of male are single and $43.79\%$ are married.
Table 1: Participants Social and Economic Data Distribution
<table><tr><td colspan="3">Variable</td><td>N=344</td></tr><tr><td rowspan="2" colspan="2">Gender</td><td>Female</td><td>174</td></tr><tr><td>Male</td><td>170</td></tr><tr><td rowspan="6">Age</td><td rowspan="3">Female</td><td>18-25</td><td>28</td></tr><tr><td>26-30</td><td>72</td></tr><tr><td>31- above</td><td>74</td></tr><tr><td rowspan="3">Male</td><td>18-25</td><td>30</td></tr><tr><td>26-30</td><td>94</td></tr><tr><td>31- above</td><td>46</td></tr><tr><td rowspan="4" colspan="2">Marital Status</td><td>Single</td><td>194</td></tr><tr><td>Married</td><td>139</td></tr><tr><td>Divorced</td><td>10</td></tr><tr><td>Widow</td><td>1</td></tr><tr><td rowspan="5" colspan="2">Education</td><td>Primary Education</td><td>2</td></tr><tr><td>Secondary Education</td><td>8</td></tr><tr><td>Diploma or Certificate or High School</td><td>50</td></tr><tr><td>Bachelor Degree</td><td>160</td></tr><tr><td>Masters and Post graduate</td><td>123</td></tr><tr><td rowspan="2" colspan="2">Have or not have family</td><td>Have a family</td><td>260</td></tr><tr><td>Not have a family</td><td>84</td></tr><tr><td rowspan="5" colspan="2">Job</td><td>Self Employed</td><td>135</td></tr><tr><td>Employed In Private Sector</td><td>73</td></tr><tr><td>Employed In government sector</td><td>61</td></tr><tr><td>Not Employed</td><td>53</td></tr><tr><td>Student (dependent)</td><td>23</td></tr><tr><td rowspan="5" colspan="2">Monthly Income</td><td>0-300,000</td><td>84</td></tr><tr><td>300,001-600,000</td><td>54</td></tr><tr><td>600,001-1,000,000</td><td>59</td></tr><tr><td>1,000,001 - 1,500,000</td><td>44</td></tr><tr><td>1,500,000 and above</td><td>73</td></tr></table>
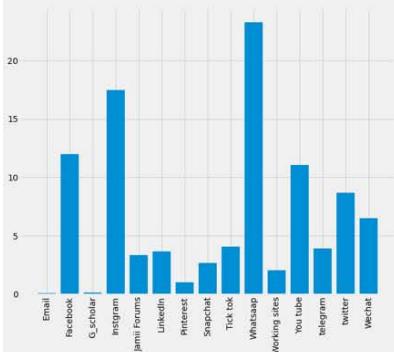 [A].Social Media Usage Distribution
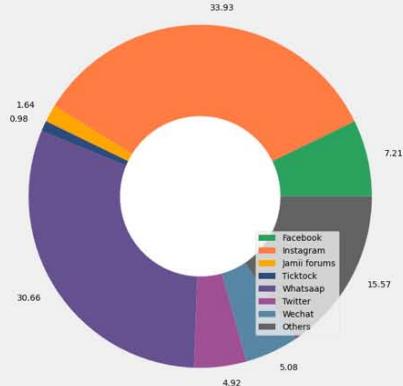 [B].Social Media For shopping
 [C].Online Shopping Platforms Preference Figure 4: Social Media Usage Distribution
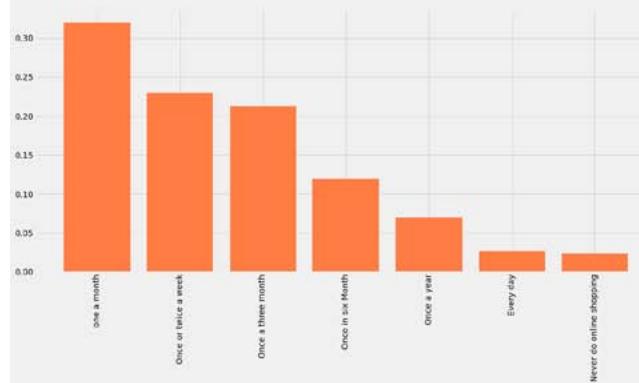 [A].HowOftetenPeopleShopOnline
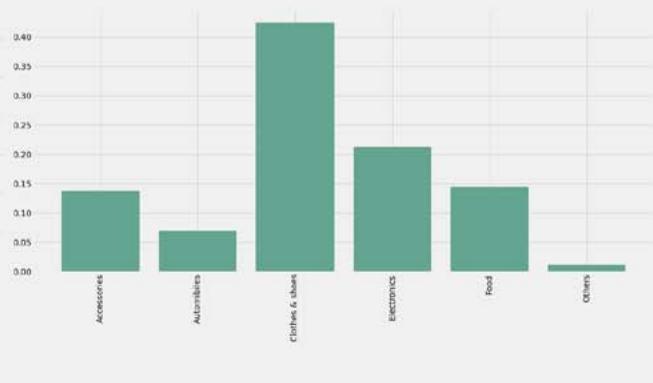 [B].Products frequently Purchased Online Figure 5: How Often People Shop Online and What Products Often Purchased Online
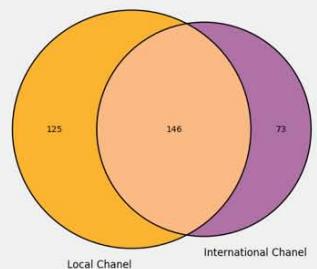
Figure 3: Figure 4 depicts primary data distribution obtained throughout this investigation. Figure 3(A) shows mostly commonly used social media in Tanzania, with WhatsApp as leading social media, followed by Instagram and Facebook. In usage for social media usage for shopping, Figure 3(B) demonstrates that Instagram had the greatest ration of social media usage for shopping at 33.93 percent, followed by WhatsApp at 30.66 percent. In comparison to international shopping, data sample expresses that 125 fancy buying online at local platforms, 73 prefers international platforms, and 146 prefers both local and international platforms. Figure 4[A] shows that 31.9 percent like to shop once a month, 22.96 percent shop once or twice a week, 11.91 percent shop once every six months, 2 percent shop every day, and just 2 percent never conduct online shopping. Figure 4[B] shows that the clothing and shoes account for 42.41 percent of all items ordered online, followed by Electronics products (21.2 percent), food, Accessories, and Automobiles (14.29 percent, 13.81 percent, and $7\%$, respectively).
### b) Data Modeling and Results
To construct acceptable Structural equation model, appropriate number of factors were needed to be contrived, and to find meaningful relationship between latent variables observed variables. Sideridis
(Sideridis et al. 2014) founds that 70 sample size is adequate for four latent variable.
With seven constructs, a minimum required sample size is 150, as sample size of 344 prove to be adequate.
In this section, we use factor analysis to locate acceptable factors for building measurement models. We performed KMO testing to retain variables with KMOs of 0.75 or higher and reject those with KMOs less than 0.75, leaving a total of 46 variables in the dataset. Bartlet's test of sphericity was used to determine whether two variables were orthogonal. The Pearson correlation test was employed to assess the concurrent validity between variables. According to the findings (Chisq (990) = 4328.15, p.001), there is sufficient significant correlation in the data to carry out a factor analysis. Principal component analysis (PCA) was used before developing structure equation modeling in order to minimize data dimensionality and to extract variance explained by the least number components. Following that, factor analysis was used to identify variable loadings that would be used in confirmatory factor analysis. Our data set contained 45 variables, our guidance of principal components to use is to accept all principal components that explain more than one variable.
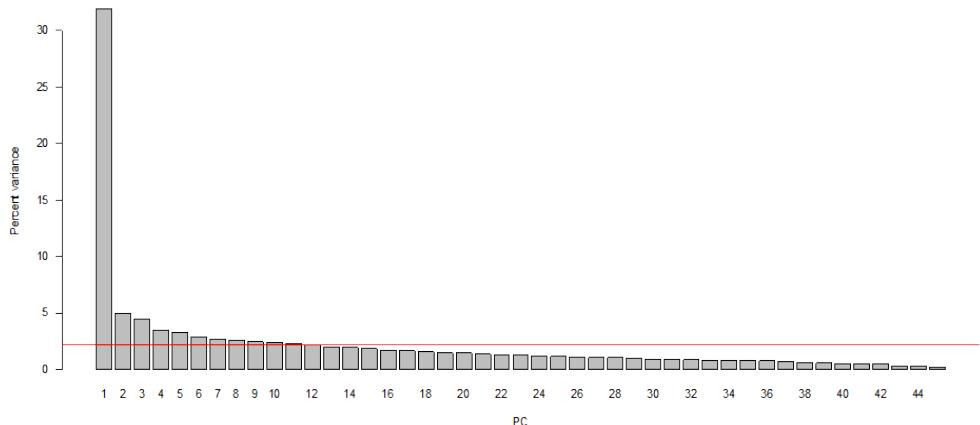 Figure 6: Principal Component Variance Explained, Percent in Variance is Obtained by Squaring Standard Deviation of PCA With A Ratio to Total of Variance Figure 5: express variance explained by principal component analysis, for our dataset that has been reduced to 45 variables, the first components explained only
$31.97\%$ of variance. To account for more than $50\%$ of variance we need more than 10 components, than will provide $52.32\%$ of variance.
### c) Exploratory Factor Analysis (EFA) Model Selection
To select correct number of factors for exploratory factor analysis has been contested by many researchers. (Preacher, Kim, and Mels 2013) explains that selection of number of factors should adequate enough to perfectly describe the population factor structure. (Jamieson, Rick H. Hoyle and R 2016) suggest that there is no single approach in calculating the needed number of factors for EFA models. Many aspects are addressed in these arguments, including model complexity and what the true purpose of researchers. To examine the preceding arguments, we ran 12 EFA models and performed metrics assessment to pick the most suitable model, criteria and theoretical background of these models has been presented in Table 2
Table 2: Exploratory factor analysis Models, Factor Analysis using Minimum Residuals with Varimax Rotation
<table><tr><td>Number of factors</td><td>Chi square (X2)</td><td>Degree of freedom (df)</td><td>p_value</td></tr><tr><td>m=1</td><td>2792.29</td><td>945</td><td>1.46e-181</td></tr><tr><td>m=2</td><td>2319.44</td><td>901</td><td>1.17e-125</td></tr><tr><td>m=3</td><td>1875.39</td><td>858</td><td>9.46e-78</td></tr><tr><td>m=4</td><td>1575.93</td><td>816</td><td>8.57e-51</td></tr><tr><td>m=5</td><td>1336.19</td><td>775</td><td>1.79e-32</td></tr><tr><td>m=6</td><td>1200.11</td><td>735</td><td>5.87e-25</td></tr><tr><td>m=7</td><td>1074.29</td><td>696</td><td>1.11e-18</td></tr><tr><td>m=8</td><td>922.56</td><td>658</td><td>3.68e-11</td></tr><tr><td>m=9</td><td>817.57</td><td>621</td><td>1.73e-07</td></tr><tr><td>m=10</td><td>716.68</td><td>585</td><td>0.000151</td></tr><tr><td>m=11</td><td>637.43</td><td>550</td><td>0.00574</td></tr><tr><td>m=12</td><td>570.87</td><td>516</td><td>0.0473</td></tr></table>
Selection of good model requires one to make a choice between a good fit and parsimony. Presented with for indicators, with each indicators fits different conditions. Table 2 data can show that, with increase of model trend, number there in increase of TLA, decrease in $\mathsf{X}^{\wedge}2$. (Johnson and Stevens 2001) argued that best fit factor model should have RMSE $< 0.05$, TLI $> 0.6$, with low Number of factors (m) and with minimum number of RMSR. Chi square $\mathsf{X}^{\wedge}2$ is considered as model discrepancy measure, it is calculated as difference between expected model and actual model, with a low chi-square value relative to the degrees of freedom (and higher p-value) indicating better model fit. Model m=10was selected, with the harmonic number of observations is 344 with the empirical chi square
### d) Exploratory Factor Analysis Models Results
The final results of exploratory analysis using varimax rotation, showed the test of the hypothesis that six (6) factors are sufficient. The chi square statistic is 1559.97 on 696 degrees of freedom while the p-value is 4.01e-68. Table 2 specifies exploratory factor model loadings, with cut point significant than 0.3 or less than -0.3, 45 variables were loaded, with seven latent constructs categorized. The construction of latent constructs was extracted from literature explained in Section two. Latent variables intended to cover seven factors that in collective reflect factors that influence online shopping.
Table 3: Factor Loadings for Exploratory Factor Analysis between Variables, Promax Rotation Used as Rotation Methodology
<table><tr><td>Number of factors</td><td>Chi square (X2)</td><td>Degree of freedom (df)</td><td>p_value</td></tr><tr><td>m=1</td><td>2792.29</td><td>945</td><td>1.46e-181</td></tr><tr><td>m=2</td><td>2319.44</td><td>901</td><td>1.17e-125</td></tr><tr><td>m=3</td><td>1875.39</td><td>858</td><td>9.46e-78</td></tr><tr><td>m=4</td><td>1575.93</td><td>816</td><td>8.57e-51</td></tr><tr><td>m=5</td><td>1336.19</td><td>775</td><td>1.79e-32</td></tr><tr><td>m=6</td><td>1200.11</td><td>735</td><td>5.87e-25</td></tr><tr><td>m=7</td><td>1074.29</td><td>696</td><td>1.11e-18</td></tr><tr><td>m=8</td><td>922.56</td><td>658</td><td>3.68e-11</td></tr><tr><td>m=9</td><td>817.57</td><td>621</td><td>1.73e-07</td></tr><tr><td>m=10</td><td>716.68</td><td>585</td><td>0.000151</td></tr><tr><td>m=11</td><td>637.43</td><td>550</td><td>0.00574</td></tr><tr><td>m=12</td><td>570.87</td><td>516</td><td>0.0473</td></tr></table>
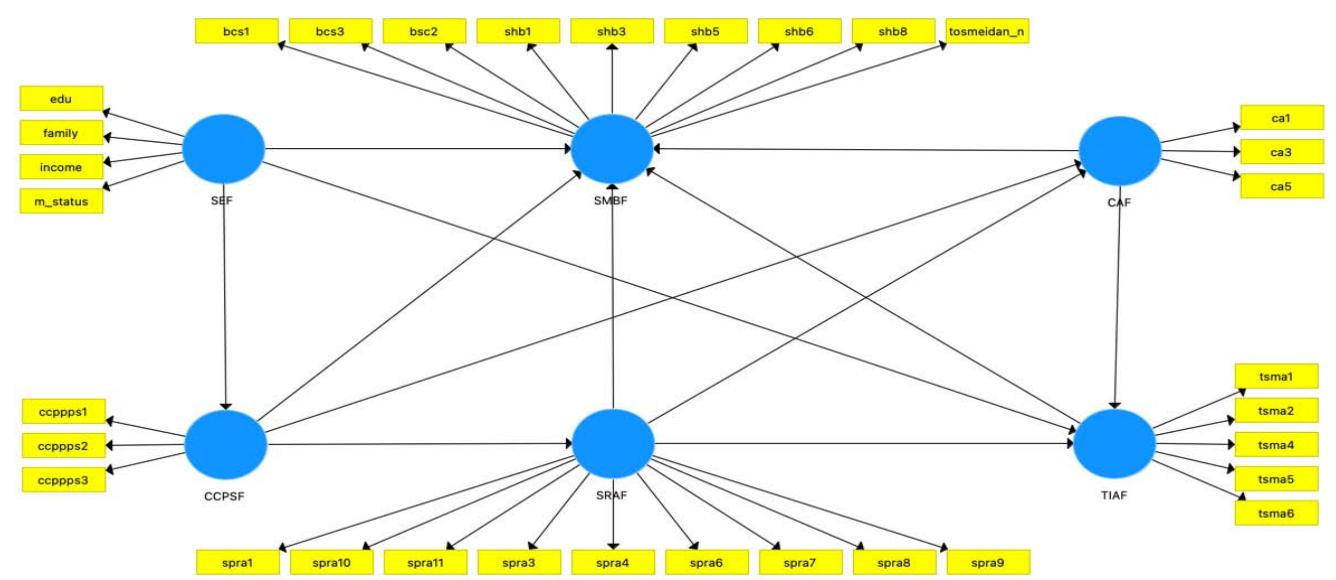
The variables that pass Exploratory Factor analysis (EFA) cut off point was used to develop theoretical model to assess the online consumer behavior through social media. Hypothesis established in section3.4, was put into test using Smart PLS statistical software. To put H1 to H5 to test, theoretical model of five latent variables were developed. With five latent variables, reliable results depend on maximum number of observed indictors. However, Structural equation modeling allows only three number of indicators per latent variable as required minimum. In this study, five latent variables with total of five indicators, a least number of indicators per latent variable is 6 while maximum number of indicators per latent parameter is 11. Foundation of SEM model consists two parts, measurement model and structural model. Smart Pls perform these tasks simultaneous.
### e) Measurement Model Assessment
Six latent variables were created using the results of exploratory factor analysis. (1) SHBB stands for shopping and purchasing factors, and it was created by combining two theoretical constructs, social media behavior factors (SMBF) and Buy and Shopping Behavior (BSB). (2): SEF as social and economic aspects, (3): TIAF as technology and internet acceptance elements, (4): SRAF as security and privacy factors, (5): Customer care, pre-purchase and postpurchase service (CCPSF), and (6): CA and cost analysis. The outer model has 39 variables in total, with a minimum of three and a maximum of seven for each latent construct. Evaluation of measurement model was done using several statistical methodologies to analyze the indictor loadings validity. We tabulate each latent variable with respective indicators in Table 4 to show out model consistency and convergent. Outer model loadings represent contribution of each indicator to their respectively latent construct.
Various studies have been conducted to determine the needed minimum loading value for the outer model, with the required value ranging from 0.4 to 0.7 as a satisfactory required loading.(F. Hair Jr et al. 2014) argued that $0.70\%$ loadings required to explain more than $50\%$ variance, and (Hair, Sarstedt, and Ringle 2019) stated that even loading just over 0.5 loadings can be sufficient to support that model's suitability for explaining the relationship between indicators and latent variables. In this study, all loading has been represented, regardless of low loadings below suggestions from previous research, we defend this decision as we use exploratory factor analysis to extract out variables with low loadings.
In the course of testing theoretical model internal consistency, Cronbach's alpha, composite Reliability and Rho factor were used. Cronbach's alpha can be written as a function of the number of test items and the average inter-correlation among the items, and we use it to measure how close group of indicators related to a single variable(Bruin 2006). The difference between Cronbach's alpha and composite Reliability is explained by Guzman, and argued that Cronbach's alpha considered for more for loading quality and composite Reliability does not express for model validity, both these three factors need to pass threshold value of 0.6. (Guzman et al. 2022),
Table 4 represents reliability and convergent Validity for Partial Least Squares, with 33 variables loaded in the model, all 33 variables loadings are above 0.5 which indicates $100\%$ of all indicators, and 27 variables which is $61.54\%$ of all variables registered loadings above 0.699. In contrary, only four variables' records loading with less than 0.5 was sh b2 =0.47, and ca3 which register lowest values of -0.28.
Data from Table 4 can confirm that, out of six latent constructs, five latent variables Cronbach Alpha and Composite Reliability pass threshold value of 0.7, and only one latent factor (CAF) registered value of 0.637. furthermore we incorporate Rho factoras suggested by (Chin n.d.), and argued by (Demo et al. 2012), that it postulate better reliability measure than Cronbach's alpha in Structural Equation Modeling. Rho (p) model results was very satisfactory ranging from 0.67 to 0.88.In addition as in table 4, Average variance Explained (AVE) was incorporated as another test for convergent validity, and the average variance extracted in each specific latent variable was determined. Inclusion of AVE validate quality of variance extracted in each latent variable. Range of variance extracted is 0.7398 to 0.44.SMBF recorded an AVE value of 0.4; different research suggests that the needed AVE should be 0.5, Liao explains that 0.4 is sufficient for models to be effective (Liao and Hsieh 2017). Furthermore, Hensel explains that if the AVE for the construct variable is less than 0.5 and the Composite reliability is greater than 0.6, the construct's convergent validity can be appropriate (Henseler, Ringle, and Sarstedt 2015).
Average explained variance square root was used to construct discriminant validity, this test is regarded as one important factor in analyzing structural equation model measurement part. The test validity will ensure that each latent variable epitomize unique concept with regard to others and capture idea that is not represented by other latent variables (Hair, Sarstedt, et al. 2019). Results from Table 6 suggests that validity score for each latent variables is below 0.90 as suggested by (Hair, Sarstedt, et al. 2019; Henseler et al. 2015) To support path coefficient analysis, discriminant validity test was used, by comparing of average variance explained (AVE) with correlation coefficient for each latent construct. Table 6 confirmed discriminant of six latent variables. Results show that, all variable met discriminant condition, as diagonal are higher.
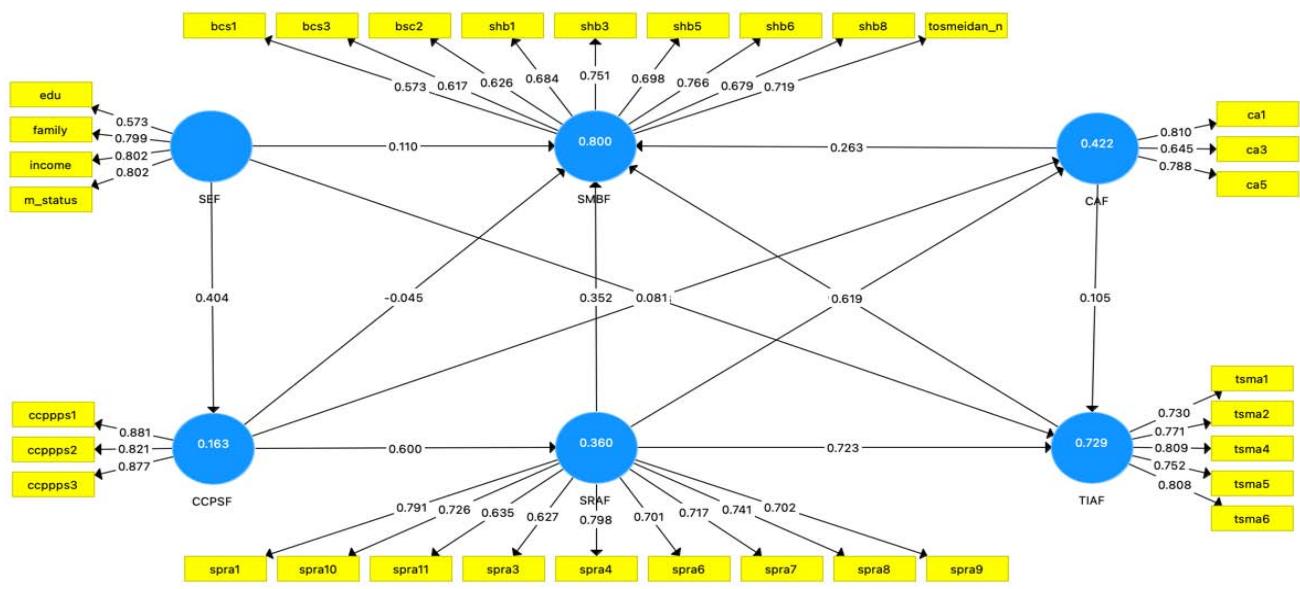 Figure 7: Measurement Model Loadings
Table 4: Outer Model Loadings, Reliability and Convergent Validity for Each Latent Construct
<table><tr><td>Latent Variable</td><td>Observable variables (indicators)</td><td>Model Out Loading</td><td>Cronbach Alpha</td><td>Rho factor</td><td>Composite Reliability</td><td>Average Variance Extracted</td></tr><tr><td rowspan="9">SMBF</td><td>bcs1</td><td>0.572</td><td rowspan="9">0.8553</td><td rowspan="9">0.8660</td><td rowspan="9">0.8858</td><td rowspan="9">0.4648</td></tr><tr><td>bcs3</td><td>0.617</td></tr><tr><td>bsc2</td><td>0.625</td></tr><tr><td>shb1</td><td>0.684</td></tr><tr><td>shb3</td><td>0.751</td></tr><tr><td>shb5</td><td>0.698</td></tr><tr><td>shb6</td><td>0.766</td></tr><tr><td>shb8</td><td>0.679</td></tr><tr><td>shb8</td><td>0.718</td></tr><tr><td rowspan="4">SEF</td><td>edu</td><td>0.575</td><td rowspan="4">0.7391</td><td rowspan="4">0.7692</td><td rowspan="4">0.8352</td><td rowspan="4">0.5630</td></tr><tr><td>family</td><td>0.802</td></tr><tr><td>income</td><td>0.799</td></tr><tr><td>m status</td><td>0.800</td></tr><tr><td rowspan="6">TIAF</td><td>tsma1</td><td>0.72</td><td rowspan="6">0.8325</td><td rowspan="6">0.8332</td><td rowspan="6">0.8820</td><td rowspan="6">0.5995</td></tr><tr><td>tsma2</td><td>0.77</td></tr><tr><td>tsma3</td><td>0.67</td></tr><tr><td>tsma4</td><td>0.81</td></tr><tr><td>tsma5</td><td>0.75</td></tr><tr><td>tsma5</td><td>0.79</td></tr><tr><td rowspan="9">SPRF</td><td>spra1</td><td>0.791</td><td rowspan="9">0.8810</td><td rowspan="9">0.8851</td><td rowspan="9">0.9047</td><td rowspan="9">0.5148</td></tr><tr><td>spra3</td><td>0.627</td></tr><tr><td>spra4</td><td>0.798</td></tr><tr><td>spra6</td><td>0.701</td></tr><tr><td>spra7</td><td>0.717</td></tr><tr><td>spra8</td><td>0.741</td></tr><tr><td>spra9</td><td>0.703</td></tr><tr><td>spra10</td><td>0.791</td></tr><tr><td>spra11</td><td>0.726</td></tr><tr><td rowspan="3">CCPSF</td><td>ccppps1</td><td>0.883</td><td rowspan="3">0.8256</td><td rowspan="3">0.8416</td><td rowspan="3">0.8951</td><td rowspan="3">0.7400</td></tr><tr><td>ccppps2</td><td>0.822</td></tr><tr><td>ccppps3</td><td>0.875</td></tr><tr><td rowspan="3">CAF</td><td>ca1</td><td>0.821</td><td rowspan="3">0.6376</td><td rowspan="3">0.6853</td><td rowspan="3">0.7919</td><td rowspan="3">0.5619</td></tr><tr><td>ca3</td><td>0.637</td></tr><tr><td>Ca5</td><td>0.779</td></tr></table>
Table 5: Construct Discriminate and Validity Structure Model Assessment
<table><tr><td></td><td>CAF</td><td>CCPSF</td><td>SEF</td><td>SMBF</td><td>SRAF</td><td>TIAF</td></tr><tr><td>CAF</td><td>0.7496</td><td></td><td></td><td></td><td></td><td></td></tr><tr><td>CCPSF</td><td>0.4201</td><td>0.8602</td><td></td><td></td><td></td><td></td></tr><tr><td>SEF</td><td>0.7305</td><td>0.4034</td><td>0.7503</td><td></td><td></td><td></td></tr><tr><td>SMBF</td><td>0.7537</td><td>0.4825</td><td>0.7106</td><td>0.6818</td><td></td><td></td></tr><tr><td>SRAF</td><td>0.6511</td><td>0.6001</td><td>0.6538</td><td>0.8292</td><td>0.7175</td><td></td></tr><tr><td>TIAF</td><td>0.6361</td><td>0.5201</td><td>0.6283</td><td>0.8227</td><td>0.8462</td><td>0.7743</td></tr></table>
The first part in structure model assessment of structural equation modeling is to construct hypothesis testing. The bootstrapping for each hypothesis was implemented to calculate $p\_val, t\_test$ and pathcoefficient
$(\beta)$.Figure 8 displays the outcomes of the bootstrapping structure model, while Table 6 summarizes the latent variables' Sample Mean, Standard Deviation, Statistics, and P Values.
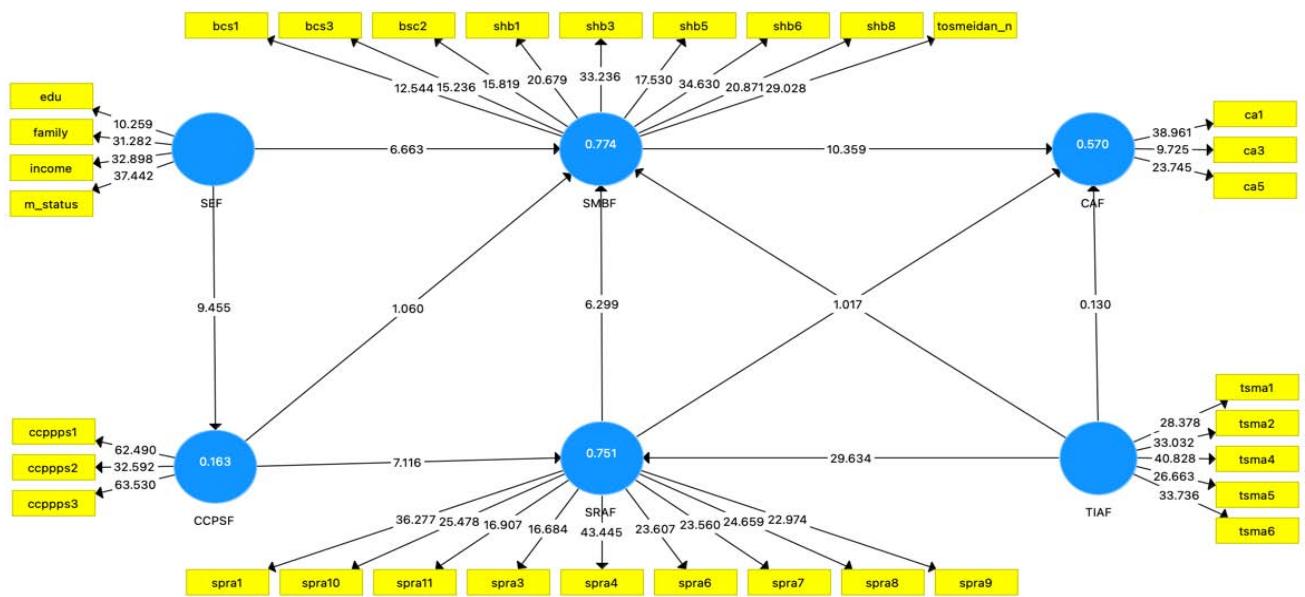 Figure 8: Model Bootstrapping with Path Coefficient and t value
Table 2: Boostraping: latent Variables Multicollinearity, the Significant Value was Considered at p_value\<0.05
<table><tr><td>Latent construct Path Relationship</td><td>Original Sample (O)</td><td>Sample Mean (M)</td><td>Standard Deviation</td><td>T Statistics</td><td>P Values</td></tr><tr><td>CAF -> SMBF</td><td>0.263</td><td>0.2633</td><td>0.0356</td><td>7.3959</td><td>0</td></tr><tr><td>CAF -> TIAF</td><td>0.1052</td><td>0.1045</td><td>0.0451</td><td>2.3304</td><td>0.0198</td></tr><tr><td>CCPSF -> CAF</td><td>0.0483</td><td>0.0485</td><td>0.0517</td><td>0.9349</td><td>0.3499</td></tr><tr><td>CCPSF -> SMBF</td><td>-0.0454</td><td>-0.0447</td><td>0.0311</td><td>1.4601</td><td>0.1443</td></tr><tr><td>CCPSF -> SRAF</td><td>0.6003</td><td>0.6018</td><td>0.0336</td><td>17.85</td><td>0</td></tr><tr><td>SEF -> CCPSF</td><td>0.4037</td><td>0.4062</td><td>0.0421</td><td>9.5848</td><td>0</td></tr><tr><td>SEF -> SMBF</td><td>0.1097</td><td>0.1097</td><td>0.0403</td><td>2.7229</td><td>0.0065</td></tr><tr><td>SEF -> TIAF</td><td>0.0812</td><td>0.0825</td><td>0.0466</td><td>1.7418</td><td>0.0816</td></tr><tr><td>SRAF -> CAF</td><td>0.6193</td><td>0.6225</td><td>0.0418</td><td>14.8003</td><td>0</td></tr><tr><td>SRAF -> SMBF</td><td>0.3522</td><td>0.3519</td><td>0.0592</td><td>5.9516</td><td>0</td></tr><tr><td>SRAF -> TIAF</td><td>0.7233</td><td>0.7234</td><td>0.0347</td><td>20.8364</td><td>0</td></tr><tr><td>TIAF -> SMBF</td><td>0.3103</td><td>0.3102</td><td>0.0546</td><td>5.6876</td><td>0</td></tr></table>
Path coefficient is described by Genet as a partial link between two constructs or between a dependent variable and a dependent variable(Genet 1994). It denotes the direct impact of one variable on another that is thought to be its cause. We use t- statistics to find the magnitude of difference in our sample data, and we apply $p\_value$ to accept or reject the hypothesis. The results of analysis indicate that, our study reject three hypothesis and accept six hypotheses as displayed in Table 7.
Table 7: Model- Hypothesis Testing Evaluation Results
<table><tr><td>Hypothesis</td><td>Path Relationship</td><td>Path Coefficient β</td><td>t-value</td><td>p-value</td><td>F-squared</td><td>Hypothesis results</td></tr><tr><td>H1</td><td>SEF -> SMBF</td><td>0.1097</td><td>2.723</td><td>0.0065</td><td>1.272</td><td>Supported</td></tr><tr><td>H1.b</td><td>SEF -> TIAF</td><td>0.081</td><td>1.742</td><td>0.0816</td><td>0.77</td><td>Rejected</td></tr><tr><td>H2</td><td>TIAF -> SMBF</td><td>0.3103</td><td>5.682</td><td>0.000</td><td>2.605</td><td>Supported</td></tr><tr><td>H3</td><td>SRAF -> SMBF</td><td>0.3522</td><td>7.630</td><td>0.000</td><td>2.796</td><td>Supported</td></tr><tr><td>H3.b</td><td>SRAF -> TIAF</td><td>0.352</td><td>5.952</td><td>0.000</td><td>6.592</td><td>Supported</td></tr><tr><td>H4</td><td>CAF -> SMBF</td><td>0.263</td><td>7.394</td><td>0.00</td><td>3.267</td><td>Supported</td></tr><tr><td>H4.b</td><td>CAF -> TIAF</td><td>0.105</td><td>2.230</td><td>0.00</td><td>1.118</td><td>Supported</td></tr><tr><td>H5</td><td>CCPSF -> SMBF</td><td>-0.045</td><td>1.449</td><td>0.000</td><td>0.144</td><td>Rejected</td></tr><tr><td>H5.b</td><td>CCPSF-> CAF</td><td>0.048</td><td>2.215</td><td>0.349</td><td>0.350</td><td>Rejected</td></tr></table>
Another way to evaluate the alteration in the dependent variable is through determining the effect size and presenting the p-value (Durlak, 2009). (F. Hair Jr et al. 2014) have established guidelines for interpreting the effect size values. If the value is less than or equal to 0.02, it suggests a weak small association. If the value is greater than 0.15 but less than 0.35, it indicates a moderate or medium level of relationship. Finally, a strong impact of the independent variable on the dependent variable is indicated if the value is greater than 0.35As demonstrated in Table 8of our investigation, we found that of the six acknowledged hypotheses, two exhibit a strong association, three demonstrate a medium relationship, and one displays a weak correlation.
Table 8: Effect size of Accepted Hypotheses
<table><tr><td>Latent Construct Relationship</td><td>Effect Size</td><td>Evaluations</td><td>Hypothesis</td></tr><tr><td>SEF -> SMBF</td><td>0.3065</td><td>Medium</td><td>H1</td></tr><tr><td>TIAF -> SMBF</td><td>0.3103</td><td>Medium</td><td>H2</td></tr><tr><td>SRAF -> SMBF</td><td>0.7597</td><td>Strong</td><td>H3</td></tr><tr><td>SRAF -> TIAF</td><td>0.7885</td><td>Strong</td><td>H3.b</td></tr><tr><td>CAF -> SMBF</td><td>0.2956</td><td>Medium</td><td>H4</td></tr><tr><td>CAF -> TIAF</td><td>0.1052</td><td>Weak</td><td>H4.b</td></tr></table>
## V. DISCUSSION
The aim of this study was to investigate the factors that influence buying behavior through social media. To achieve this, several hypotheses were developed and tested. Hypotheses H1 to H5 were created to evaluate the impact of latent constructs on purchasing and shopping behavior, while H1.B, H3.B, H4.B, and H5.B were developed to assess the influence of other constructs. The study found that Social and Economic Factors (SEF), Security and Risk Assessment Factors (SRAF), and Cost Analysis Factors (CAF) have a significant influence on buying behavior through social media. The first hypothesis (H1) that suggests social economic factors influence social media and buying behavior were supported by data collected in this study. This study found that Social and Economic Factors (SEF) play a significant role in shaping buying behavior through social media. SEF encompasses various aspects of a consumer's social and economic status, such as income, education level, and occupation, among others. These factors have been found to directly impact buying behavior through social media platforms.
The findings of the study regarding the medium effect of cost analysis on social media buying behavior and the weak effect on technology and internet factors are consistent with economic theory, which suggests that consumers make purchasing decisions based on their perceived value of the product or service relative to its cost. As a result, the affordability of products and services is a crucial factor in consumer decision-making, especially in online shopping where consumers have access to a wide range of products and prices. Several studies have supported the idea that cost is an important factor in online shopping behavior. For example, a study by Kim and Park (2013) found that price and shipping cost were the most important factors influencing 'consumers' online purchase decisions. Similarly, a study by Wang and Chen (2018) found that perceived value, which includes price and quality, was a significant predictor of consumers' intention to purchase online. In terms of the preference for international websites over local websites, this finding could be explained by the concept of comparative advantage in international trade. International websites may offer products at lower prices due to differences in production costs, taxation, and other factors, making them more attractive to consumers. This is supported by a study by Liang and Huang (2016), which found that consumers were more likely to purchase from overseas websites if the prices were lower than those offered by domestic websites.
The study also found that Technology Internet Acceptance Factors (TIAF) have a significant influence on social media buying behavior. This was associated with factors such as the accessibility of the internet, ease of use of social media, and the easiness of shopping through social media. Security and Risk Assessment Factors (SRAF) were also found to have a significant influence on buying behavior through social media, as they impact technology and internet factors. This suggests that security and privacy should be pivotal in designing shopping platforms. For example, a study by Hsiao and Chen (2018) found that perceived ease of use and perceived usefulness of technology are positively related to online purchase intention. Another study by Jindal and Jain (2018) found that perceived risk and trust in technology have a significant impact on online purchase intention. The study's finding that security and privacy should be pivotal in designing shopping platforms is crucial. This is because consumers are more likely to engage in online shopping activities if they trust the platform and feel secure in their transactions. As such, online merchants should prioritize the implementation of security measures and clearly communicate these measures to their customers to build trust and increase online sales. Moreover, the study's finding that Technology Internet Acceptance Factors (TIAF) have a significant influence on social media buying behavior underscores the importance of designing user-friendly platforms that are easy to navigate and use. This can help to increase customer satisfaction and loyalty, as well as drive sales.
In recent years, customer care has become a critical aspect of businesses, especially in the e-commerce industry, as it affects customer satisfaction and loyalty. However, the impact of customer care on online shopping behavior is still a subject of debate among researchers. Contrary to the findings of the study mentioned, some studies have found that customer care plays a significant role in shaping online shopping behavior. For example, a study by Wu et al. (2019) found that customer service quality significantly affects online purchase intention, while another study by Yeh and Li (2009) found that perceived customer service quality has a positive impact on customer satisfaction and loyalty. Moreover, pre-purchasing and postpurchasing service also play a crucial role in shaping online shopping behavior. For instance, a study by Wang et al. (2018) found that post-purchase service quality has a significant impact on customer satisfaction and loyalty. Another study by Shi et al. (2020) found that pre-purchase service quality positively influences customer satisfaction and trust, which, in turn, positively affects online purchase intention.
## VI. CONCLUSION AND RECOMMENDATION
The purpose of this study is to explore various factors that influence buying behavior through social media. Application of three methodologies: PCA, exploratory factor analysis and Partial least square structural equation modeling enable to find most necessary relationship between factors.PCA was used to find required maximum number of components necessary to construct factor analysis. Application of exploratory factor analysis indicates that, within framework of 45 variable only 39 were able to pass the threshold value of 0.3. theorized structure suggested that five variables loaded for social and economic factors, nine variables were found to contribute to buying and shopping behavior, eleven for security and risk, six for customer care and only 4 variables for cost analysis. Other variables that contribute to social and economic factors include education, family, and marital status. Each of these factors is supported by various literature as having an impact on buying behavior. Education has been found to provide a significant relationship in influencing online shopping. In this study, $96\%$ of the respondents had high education or higher. Those with higher levels of education tend to have a higher social status. It is also crucial, as highlighted by Wisniewska and Paginowska (2006), that such relationships are important and aid in online shopping, which can also be further observed in the future (Gauri et al. 2021).
This study construct five latent variables that was categorized to exogenous latent variables and endogenous latent variable. Partial least square Structural equation modeling was applied to explore the field Social and Economic, Social media behavior, Buy and Shopping Behavior, Technology Internet Acceptance, Security and Risk, Customer care, pre purchasing and Post Purchasing service and Cost factors and their effect to influence online shopping through social medias. Hypothesized model was tested using bootstrapping method, outcome raveled there are six significance relationship. Preeminent results with a reference to core end goal of this study denote buying behavior through social media is influenced by three latent constructs, Social economic factors, Technology acceptance and security and privacy. Surplus observation were included to disport interrelationship between variables, and results show that social factors are important for technology acceptance and adaptation, security and risk factors are important for technology adaption. This finding suggests that, interrelationship between created variable was meaningful and hypothesis formulated was valid. In the business and economic context of Tanzania, understanding the impact of social and economic factors on buying behavior through social media is essential for businesses to develop effective marketing strategies. The income level of Tanzanian consumers has a direct impact on their purchasing power and the products they can afford to buy. For example, consumers with higher income levels are likely to buy more expensive products, while those with lower income levels may prioritize affordability over quality. Moreover, the education level of Tanzanian consumers also plays a significant role in their purchasing behavior. Consumers with higher education levels may have different purchasing patterns compared to those with lower education levels. For instance, educated consumers may be more likely to purchase products based on quality, while less educated consumers may prioritize affordability. In addition to income and education levels, occupation is another important social and economic factor that influences buying behavior through social media. Tanzanian consumers working in different industries may have different preferences and priorities in terms of what they buy, where they buy it, and how they purchase it.
This can be explained through window of viewing that the culture of online shopping still new and vendors and consumers need to under.
This study presents results that open the door for following categories;
social media developers can use the finding in thisstudy to improve users' security and privacy.In theabsence of major shopping platforms, with betterconnectivity between users, social media playimportance part as eCommerce sites and security andprivacy should be a priority
Social media Users: Online businessmen can use the finding of this study to better understand their consumers.
Despite promised findings, during analysis, we observed that a huge number of variables are required to concept more meaningful causation effects. This suggests that, large number of datasets needed for such kind of model to converge, which in return it will provide good reliability and increase validity measures: Funding statement
This work was supported by Shanghai Municipal government Scholarship
Declaration of interest statement
The authors declare no conflict of interest
[^1]: Perceived usefulness: The degree to which a person believes that using a particular system may improve its performance. _(p.4)_
[^2]: Perceived Ease of Use: It is the degree to which a person believes that using an information system will be free of effort. _(p.4)_
[^637]: with prob $< 0.0001$, RMSEA index $= 0.046$ and the $90 \%$ confidence intervals are 0.044 and 0.048. _(p.9)_
Generating HTML Viewer...
References
49 Cites in Article
Abdel Al-Azzam,Mahmoud Fattah (2014). Evaluating Effect Of Social Factors Affecting Consumer Behaviour In Purchasing Home Furnishing Products In Jordan.
Zaid Ansari (2018). Socio Cultural Influences on Online Shopping Behaviour.
R Bauer Consumer Behavior as Risk Taking.
Jo Brown,Amanda Broderick,Nick Lee (2007). Word of mouth communication within online communities: Conceptualizing the online social network.
J Bruin (2006). newtest: command to compute new test.
Nicole Buzzetto-More (2013). Social Media and Prosumerism.
W Chin The Partial Least Squares Approach for Structural Equation Modeling.
Siew Chuah,Chin Lin,Gan (2013). The Influence of Individual Internal Factors on Impulse Buying Behaviour through Online Shopping.
F Davis A Technology Acceptance Model for Empirically Testing New End-User Information Systems: Theory and Results.
Felicita Davis,Manoj Francis Gnanasekar,Satyanarayana Parayitam (2021). Trust and product as moderators in online shopping behavior: evidence from India.
Gisela Demo,Elaine Neiva,Iara Nunes,Kesia Rozzett (2012). Human Resources Management Policies and Practices Scale (HRMPPS): Exploratory and Confirmatory Factor Analysis.
G Dowling (1986). Perceived risk: The concept and its measurement.
F Hair,Joe,Marko Sarstedt,Lucas Hopkins,G Volker,Kuppelwieser (2014). Partial Least Squares Structural Equation Modeling (PLS-SEM).
Dinesh Rupinder,P Jindal,Brian Ratchford,Edward Fox,Amit Bhatnagar,Aashish Pandey,Jonathan Navallo,John Fogarty,Stephen Carr,Eric Howerton (2021). Evolution of Retail Formats: Past, Present, and Future.
D Diz,D Wofford,S Schank (1994). Correlation and path-coefficient analyses of seed-yield components in pearl millet x elephantgrass hybrids.
Joshua Guzman,Gwen Recoco,Al Pandi,Jerico Padrones,Jonathan Ignacio (2022). Evaluating workplace safety in the oil and gas industry during the COVID-19 pandemic using occupational health and safety Vulnerability Measure and partial least square Structural Equation Modelling.
Joseph Hair,Jeffrey Risher,Marko Sarstedt,Christian Ringle (2019). When to use and how to report the results of PLS-SEM.
Joseph Hair,Marko Sarstedt,Christian Ringle (2019). Rethinking some of the rethinking of partial least squares.
Al Hamli,Sarah,Abu Elnasr,E Sobaih (2023). Factors Influencing Consumer Behavior towards Online Shopping in Saudi Arabia Amid COVID-19: Implications for E-Businesses Post Pandemic.
Jörg Henseler,Christian Ringle,Marko Sarstedt (2015). A new criterion for assessing discriminant validity in variance-based structural equation modeling.
Catherine Hervé,Etienne Mullet (2009). Age and factors influencing consumer behaviour.
María Ibáñez,Manuel Alonso Dos Santos,Orlando Llanos-Contreras (2022). Transmission of family identity and consumer response: do consumers recognize family firms?.
Rick Jamieson,Hoyle,L Jamieson,R Duvall (2016). Determining the Number of Factors in Exploratory and Confirmatory Factor Analysis.
Bruce Johnson,Joseph Stevens (2001). Exploratory and Confirmatory Factor Analysis of the School Level Environment Questionnaire (SLEQ).
Gunnar Jonsson,Trevor Alleyne,Zenon Kontolemis,David Coe,Neil Ericsson,Jose Fajgenbaum,Michael Nowak,Eric Schalling,Arvind Subramanian,Yougesh Khatri,Carl Walsh,Tarik Yousef,Box Monetary (2001). Inflation, Money Demand, and Purchasing Power Parity in South Africa.
Maria Kanwal,Umar Burki,Raza Ali,Robert Dahlstrom (2022). Systematic review of gender differences and similarities in online consumers’ shopping behavior.
Jeffrey Kouton (2019). Relationship between economic freedom and inclusive growth: a dynamic panel analysis for sub-Saharan African countries.
Heri Kuswanto,Widyan Hadi Pratama,Imam Ahmad (2020). Survey data on students’ online shopping behaviour: A focus on selected university students in Indonesia.
Wenxin Li,Xuantong Lin,Jiani Wu,Wenhan Xue,Junxian Zhang (2021). Impacts Social Media Have on Young Generation and Older Adults.
Pei-Wen Liao,Jun-Yi Hsieh (2017). Does Internet-Based Survey Have More Stable and Unbiased Results than Paper-and-Pencil Survey?.
Lim Ling,Rashad Pei,Yazdanifard (2015). Factors That Influence Impulsive Buying Behavior at Sociolla.
A Misra,Kanishka Goyal,Jyoti Maurya (2022). Impact of Social Media Advertisements on the Dynamics of Online Shopping: A Modeling Study.
Eric Ngai,Spencer Tao,Karen Moon (2015). Social media research: Theories, constructs, and conceptual frameworks.
Cornelia Petroman,Ionela Bidireac,Ioan Petroman,Moisina Sucan,Diana Marin,Bogdan Turc,Iuliana Merce,Elena Constantin (2014). The Impact of Education on the Behaviour of the Consumer of Animal Origin Food Products.
Pour Mohammad,Aylar,Aimee Drolet (2019). The Influence of Age and Time Horizon Perspective on Consumer Behavior.
Kristopher Preacher,Guangjian Zhang,Cheongtag Kim,Gerhard Mels (2013). Choosing the Optimal Number of Factors in Exploratory Factor Analysis: A Model Selection Perspective.
Rupak Rauniar,Greg Rawski,Jei Yang,Ben Johnson (2014). Technology acceptance model (TAM) and social media usage: an empirical study on Facebook.
Asad Rehman,Jamil Syed Ahsan (2016). Influence of Income and Occupation on Consumers' Susceptibility to Reference Group Demands on Brand Choice Decisions.
Mark Richter (2019). INTRODUCTION.
Jagdish Sheth,Banwari Mittal (1996). A Framework for Managing Customer Expectations.
Georgios Sideridis,Panagiotis Simos,Andrew Papanicolaou,Jack Fletcher (2014). Using Structural Equation Modeling to Assess Functional Connectivity in the Brain: Power and Sample Size Considerations.
Patricia Sorce,Victor Perotti,Stanley Widrick (2005). Attitude and age differences in online buying.
Blandina Sramova,Jiri Pavelka (2019). Gender differences and wellbeing values in adolescent online shopping.
Tariku Kolcha,Balango (2020). The Relationship between the Ethiopian Economic Growth and the Decrease in Purchasing Power of Consumers.
Michael Trusov,Anand Bodapati,Randolph Bucklin (2010). Determining Influential Users in Internet Social Networks.
C Velaudham (2019). Marital Differences Towards Consumer Buying Behaviour.
Viswanath Venkatesh,Cheri Speier-Pero,Sebastian Schuetz (2022). Why do people shop online? A comprehensive framework of consumers’ online shopping intentions and behaviors.
Joseph Vithayathil,Majid Dadgar,J Osiri (2020). Social Media Use and Consumer Shopping Preferences.
No ethics committee approval was required for this article type.
Data Availability
Not applicable for this article.
How to Cite This Article
Martha Gaudance. 2026. \u201cEvaluating the Factors that Contribute to the Shopping through Social Media, using Exploratory factor Analysis and Partial Least Square Structural Equation Modeling – Insights from Tanzania\u201d. Global Journal of Human-Social Science - H: Interdisciplinary GJHSS-H Volume 23 (GJHSS Volume 23 Issue H3): .
Explore published articles in an immersive Augmented Reality environment. Our platform converts research papers into interactive 3D books, allowing readers to view and interact with content using AR and VR compatible devices.
Your published article is automatically converted into a realistic 3D book. Flip through pages and read research papers in a more engaging and interactive format.
The purpose of this study is to apply exploratory factor analysis and Partial least square Structural equation to analyze the factors contributing thriving of online shopping through social media in Tanzania. Seven areas of Social and Economic factors, social media behavior factors, Buying and Shopping Behavior, Technology Internet Acceptance factors, Security and Risk assessment factors, Customer care, pre-purchasing, and Post Purchasing service and Cost factors were theoretical conceptualized to construct latent factors. An online questionnaire was used as a data collection tool with 344 participants, and data were analyzed using R software for statistical analysis and Smart PLS software for partial least square modeling. Exploratory factor analysis was used to evaluate variable factor loadings, and variables with more than or equal to 0.3 loadings were used in structural equation modeling.
Our website is actively being updated, and changes may occur frequently. Please clear your browser cache if needed. For feedback or error reporting, please email [email protected]
Thank you for connecting with us. We will respond to you shortly.
Lorem ipsum dolor sit amet, consectetur adipiscing elit. Ut elit tellus, luctus nec ullamcorper mattis, pulvinar dapibus leo.
Evaluating the Factors that Contribute to the Shopping through Social Media, using Exploratory factor Analysis and Partial Least Square Structural Equation Modeling – Insights from Tanzania