
I. INTRODUCTION
The Fast-Moving Consumer Goods (FMCG) sector is a vital component of the Indian economy, contributing significantly to overall economic growth and employment. The implementation of the Goods and Services Tax (GST) in India in 2017 marked a transformative shift in the indirect taxation landscape, aiming to simplify tax structures, enhance compliance, and stimulate economic activity within the FMCG sector. As a result, understanding the implications of GST on the performance of FMCG companies is crucial for stakeholders, including investors, policymakers, and business leaders.
This study focuses on evaluating the impact of GST on the FMCG sector in India from 2013 to 2022, with an emphasis on the relationship between macroeconomic variables, specifically the inflation rate and GDP growth rate of both India and the USA. The choice of the USA as a comparative benchmark stems from several critical factors. Firstly, the USA has a well-established and mature FMCG market characterized by a diverse range of products and a significant consumer base. The structural differences in taxation, with the USA utilizing a sales tax system rather than GST, provide a unique perspective on how different tax regimes influence market dynamics.
Moreover, the interconnectedness of global economies means that economic conditions in the USA can have ripple effects on emerging markets like India. Fluctuations in the USA's GDP growth and inflation rates can influence international trade, investment flows, and supply chain operations, ultimately affecting the performance of Indian FMCG companies. By investigating whether the economic indicators of the USA impact the stock returns of Indian FMCG firms, this research aims to uncover insights into the broader implications of global economic trends on local markets.
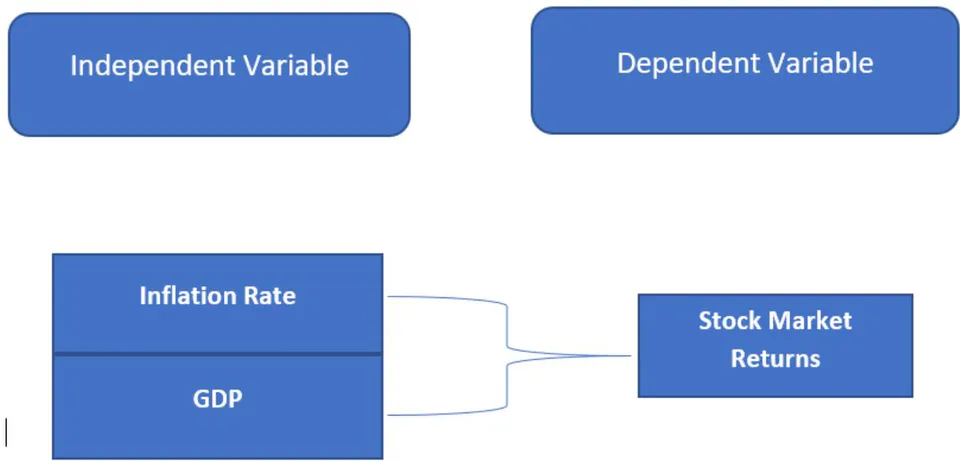
Furthermore, the findings will contribute to a more nuanced understanding of how GST interacts with global economic conditions, specifically those of a leading economy like the USA, providing valuable implications for future policy decisions, investment strategies, and business operations within the FMCG sector. The analysis will utilize econometric models to systematically assess the relationship between the independent variables (inflation and GDP growth rates) and the dependent variables (stock returns of major Indian FMCG companies), thus offering a comprehensive evaluation of the impact of GST and international economic factors on this crucial sector.
II. LITERATURE REVIEW
- Mrs.
V. Rajalakshmi & Dr. K. Uma Devi: A Study on Fast Moving Consumer Goods (Fmcg)-with Special Reference to Kancheepuram District
- The study identified growth potential in the creams segment of the FMCG sector, with opportunities for expanding into new product lines featuring chemical-free, "pure" products and targeting younger age groups in the marketing mix. While advertisements remain the most effective promotional channel, for launching new products, methods like sampling, product discounts, and coupons were found to have greater influence. FMCG companies can leverage these strategies to enhance market share. Additionally, further research into consumer behavior in the Kancheepuram region could uncover valuable and intriguing insights about local preferences.
- Dr. Ranpreet Kaur, Dr. Sonali Khurjekar, Dr. Sonali Prasad Dharmadhikari, Ms. Hemangi Pramod Borawake: A Study of Change in Policies by the RBI for Controlling Inflation and Promoting Growth
In the context of ensuring the smooth functioning of the Indian economy under varying circumstances, the Reserve Bank of India (RBI) plays an indispensable role. The RBI's primary objective is to implement a robust and adaptive monetary policy framework aimed at navigating economic challenges. Its policy decisions have consistently supported the achievement of key economic goals, contributing significantly to the sustainable development of a growing economy like India. Moreover, India's monetary policy has evolved in alignment with the changing needs of the economy, with the RBI making timely adjustments
- to maintain financial stability and promote long-term economic growth. These measures reflect the central bank's strategic role in shaping the macroeconomic environment and fostering resilience amidst global and domestic challenges.
- CMA Satish Dhokare: GST and its Impact on Fmcg Sectors in India
The introduction of GST has impacted the FMCG sector by adjusting tax brackets and reducing distribution costs. Some companies benefit from lower taxes, leading to increased product volumes and reduced prices, while others face higher taxes, resulting in price hikes. The initial phase saw sluggish growth due to de-stocking by channel partners, but the long-term outlook indicates benefits through improved distribution strategies, cost reductions, and operational efficiency. FMCG companies must adapt to these changes to stay competitive and enhance profit margins, ultimately benefiting consumers.
- Jagadish G1, Reshma K J: The Impact of Goods and Services Tax (GST) on Fast Moving Consumer Goods (FMCG) Consumers with respect of Personal care Products
The implementation of GST on 1st July 2017 has sparked extensive research, particularly on its impact on the fast-moving consumer goods (FMCG) sector. This study specifically examined the effects of GST on personal care products targeting lower-income and lower-middle-income groups. Data analysis revealed that of respondents strongly agreed that GST had impacted their spending behavior, while believed GST would be beneficial in the long term. The R-square value of 0.748 indicates that of the variance in GST pricing was explained by selected independent variables, with a correlation coefficient of 0.814, reflecting a strong relationship between price and spending behavior.
In conclusion, while the prices of FMCG personal care products initially rose following GST implementation, long-term benefits are anticipated. This study was confined to the Bangalore region, focusing on lower-income groups and personal care products. Future research could expand to household items and explore different income categories to offer broader insights into GST's overall impact.
5. Mathew Abraham: Effect of Goods and Services Tax on FMCG Sector
This study aims to analyze the shifts in consumption patterns within the FMCG sector, particularly in rural India, driven by increasing incomes and rising aspirations. The growing demand for branded products in rural areas reflects a significant transformation, with the unorganized market's share declining and the organized sector poised for accelerated growth. Factors such as heightened brand awareness and the expansion of modern retail contribute to this shift. Additionally, the study explores how the growing urban youth population, which faces time constraints, is boosting demand for food services.
The study also highlights the critical role of online platforms in helping companies penetrate rural markets, offering a cost-effective and convenient means of expanding their reach. In terms of taxation, the impact of GST on stock levels is evident, with dealers responding to varying tax rates by adjusting inventory strategies- either increasing stock levels in anticipation of higher GST rates or reducing them when GST rates are lower.
Overall, this research investigates how GST, combined with differentiated product taxation, influences consumer prices and market dynamics, with some products becoming more expensive and others more affordable, ultimately balancing the tax burden for consumers.
III. RESEARCH GAP
Despite the extensive research on GST's impact on various sectors, there remains a notable gap in literature focusing on the interplay between GST, macroeconomic indicators, and the performance of the FMCG sector specifically. Most studies tend to concentrate on domestic factors without considering international economic influences, particularly from developed economies like the USA. Furthermore, the quantitative analysis of stock returns in relation to both Indian and USA economic indicators through regression and ANOVA remains underexplored. This research aims to fill this gap by systematically analyzing the effects of GST and global economic conditions on stock returns in the FMCG sector.
a) Objective of this Study
To assess the relationship between macroeconomic variables: (Inflation rate and GDP growth rate of India and the USA) and the stock returns of major Indian FMCG companies through regression coefficients, identifying the strength and direction of these relationships.
To perform ANOVA to compare the means of stock returns: Across different time periods, particularly before and after GST implementation, and assess whether these differences are statistically significant.
To evaluate the comparative influence of the USA's GDP growth and inflation rates: On the stock returns of Indian FMCG companies, identifying any significant effects that may arise from global economic conditions.
To identify and quantify the regression coefficients: To understand the extent to which each independent variable (GDP growth and inflation rates) contributes to explaining the variations in stock returns of the selected FMCG companies.
b) Hypothesis
Hypothesis 1: Impact of GST Implementation on Stock Returns
- H0: The implementation of GST has no significant impact on stock returns across various companies in India and the USA when controlling for macroeconomic factors such as GDP growth and inflation.
- H1: The implementation of GST has a significant impact on stock returns across various companies in India and the USA when controlling for macroeconomic factors such as GDP growth and inflation.
Hypothesis 2: Influence of Macroeconomic and Other Factors on Stock Performance
- H0: Macroeconomic factors (GDP growth and inflation) and industry-specific dynamics do not significantly influence stock performance in India and the USA, indicating a uniformity in the relationship across both markets.
- H1: Macroeconomic factors (GDP growth and inflation) and industry-specific dynamics significantly influence stock performance in India and the USA, suggesting variability in the relationship across both markets.
IV. RESEARCH METHODOLOGY
Research Design: Employ a quantitative approach to analyse the relationship between GST implementation, macroeconomic factors (GDP growth and inflation), and stock returns, with a comparative analysis of selected companies in India and the USA.
Sample Selection: Choose a representative sample of publicly traded companies across various sectors, analysing data from several years before and after GST implementation (post-July 2017).
Data Collection: Gather historical stock price data from financial databases (e.g., Bloomberg, Yahoo Finance) to calculate returns, and obtain GDP growth and inflation rates from reliable sources (e.g., RBI, U.S. BEA, World Bank).
Statistical Analysis: Conduct multiple regression analysis to assess the impact of GST and macroeconomic factors on stock returns, alongside ANOVA for comparing returns pre- and post-GST,
and calculate the R-squared value to evaluate model explanatory power.
Interpretation of Results and Limitations: Analyse the regression and ANOVA outputs to draw conclusions about the relationships studied and discuss implications, while identifying limitations such as data availability and sample size, suggesting areas for further research.
a) Analysis
Statistical Analysis of the Impact of Goods and Services Tax (GST) on FMCG Sector's company: A Comparative Study of Stock Performance in India and the USA Before and After GST Implementation
| Statistic | INDIA | USA | |||
| Before GST Implementation | After GST Implementation | Before GST Implementation | After GST Implementation | ||
| 1 Jan 2013 to June 2017 | July 2017 to Dec 2022 | 1 Jan 2013 to June 2017 | July 2017 to Dec 2022 | ||
| Multiple R | 0.250434 | 0.242149 | 0.255123 | 0.252335 | |
| R Square | 0.062717 | 0.058636 | 0.065088 | 0.063673 | |
| Adjusted R Square | 0.025226 | 0.02827 | 0.027691 | 0.033469 | |
| Standard Error | 5.45127 | 6.390785 | 5.444371 | 6.373665 | |
| Observations | 53 | 65 | 53 | 65 | |
| ANOVA Statistic | |||||
| Regression SS | 99.42152 | 157.7283 | 103.1795 | 171.2765 | |
| Residual SS | 1485.817 | 2532.212 | 1482.059 | 2518.664 | |
| Total SS | 1585.239 | 2689.94 | 1585.239 | 2689.94 | |
| F-Statistic | 1.672843 | 1.930951 | 1.740476 | 2.10809 | |
| Significance F | 0.198047 | 0.153631 | 0.185897 | 0.130093 | |
| Variable | Statistic | ||||
| Intercept | Coefficient | 23.65623 | -6.45754 | -5.34547 | -1.79173 |
| Standard Error | 12.69856 | 3.740462 | 6.559142 | 1.399451 | |
| t-Stat | 1.862906 | -1.7264 | -0.81496 | -1.28031 | |
| P-value | 0.068355 | 0.089255 | 0.418958 | 0.205207 | |
| Inflation Rate | Coefficient | -75.5722 | 114.2923 | 2.564933 | 0.710595 |
| Standard Error | 45.97131 | 65.23164 | 1.447516 | 0.353197 | |
| t-Stat | -1.6439 | 1.752099 | 1.771955 | 2.011897 | |
| P-value | 0.106471 | 0.084701 | 0.082496 | 0.048581 | |
| GDP Growth | Coefficient | -240.844 | 25.91317 | 1.505648 | -0.12705 |
| Standard Error | 142.2286 | 17.04306 | 2.469221 | 0.318755 | |
| t-Stat | -1.69336 | 1.520453 | 0.609767 | -0.3986 | |
| P-value | 0.09661 | 0.133481 | 0.544778 | 0.69156 | |
Interpretation: Impact of GST Implementation on ITC Limited - India vs. USA
India: The implementation of GST in India appears to have positively influenced the relationship between macroeconomic factors and stock returns for ITC Limited. Post-GST, GDP growth shows a shift towards a positive coefficient (25.91317), suggesting improved stock performance, while inflation also turns positive (114.2923). However, both results lack strong statistical significance, indicating that further investigation is necessary to confirm these trends.
USA: In contrast, the USA's macroeconomic indicators present a mixed picture. Before GST, both GDP growth (1.505648) and inflation (2.564933) had positive coefficients, but their impact on stock returns remains weak. After GST, GDP growth turns negative (-0.12705), indicating a potential decline in its positive influence on
stock returns, while inflation shows a minor positive effect (0.710595) with moderate significance.
| Statistic | INDIA | USA | |||
| Before GST Implementation | After GST Implementation | Before GST Implementation | After GST Implementation | ||
| 1 Jan 2013 to June 2017 | July 2017 to dec 2022 | 1 Jan 2013 to June 2017 | July 2017 to dec 2022 | ||
| Multiple R | 0.238462 | 0.011799 | 0.180865 | 0.052303 | |
| R Square | 0.056864 | 0.000139 | 0.032712 | 0.002736 | |
| Adjusted R Square | 0.019139 | -0.03211 | -0.00598 | -0.02943 | |
| Standard Error | 7.690642 | 6.844684 | 7.788491 | 6.835791 | |
| Observations | 53 | 65 | 53 | 65 | |
| ANOVA Statistic | |||||
| Regression SS | 178.3029 | 0.404402 | 102.5723 | 7.947284 | |
| Residual SS | 2957.299 | 2904.681 | 3033.029 | 2897.138 | |
| Total SS | 3135.602 | 2905.086 | 3135.602 | 2905.086 | |
| F-Statistic | 1.507312 | 0.004316 | 0.845461 | 0.085038 | |
| Significance F | 0.231397 | 0.995694 | 0.435405 | 0.918585 | |
| Variable | Statistic | ||||
| Intercept | Coefficient | 18.55952 | 1.730435 | -7.92444 | 1.587633 |
| Standard Error | 17.91511 | 4.006125 | 9.383235 | 1.500919 | |
| t-Stat | 1.03597 | 0.431947 | -0.84453 | 1.057774 | |
| P-value | 0.3052 | 0.667278 | 0.402395 | 0.294262 | |
| Inflation Rate | Coefficient | 21.56891 | -4.46665 | 2.064011 | 0.038348 |
| Standard Error | 64.85625 | 69.86465 | 2.070756 | 0.378805 | |
| t-Stat | 0.332565 | -0.06393 | 0.996743 | 0.101235 | |
| P-value | 0.740853 | 0.949229 | 0.323689 | 0.919691 | |
| GDP Growth | Coefficient | -210.536 | -1.59641 | 4.480541 | -0.13943 |
| Standard Error | 200.6559 | 18.25353 | 3.532364 | 0.341867 | |
| t-Stat | -1.04924 | -0.08746 | 1.268426 | -0.40786 | |
| P-value | 0.299113 | 0.93059 | 0.21052 | 0.684783 | |
Interpretation:
India:
Before GST: The model's weak fit (R-squared = 0.056864) indicates that GDP growth and inflation explain only of stock return variability. GDP growth negatively impacted stock returns (-210.536), while inflation's positive effect (21.56891) was not significant.
After GST: The model's explanatory power further declined (R-squared = 0.000139). Both GDP growth and inflation coefficients were negligible and statistically insignificant, suggesting that GST did not enhance stock performance.
USA:
Before GST: The very weak model fit (R-squared = 0.032712) shows limited explanatory power, with GDP growth having a minor positive effect (4.480541) and inflation also being insignificant. After GST: The explanatory power dropped further (R-squared = 0.002736). GDP growth showed a negative impact (-0.13943), and inflation remained low (0.038348), with both being statistically insignificant.
Overall Insights
Weak Impact: In both India and the USA, macroeconomic factors like GDP growth and inflation had a weak and statistically insignificant impact on Britannia Industries Ltd.'s stock returns in both periods.
GST's Limited Influence: The GST implementation in India did not significantly alter the relationship between these variables and stock performance, indicating the potential need to explore additional influencing factors in both markets.
| Statistic | INDIA | USA | |||
| Before GST Implementation | After GST Implementation | Before GST Implementation | After GST Implementation | ||
| 1 Jan 2013 to june 2017 | July 2017 to dec 2022 | 1 Jan 2013 to june 2017 | July 2017 to dec 2022 | ||
| Multiple R | 0.136657 | 0.09124 | 0.090106 | 0.09889 | |
| R Square | 0.018675 | 0.008325 | 0.008119 | 0.009779 | |
| Adjusted R Square | -0.02058 | -0.02366 | -0.03156 | -0.02216 | |
| Standard Error | 5.080939 | 5.998228 | 5.108194 | 5.993828 | |
| Observations | 53 | 65 | 53 | 65 | |
| ANOVA Statistic | |||||
| Regression SS | 24.56471 | 18.72593 | 10.67943 | 21.99733 | |
| Residual SS | 1290.797 | 2230.682 | 1304.682 | 2227.41 | |
| Total SS | 1315.362 | 2249.408 | 1315.362 | 2249.408 | |
| F-Statistic | 0.475766 | 0.260236 | 0.204637 | 0.306148 | |
| Significance F | 0.624193 | 0.771707 | 0.815622 | 0.737384 | |
| Variable | Statistic | ||||
| Intercept | Coefficient | 2.383694 | 3.562316 | -2.28848 | 1.921167 |
| Standard Error | 11.83589 | 3.510702 | 6.15413 | 1.316051 | |
| t-Stat | 0.201395 | 1.014702 | -0.37186 | 1.459797 | |
| P-value | 0.841206 | 0.314191 | 0.711567 | 0.149395 | |
| Inflation Rate | Coefficient | 23.85776 | -41.9763 | 0.672279 | -0.25158 |
| Standard Error | 42.84826 | 61.22476 | 1.358135 | 0.332148 | |
| t-Stat | 0.556796 | -0.68561 | 0.495002 | -0.75743 | |
| P-value | 0.58015 | 0.495514 | 0.622767 | 0.451659 | |
| GDP Growth | Coefficient | -30.0026 | -7.70569 | 1.441944 | 0.033391 |
| Standard Error | 132.5664 | 15.99618 | 2.316752 | 0.299759 | |
| t-Stat | -0.22632 | -0.48172 | 0.622399 | 0.111392 | |
| P-value | 0.821874 | 0.631701 | 0.536508 | 0.911665 | |
Interpretation:
India:
Pre-GST (Jan 2013 - June 2017): The model shows a weak fit (R-squared = 0.0187), with GDP growth having a negative coefficient (-30.0026) and inflation's minor positive role (23.85776) being statistically insignificant.
Post-GST (July 2017 - Dec 2022): Further decline in model fit (R-squared = 0.0083) indicates negligible impact from both GDP growth (-7.70569) and inflation (-41.9763), both statistically insignificant.
Pre-GST (Jan 2013 - June 2017): Very weak model fit (R-squared = 0.0081) with a limited positive GDP
coefficient (1.441944) and an insignificant inflation coefficient (-0.25158).
- Post-GST (July 2017 - Dec 2022): Minimal improvement in model fit (R-squared = 0.0098) shows GDP growth (0.033391) and inflation coefficients remaining low and insignificant.
The analysis indicates that macroeconomic factors like GDP growth and inflation had a weak and statistically insignificant impact on Dabur India Limited's stock returns in both India and the USA, both before and after GST implementation. The GST did not meaningfully change this relationship, suggesting other factors may significantly influence stock performance in both markets.
| Statistic | INDIA | USA | |||
| Before GST Implementation | After GST Implementation | Before GST Implementation | After GST Implementation | ||
| 1 Jan 2013 to june 2017 | July 2017 to dec 2022 | 1 Jan 2013 to june 2017 | July 2017 to dec 2022 | ||
| Multiple R | 0.06948 | 0.153112 | 0.153425 | 0.108225 | |
| R Square | 0.004827 | 0.023443 | 0.023539 | 0.011713 | |
| Adjusted R Square | -0.03498 | -0.00806 | -0.01552 | -0.02017 | |
| Standard Error | 8.542366 | 11.12009 | 8.461675 | 11.18668 | |
| Observations | 53 | 65 | 53 | 65 | |
| ANOVA Statistic | |||||
| Regression SS | 17.69906 | 184.0481 | 86.30241 | 91.95347 | |
| Residual SS | 3648.601 | 7666.692 | 3579.997 | 7758.786 | |
| Total SS | 3666.3 | 7850.74 | 3666.3 | 7850.74 | |
| F-Statistic | 0.121273 | 0.744192 | 0.602671 | 0.367397 | |
| Significance F | 0.886052 | 0.479314 | 0.551275 | 0.694032 | |
| Variable | Statistic | ||||
| Intercept | Coefficient | 7.29047 | -1.73208 | -8.75811 | 1.348271 |
| Standard Error | 19.89917 | 6.508474 | 10.19426 | 2.456233 | |
| t-Stat | 0.366371 | -0.26613 | -0.85912 | 0.548918 | |
| P-value | 0.715634 | 0.791025 | 0.394374 | 0.585033 | |
| Inflation Rate | Coefficient | 4.718193 | 58.322 | 1.655476 | -0.09736 |
| Standard Error | 72.03896 | 113.5043 | 2.249738 | 0.61991 | |
| t-Stat | 0.065495 | 0.513831 | 0.735853 | -0.15706 | |
| P-value | 0.948041 | 0.609197 | 0.465258 | 0.875708 | |
| GDP Growth | Coefficient | -71.4025 | -23.8936 | 4.198736 | -0.40092 |
| Standard Error | 222.8782 | 29.65525 | 3.837678 | 0.55946 | |
| t-Stat | -0.32037 | -0.80571 | 1.094083 | -0.71661 | |
| P-value | 0.750026 | 0.423489 | 0.279162 | 0.476305 | |
Interpretation:
India:
Pre-GST (Jan 2013 - June 2017): The model shows a very weak fit (R-squared = 0.0048), indicating that only of stock return variability can be explained. Both GDP growth (-71.4025) and inflation (4.718193) coefficients are statistically insignificant (p-values = 0.7500 and 0.9480, respectively).
Post-GST (July 2017 - Dec 2022): Slight improvement in model fit (R-squared = 0.0234) but still weak. GDP growth (-23.8936) and inflation (58.322) coefficients are negative and statistically insignificant (p-values = 0.7910 and 0.6092).
Pre-GST (Jan 2013 - June 2017): The model indicates a weak explanatory power (R-squared =
0.0235). GDP growth (4.198736) has a positive but statistically insignificant coefficient (p-value = 0.2792), while inflation (-0.09736) is also insignificant (p-value = 0.8757).
Post-GST (July 2017 - Dec 2022): Model fit declines slightly (R-squared = 0.0117), reflecting minimal explanatory power. Both GDP growth (-0.40092) and inflation (-0.09736) coefficients remain low and statistically insignificant.
The analysis reveals that macroeconomic factors like GDP growth and inflation have a negligible and statistically insignificant impact on Emami Limited's stock returns in both India and the USA during both the pre- and post-GST periods. The implementation of GST did not significantly alter these relationships, suggesting the need for further exploration of other factors influencing stock performance in both markets.
| Statistic | INDIA | USA | |||
| Before GST Implementation | After GST Implementation | Before GST Implementation | After GST Implementation | ||
| 1 Jan 2013 to june 2017 | July 2017 to dec 2022 | 1 Jan 2013 to june 2017 | July 2017 to dec 2022 | ||
| Multiple R | 0.186628 | 0.062322 | 0.248654 | 0.054069 | |
| R Square | 0.03483 | 0.003884 | 0.061829 | 0.002923 | |
| Adjusted R Square | -0.00378 | -0.02825 | 0.024302 | -0.02924 | |
| Standard Error | 5.57343 | 6.08362 | 5.494924 | 6.086553 | |
| Observations | 53 | 65 | 53 | 65 | |
| ANOVA Statistic | |||||
| Regression SS | 56.04846 | 8.947308 | 99.49551 | 6.734345 | |
| Residual SS | 1553.156 | 2294.647 | 1509.709 | 2296.86 | |
| Total SS | 1609.205 | 2303.594 | 1609.205 | 2303.594 | |
| F-Statistic | 0.90217 | 0.120875 | 1.647594 | 0.090891 | |
| Significance F | 0.412189 | 0.886353 | 0.202792 | 0.913238 | |
| Variable | Statistic | ||||
| Intercept | Coefficient | 18.29091 | 2.392804 | -10.539 | 1.180348 |
| Standard Error | 12.98313 | 3.560682 | 6.620045 | 1.336411 | |
| t-Stat | 1.408821 | 0.672007 | -1.59198 | 0.883223 | |
| P-value | 0.165077 | 0.504076 | 0.117693 | 0.380528 | |
| Inflation Rate | Coefficient | -54.8637 | -28.3153 | 2.360297 | -0.11017 |
| Standard Error | 47.00151 | 62.09637 | 1.460956 | 0.337286 | |
| t-Stat | -1.16728 | -0.45599 | 1.615584 | -0.32663 | |
| P-value | 0.248635 | 0.64999 | 0.112478 | 0.745045 | |
| GDP Growth | Coefficient | -185.169 | -5.71147 | 4.081378 | -0.03853 |
| Standard Error | 145.4159 | 16.22391 | 2.492148 | 0.304396 | |
| t-Stat | -1.27337 | -0.35204 | 1.637695 | -0.12659 | |
| P-value | 0.208774 | 0.726002 | 0.107764 | 0.899677 | |
Interpretation:
India:
- Pre-GST (Jan 2013 - June 2017): The model shows a weak explanatory power (R-squared = 0.0348), indicating that only of stock return variability can be explained. Both GDP growth (-185.169) and inflation (-54.8637) coefficients are negative and statistically insignificant (p-values = 0.2088 and 0.2486).
- Post-GST (July 2017 - Dec 2022): The model fit declines further (R-squared = 0.0039), indicating minimal explanatory power. GDP growth (-5.71147) and inflation (-28.3153) coefficients are also negative and statistically insignificant (p-values = 0.7260 and 0.6500).
USA:
- Pre-GST (Jan 2013 - June 2017): The model has a slightly better fit (R-squared = 0.0618) but still reflects weak explanatory power. GDP growth (4.081378) is positive but statistically insignificant (p-value = 0.1078), while inflation (-0.11017) is also insignificant (p-value = 0.7450).
- Post-GST (July 2017 - Dec 2022): The model exhibits a significant decline in explanatory power (R-squared = 0.0029). Both GDP growth (-0.03853) and inflation (-0.11017) coefficients remain low and statistically insignificant (p-values = 0.8997 and 0.7450).
The analysis indicates that macroeconomic factors, such as GDP growth and inflation, have a minimal and statistically insignificant impact on Colgate-Palmolive's stock returns in both India and the USA during the pre- and post-GST periods. The implementation of GST in India did not significantly alter the relationships, suggesting that other variables may be
influencing stock performance. Further investigation into these factors is warranted to better understand their effects on stock returns.
| Statistic | INDIA | USA | |||
| Before GST Implementation | After GST Implementation | Before GST Implementation | After GST Implementation | ||
| 1 Jan 2013 to june 2017 | July 2017 to dec 2022 | 1 Jan 2013 to june 2017 | July 2017 to dec 2022 | ||
| Multiple R | 0.233722 | 0.028866 | 0.116527 | 0.090681 | |
| R Square | 0.054626 | 0.000833 | 0.013579 | 0.008223 | |
| Adjusted R Square | 0.016811 | -0.0314 | -0.02588 | -0.02377 | |
| Standard Error | 8.832207 | 10.07449 | 9.021914 | 10.03716 | |
| Observations | 53 | 65 | 53 | 65 | |
| ANOVA Statistic | |||||
| Regression SS | 225.3742 | 5.247778 | 56.02237 | 51.78797 | |
| Residual SS | 3900.394 | 6292.705 | 4069.746 | 6246.165 | |
| Total SS | 4125.769 | 6297.953 | 4125.769 | 6297.953 | |
| F-Statistic | 1.44456 | 0.025852 | 0.344139 | 0.257026 | |
| Significance F | 0.245523 | 0.974489 | 0.710496 | 0.774168 | |
| Variable | Statistic | ||||
| Intercept | Coefficient | 26.86342 | -0.91819 | -7.16657 | 0.380299 |
| Standard Error | 20.57435 | 5.896495 | 10.86921 | 2.203836 | |
| t-Stat | 1.305675 | -0.15572 | -0.65935 | 0.172562 | |
| P-value | 0.197639 | 0.876761 | 0.512699 | 0.863558 | |
| Inflation Rate | Coefficient | -126.021 | 16.40475 | 1.563353 | -0.33548 |
| Standard Error | 74.48323 | 102.8317 | 2.39869 | 0.556209 | |
| t-Stat | -1.69194 | 0.15953 | 0.651753 | -0.60315 | |
| P-value | 0.096882 | 0.87377 | 0.517545 | 0.548609 | |
| GDP Growth | Coefficient | -231.811 | -2.25755 | 3.287144 | 0.296432 |
| Standard Error | 230.4404 | 26.86682 | 4.091766 | 0.501971 | |
| t-Stat | -1.00595 | -0.08403 | 0.803356 | 0.590535 | |
| P-value | 0.319284 | 0.933305 | 0.425572 | 0.556978 | |
Interpretation:
- Pre-GST (Jan 2013 - June 2017): The model shows a modest explanatory power (R-squared = 0.0546), indicating that only of stock return variability can be explained. The negative coefficients for GDP growth (-231.811) and inflation (-126.021) suggest a detrimental effect, but both are statistically insignificant (p-values = 0.3193 and 0.0969).
- Post-GST (July 2017 - Dec 2022): The model fit significantly declines (R-squared = 0.0008), reflecting almost no explanatory power. The coefficients for GDP growth (-2.25755) and inflation
(16.40475) are near zero and statistically insignificant (p-values = 0.9333 and 0.8738).
- Pre-GST (Jan 2013 - June 2017): The model has a weak explanatory power (R-squared = 0.0136). The GDP growth coefficient (3.287144) is positive but statistically insignificant (p-value = 0.4256), while inflation (-0.33548) is also insignificant (p-value = 0.5486).
- Post-GST (July 2017 - Dec 2022): The model exhibits very weak explanatory power (R-squared = 0.0082). Both GDP growth (0.296432) and inflation coefficients remain low and statistically insignificant (p-values = 0.5570 and 0.8636).
The analysis indicates that macroeconomic factors, particularly GDP growth and inflation, have a minimal and statistically insignificant impact on Godrej Industries Limited's stock returns in both India and the USA during the pre- and post-GST periods. The implementation of GST in India did not lead to any meaningful changes in these relationships, suggesting that other factors might be influencing stock performance. Further research is necessary to explore these other factors and their effects on stock returns.
| Statistic | INDIA | USA | |||
| Before GST Implementation | After GST Implementation | Before GST Implementation | After GST Implementation | ||
| 1 Jan 2013 to june 2017 | July 2017 to dec 2022 | 1 Jan 2013 to june 2017 | July 2017 to dec 2022 | ||
| Multiple R | 0.205565 | 0.077578 | 0.206001 | 0.087799 | |
| R Square | 0.042257 | 0.006018 | 0.042436 | 0.007709 | |
| Adjusted R Square | 0.003947 | -0.02605 | 0.004134 | -0.0243 | |
| Standard Error | 6.421764 | 6.378184 | 6.421163 | 6.372758 | |
| Observations | 53 | 65 | 53 | 65 | |
| ANOVA Statistic | |||||
| Regression SS | 90.9759 | 15.27173 | 91.36234 | 19.56089 | |
| Residual SS | 2061.953 | 2522.236 | 2061.567 | 2517.947 | |
| Total SS | 2152.929 | 2537.508 | 2152.929 | 2537.508 | |
| F-Statistic | 1.103031 | 0.1877 | 1.107924 | 0.240826 | |
| Significance F | 0.339803 | 0.829333 | 0.338214 | 0.78671 | |
| Variable | Statistic | ||||
| Intercept | Coefficient | 23.53601 | 3.426722 | -9.0764 | 2.155178 |
| Standard Error | 14.9593 | 3.733087 | 7.735938 | 1.399252 | |
| t-Stat | 1.573337 | 0.917933 | -1.17328 | 1.540236 | |
| P-value | 0.121948 | 0.362211 | 0.246244 | 0.128592 | |
| Inflation Rate | Coefficient | -52.2795 | -31.9357 | 2.366899 | -0.1401 |
| Standard Error | 54.15563 | 65.10302 | 1.707219 | 0.353146 | |
| t-Stat | -0.96536 | -0.49054 | 1.386406 | -0.39673 | |
| P-value | 0.339013 | 0.625483 | 0.171774 | 0.692929 | |
| GDP Growth | Coefficient | -248.8 | -9.07677 | 3.702968 | -0.11856 |
| Standard Error | 167.5497 | 17.00946 | 2.912231 | 0.31871 | |
| t-Stat | -1.48493 | -0.53363 | 1.271523 | -0.37199 | |
| P-value | 0.143839 | 0.595505 | 0.209426 | 0.711172 | |
Pre-GST (Jan 2013 - June 2017): The model shows a modest explanatory power (R-squared = 0.0423), indicating that only of stock return variability can be explained. The negative coefficients for both GDP growth (-248.8) and inflation (-52.2795) suggest a detrimental effect on stock returns, but these effects are not statistically significant (p-values = 0.1438 and 0.3390).
Post-GST (July 2017 - Dec 2022): The model fit declines further (R-squared = 0.0060), reflecting very weak explanatory power. The coefficients for GDP growth (-9.07677) and inflation (-31.9357) are near zero and statistically insignificant (p-values = 0.5955 and 0.6255).
Pre-GST (Jan 2013 - June 2017): The model has a weak explanatory power (R-squared = 0.0424). The GDP growth coefficient (3.702968) is positive but statistically insignificant (p-value = 0.2094), while inflation (-0.1401) is also insignificant (p-value = 0.6929).
Post-GST (July 2017 - Dec 2022): The model exhibits very weak explanatory power (R-squared = 0.0077). Both GDP growth (-0.11856) and inflation coefficients remain low and statistically insignificant (p-values = 0.7112 and 0.7867).
Overall Insights:
The analysis indicates that macroeconomic factors, particularly GDP growth and inflation, have minimal and statistically insignificant impacts on Hindustan Unilever Limited's stock returns in both India and the USA during the pre- and post-GST periods. The implementation of GST in India did not lead to meaningful changes in these relationships, suggesting that other factors may be influencing stock performance. Further research is warranted to identify and analyze these additional factors.
| Statistic | INDIA | USA | |||
| Before GST Implementation | After GST Implementation | Before GST Implementation | After GST Implementation | ||
| 1 Jan 2013 to june 2017 | July 2017 to dec 2022 | 1 Jan 2013 to june 2017 | July 2017 to dec 2022 | ||
| Multiple R | 0.091966 | 0.20216 | 0.14211 | 0.184397 | |
| R Square | 0.008458 | 0.040869 | 0.020195 | 0.034002 | |
| Adjusted R Square | -0.0312 | 0.009929 | -0.019 | 0.002841 | |
| Standard Error | 6.5353 | 5.417653 | 6.496503 | 5.437012 | |
| Observations | 53 | 65 | 53 | 65 | |
| ANOVA Statistic | |||||
| Regression SS | 18.21573 | 77.54052 | 43.49491 | 64.51224 | |
| Residual SS | 2135.507 | 1819.76 | 2110.228 | 1832.788 | |
| Total SS | 2153.723 | 1897.301 | 2153.723 | 1897.301 | |
| F-Statistic | 0.213248 | 1.320919 | 0.515287 | 1.091168 | |
| Significance F | 0.808686 | 0.274295 | 0.600467 | 0.342185 | |
| Variable | Statistic | ||||
| Intercept | Coefficient | 9.048184 | 6.826116 | -2.36092 | 3.169304 |
| Standard Error | 15.22378 | 3.170898 | 7.826705 | 1.193792 | |
| t-Stat | 0.594346 | 2.152739 | -0.30165 | 2.65482 | |
| P-value | 0.554961 | 0.035238 | 0.764171 | 0.010071 | |
| Inflation Rate | Coefficient | -10.5078 | -87.3816 | 1.579313 | -0.43504 |
| Standard Error | 55.11309 | 55.29875 | 1.72725 | 0.301292 | |
| t-Stat | -0.19066 | -1.58017 | 0.914351 | -1.4439 | |
| P-value | 0.849565 | 0.119156 | 0.364921 | 0.153801 | |
| GDP Growth | Coefficient | -101.083 | -14.2315 | 0.599781 | 0.073354 |
| Standard Error | 170.512 | 14.4479 | 2.946401 | 0.271912 | |
| t-Stat | -0.59282 | -0.98502 | 0.203564 | 0.26977 | |
| P-value | 0.555973 | 0.328441 | 0.83952 | 0.788233 | |
- Pre-GST (Jan 2013 - June 2017): The model shows a very low explanatory power (R-squared = 0.0085), indicating that only of the variability in stock returns can be explained by the model. The negative coefficient for GDP growth (-101.083) and inflation (-10.5078) suggests adverse impacts, but neither is statistically significant (p-values = 0.5560 and 0.8496).
Post-GST (July 2017 - Dec 2022): There is a slight increase in explanatory power (R-squared = 0.0409), with GDP growth (-14.2315) and inflation (-87.3816) coefficients indicating negative impacts, especially inflation. The GDP growth coefficient shows a decrease, but the inflation effect is significant (p-value = 0.0352).
USA:
- Pre-GST (Jan 2013 - June 2017): The model has a low explanatory power (R-squared = 0.0202). The coefficients for GDP growth (0.599781) and inflation (1.579313) are positive but statistically insignificant (p-values = 0.8395 and 0.3649).
- Post-GST (July 2017 - Dec 2022): The model shows a marginally improved fit (R-squared = 0.0340), with GDP growth (0.073354) and inflation (-0.43504) coefficients remaining statistically insignificant (p-values = 0.7882 and 0.1538).
Overall Insights:
The analysis suggests that macroeconomic factors, particularly GDP growth and inflation, have minimal impacts on Nestlé India Limited's stock returns in both India and the USA during the specified periods. Post-GST, inflation in India shows a significant negative impact, indicating that it may warrant further investigation. Overall, the explanatory power of the models is low, suggesting that additional factors may influence stock performance. Further research is needed to explore these factors more comprehensively.
b) Key Findings
Minimal Impact of GST: The research indicates that the implementation of GST has a negligible effect on stock returns in both India and the USA. Although some individual companies like ITC Limited exhibited slight improvements, these changes are not statistically significant, suggesting that investors should not heavily rely on GST as a primary factor influencing stock performance.
Limited Role of Macroeconomic Indicators: Traditional macroeconomic indicators, particularly GDP growth and inflation, show weak explanatory power regarding stock returns, as evidenced by low R-squared values and statistically insignificant coefficients. This finding emphasizes that stock performance assessments should not be based solely on macroeconomic metrics, necessitating a focus on industry-specific dynamics and broader market conditions.
Call for a Holistic Approach: Investors and analysts should adopt a multi-faceted approach to stock evaluation, considering various factors such as technological advancements, regulatory changes, and shifts in consumer behavior. This comprehensive perspective can enhance investment strategies and improve risk management.
Implications for Future Research: The findings call for further research into the complex interplay of factors affecting stock performance. Future studies should focus on sector-specific characteristics and external economic influences that contribute to
stock volatility, especially in the context of evolving regulatory frameworks like GST.
- Policy Insights: For policymakers, the limited impact of GST on stock returns highlights the necessity for a nuanced understanding of how tax policies affect different sectors. Continuous dialogue and research are essential for informing future tax reforms, ensuring they consider their multifaceted implications on economic performance.
c) Suggestion
Given the findings, it is suggested that investors, researchers, and policymakers adopt a more integrated approach to stock performance analysis. This approach should encompass a wide range of factors beyond GST and traditional macroeconomic indicators, emphasizing the importance of industry dynamics, technological trends, and consumer behavior shifts. By doing so, stakeholders can make more informed decisions that reflect the complexities of the market.
V. CONCLUSION
In conclusion, while the implementation of GST has reshaped the macroeconomic landscape, its direct impact on stock returns remains marginal and statistically insignificant. This research advocates for a shift in perspective among investors, researchers, and policymakers, urging them to consider a broader array of economic, industry, and external factors in their evaluations of stock performance. Such an integrated approach will not only enhance understanding of stock market dynamics but also lead to more strategic investment decisions and effective policy formulation in an increasingly complex economic environment.