
I. INTRODUCTION
Metro rail transits have created a milestone in transportation and communication advancements (Kurniawati, 2023). After London first launched an electric train in 1890 (Duffy, 2003), high-speed trains have become an undeniable option for technological, commercial, and socioeconomic success over the passage of time (Fowler, 2023). They also added that many developed nations like Italy, France, Germany, Poland, Netherlands, Spain, and Switzerland have invested in metro or high-speed railways to achieve far-reaching benefits in various aspects.
Australian government emphasized greatly on high-speed rail (HRS) services for urban development (Gharehbaghi et al., 2020).
The country, China has introduced the world's largest high-speed rail (HSR) network expecting that it would have a substantial impact on the country's mobility, accessibility, socioeconomic development, and other factors, particularly at the megaregional level (Chen, 2013).
The Indian metros have most remarkably contributed to the diversion of a significant portion of current passenger traffic from road to the METs and consequently reduced the number of buses, passenger cars, and other vehicles carrying passengers on its roadways (Bhagyalakshmi & Vasudevan, 2020).
Bangladesh has introduced its first metro rail journey which will contribute to making Bangladesh smart from various perspectives (The Daily Star, 28th December 2022). It also added that this mass rapid transit (MRT) will reduce traffic congestion and air pollution in Dhaka city. It will enable people to move quickly from one place to another.
Decision-makers must urgently redirect urban transportation development toward a more sustainable future in order to build greener and more livable cities. The socio-economic development of a country greatly depends on transportation whereas in developing countries, it's critical where accessibility and mobility are commonly hampered by a lack of adequate levels of transportation services (Luke & Heyns, 2020). The management of public transportation quality has become a focus of in-depth study in recent years (Majumdar et al., 2020).
Establishing a sustainable urban transportation system necessitates an all-encompassing integrated approach to decision-making with the shared objective of strengthening an inexpensive, environmentally friendly, people-oriented, and commercially viable transportation system (Goldman & Gorham, 2006). Congestion is a great problem because it has a domino effect on other factors that affect the economy, the environment, and society including poor air quality, traffic accidents, travel delays, and public health issues where metro rail services could be a better alternative to other public transports (Majumdar et al., 2020).
It is crucial for managers and authorities to ensure higher levels of customer satisfaction (CS) in public transportation (PT) systems (Buran & Ercek,
2022). To evaluate how efficient and sufficient their services are, PT providers must assess the performance of their service quality (SQ) (Girma et al., 2022). Therefore, public organizations must look into what components of service enhancements may be implemented to both improve the experience of present consumers and draw in new ones.
Additionally, the performance evaluation is required to take into account the top activities, stakeholder concerns, current and projected demand trends, and unmet service needs (Kuo et al., 2023). Appraisal of performance helps to ensure better economic performance, links- interactions and output from service providers and improves organizational SQ (Chan et al., 2023). Thus, the availability of adequate public transportation becomes more and more important as cities in developing countries expand, especially in big cities with rapid population expansion.
According to Kilibarda et al. (2016), and Ricardian to et al., (2023), the quality of service delivery, which is regarded as the most crucial factor in both consumer attitudes and customer loyalty, has a considerable impact on customer satisfaction. The first step in improving customer satisfaction is to assess the grade of the services offered (Hamid & Baharudin, 2023). As a result, it is critical for public entities to create service quality standards in order to provide high-quality services that go above and beyond what is expected of them by the public (Dullah et al., 2023). Measuring customer satisfaction with public transportation services is essential in both transportation research and practice (Anburuvel et al., 2022). To boost the infrastructure, facilities, services, and demand for public transportation, transit authorities must understand how well passenger expectations have been satisfied. Customer surveys are significant because they provide transportation agencies with useful information on the specific areas with which customers are satisfied and dissatisfied (Rong et al., 2022; Sukhov et al., 2022). Service frequency, on-time performance, travel speed, and vehicle cleanliness are found to have the greatest effects on customer satisfaction in the tendered regions (Singh & Kathuria, 2023; Wong et al., 2023). According to Deb et al. (2022), waiting time, cleanliness, and comfort are the three most crucial PT qualities. The most commonly mentioned attributes of transportation services are dependability, frequency, capacity, cost, cleanliness, comfort, security, crew, knowledge, and ticketing system (Anburuvel et al., 2022; Farazi et al., 2022). Reliability, frequency, price, speed, access, comfort, and convenience also found themselves significant in rapid transit networks (Kepaptsoglou et al., 2020).
Measuring commuters' satisfaction with MRT service has got significant attention in different developed and developing countries (Gharehbaghi et al., 2020; Chen, 2013; Bhagyalakshmi & Vasudevan,
2020). But, as we know the MRT service is very new in our country (The Daily Star, December 2022) that's why this sector still has not been conducted significant research. The authors believe that this research work is going to be the first research on MRT in Bangladesh. Still, no research on this sector has been published. There is some news that passengers are facing various problems in getting metro rail services (The Business Standard, December 2022). Along with that lax security at metro rail stations is raising concerns (Dhaka Tribune, December 2022). The researchers made an effort to investigate the service quality characteristics and the resulting passenger satisfaction with Bangladesh's metro rail services in light of these research gaps. Alike other countries, the evaluation of the service quality of metro rail or mass rapid transit can minimize the service gaps and ensure the expected service levels from MRT. It may also help the concerned authorities to design good quality services for similar mega projects that are now under construction.
This raises the following research question; What are the effects of service quality dimensions on passengers' satisfaction with MRT in Bangladesh? This study aims to investigate the service quality of MRT from the users' perspective using the widely accepted SERVQUAL model. This study aims to-
Following this Introduction, the rest of the parts of this research outline are as follows: the second section presents the pertinent literature, conceptual framework, and hypotheses development. Next, the study details the methodology. Subsequently, the fourth section depicts the findings and discussion on service quality dimensions and passenger satisfaction. Finally, the fifth section highlights the theoretical and practical implications, noting some limitations and signifying actions for imminent research.
II. LITERATURE REVIEW
Congestion at stations, relatively high-priced tickets, and the inconvenience of using transportation facilities that connect to other modes of transportation rank as the three main causes of customers' unhappiness with MRT (Iqbal et al., 2022; Reyes et al., 2023). All countries need transportation for their social and economic growth, but developing countries are especially dependent on it because mobility and accessibility are usually restricted due to insufficient levels of transportation services (Luke & Heyns, 2020). The development of the transportation infrastructure is essential to the development of wealthy communities (Fantin & Appadurai, 2022). Congestion, along with related issues including pollution, accidents, dwindling public transportation, and environmental deterioration, characterizes the city's transportation system today, demanding a premium on rapid and safe transport (Pojani & Stead, 2015).
Now, passengers are more dependent on the most recent metro rail steering system in the current circumstances because of machine life and modern growth. This approach performs a better job of assisting people to plan their day and get them to their destination on time (Yen et al., 2023). Considering the significance of metro transportation, it must offer high levels of comfort to both staff and passengers (Ding & Hou, 2022). Almost 3.08 million people use the community train and the network of mass rapid transit lines every day to connect the city's center and its surroundings (Liu et al., 2023). Given that the majority of respondents use metro services to reach their destination, a better and more efficient system of ticketing and information about train arrival and departure should be required. Also, it is crucial to boost security during the trip to eliminate petty crime and other offenses (Nguyen & Pojani, 2023; Leoni & Owen, 2023). Evaluating the factors that diminish commuter satisfaction and steadfastly measuring them have become requirements for MRT organizations in an effort to implement the necessary improvements based on commuters' knowledge and needs (Bhagyalakshmi & Vasudevan, 2020). Customer satisfaction and service quality dimensions have typically drawn researchers' attention, according to the researchers and one of the fundamental approaches to improving customer satisfaction is the ongoing improvement of service quality dimensions (Hoo et al., 2023; Sama et al., 2023; Hamzah et al., 2023).
Customer satisfaction is an evaluation of the requirements and expectations of the products and services each service provider provides (Li et al., 2023). Customer satisfaction refers to a good fit between customers' expectations of a particular product or item and the performance of that product (Nugroho & Wang, 2023; Moussaoui et al., 2023; Naz et al., 2023). Customer satisfaction and service quality in the travel industry are strongly positively correlated (Aseres and Sira, 2020; Ong et al., 2023). Measuring customer satisfaction is viewed as a crucial activity in marketing programs, and from an organizational viewpoint, customer satisfaction is portrayed as a prominent aspect (Ibrahim & Aljarah, 2023; Jahmani et al., 2023; Wisitnorapatt & Sirirat, 2023). Another study's findings demonstrated that customers' satisfaction with public transportation services was positively impacted by both the quality of traditional services and e-services, but e-services satisfy customers more (Khairani & Hati, 2017; Prawesti et al., 2023; Awal et al., 2023).
Customer satisfaction has a positive effect on actual behavior related to the use of technological services (Camilleri et al., 2023; Park & Kim, 2013). The integration of customer satisfaction has shifted business philosophies from product orientation to customer orientation due to technological advancement (Qalati et al., 2020). They also concluded that it is quite difficult to retain customer happiness while addressing all of their needs. Additionally, "customer satisfaction" has been often employed in business literature, especially in the fields of marketing and finance (Yi & Natarajan, 2018). According to previous research (Alshihre et al., 2023; Das et al., 2023; Luo et al., 2023; Prasidi et al., 2023; Wahyudi, 2023), customer satisfaction may therefore be utilized to close the gap between the needs and expectations of customers' products and services. According to Tsabita & Djamaludin (2023), research in Indonesia, the level of service provided had a positive effect on how satisfied customers were with transportation services. A key tactic for increasing customer satisfaction is to continuously enhance the service quality aspects (Abdujalilovich & Ibroximjon, 2023; Chao et al., 2023; Hawa et al., 2023). The factors affecting customer satisfaction and service quality, according to academics, have historically made for intriguing research topics (Shyju et al., 2023; Venkatakrishnan et al., 2023; Drouet et al., 2023).
The number of research areas using the SERVQUAL model to explore passengers' satisfaction with Metro Rails is not significant in nature. Along with that, as this is a totally new service area in Bangladesh, there has not been much research done yet. To bridge this research gap, researchers have been interested in conducting research in this area.
III. CONCEPTUAL FRAMEWORK AND HYPOTHESIS DEVELOPMENT
a) The use of SERVQUAL and UTAUT2 (Two factors from UTAUT2-Hedonic Motivation and Price Value) in assessing Service Quality
The method most often used to measure consumer perceptions of quality in the service industry is SERVQUAL, which was created by Parasuraman et al. (1985, 1988, 1991). Over the past 50 years, research on service excellence and customer satisfaction has generated a significant amount of literature (Aseres and Sira, 2020). The value of service quality in the travel sector was discussed in earlier literature, which has become increasingly popular in academic study circles (Cheunkamon et al., 2023; Chikazhe et al., 2023; Dai et al., 2023; Ofe & Sandberg, 2023). A company should generally aim to narrow the gap between perceptions and expectations in industries like e-commerce (Jauhar et al., 2023; Li et al., 2023; Lindell & Nilsson, 2023; Wang et al., 2023; Wu & Dong, 2023), banking (Ananda et al., 2023; Imran et al., 2023; Manohar et al., 2023; Senanu & Narteh, 2023), healthcare (Crafford et al., 2023; Nie et al., 2023; Panagou et al., 2023; Syed et al., 2023), hospitality (Akarsu et al., 2023; Huang, 2023; Mariani & Borghi, 2023; McCartney & Kwok, 2023; Mehta et al., 2023), education (Keane et al., 2023; Pujol et al., 2023; Rouse et al., 2023; Twyford & Dean, 2023; Wan et al., 2023), and so forth. The RAILQUAL, a modified SERVQUAL (Gopal et al., 2023; Li et al., 2023; Mishra & Panda, 2023), uses different aspects instead of five to measure customers' impressions of the service's quality (comfort, security, and convenience are added to the original dimensions).
Urban transportation studies by Guzman et al. (2023) and Drabicki et al. (2023) respectively examined the gap between perceived and expected quality among urban transportation stakeholders commuting within metropolitan areas. The SERVQUAL model has been identified by Amankwah et al. (2023) as one of the influential models in service quality. The model, also known as the RATER Model, was developed by the researchers to address five constructs (Ravichandran et al., 2010). They are responsiveness, empathy, tangibility, assurance, and reliability. To increase customer satisfaction, service providers should make sure that the expected and perceived services are consistent (Ahrholdt et al., 2017). The results of the prior study also suggested that, depending on the type of research being conducted by the researchers, the SERVQUAL model would need to be updated (Ali & Raza, 2017). Examining the critical and determining elements that influence Bangladesh's MRT service consumers' happiness is the goal of this study. It has done this by placing a strong emphasis on tangibility, dependability, responsiveness, assurance, and empathy. Despite the above-mentioned research, there are not many applications in the field of public transportation, and (to our knowledge) no attempt has yet been made to create a framework for the service quality measurement using a SERVQUAL technique in MRT service in Bangladesh. Bridging this gap could be quite beneficial for MRT agencies, especially those that are willing to comply with the standards as stated.
Kalinc et al. (2019) found that the UTAUT2 model is a significant tool to measure customer satisfaction. This model has found its ability to predict the intention and customer satisfaction toward a market offering (Barbosa et al., 2021). In the public transportation sector, the UTAUT2 model determines the performance levels of service providers and users' satisfaction critically (Korkmaz et al., 2023). Venkatesh et al. (2012) added three independent constructs- hedonic motivation, price value, and habit- with this model. Hedonic motivation and price value are the salient variables in ensuring commuters' satisfaction (Chopdar et al., 2022). Keeping relevance with these findings, the researchers have taken price value and hedonic motivation along with SERVQUAL model dimensions to evaluate the satisfaction of MRT passengers.
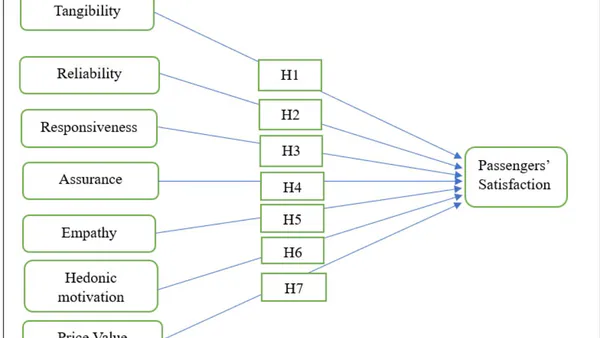
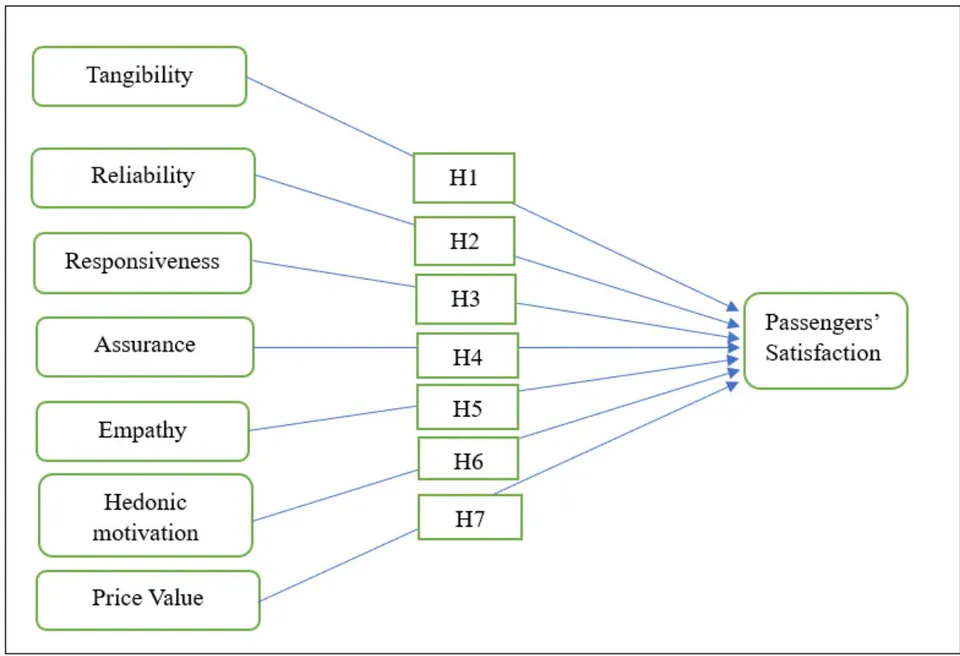
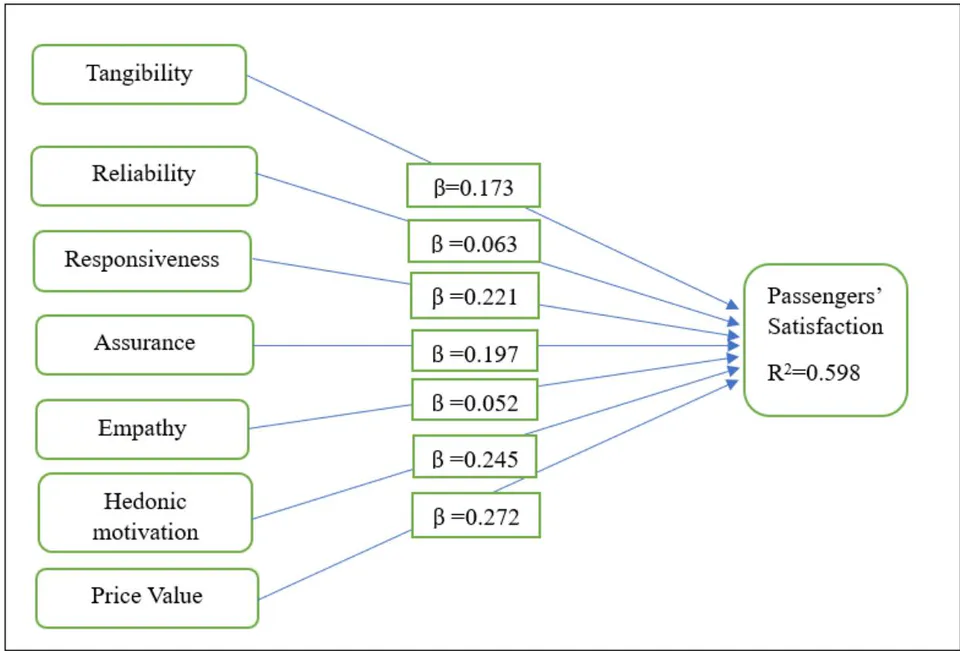
The following constructs are included in the study model in Figure 1:
b) Hypotheses Development
i. Tangibility
The tangibility dimension of service consists of the physical appearance of the service facility, the equipment, the personnel, and the communication resources. For example, the appearance of MRT, public phones, stations, and so on (Parasuraman et al., 1988; Thomson et al., 2023). The service facility's physical attributes, as well as its equipment, personnel, and communication resources, are considered tangibles (Parasuraman et al., 1988; Hamzah et al., 2023). For example, the installation of public phones, metro stations, etc. The study team by Arteaga-Sanchez et al. (2020) found evidence from the transit industry that tangibility has a big impact on consumer satisfaction. The researchers focused on Indian transit services when they discussed service quality and customer satisfaction in the context of South Asia (Singh & Kathuria, 2023). The tangible elements of services have a positive impact on customer satisfaction, and the results of a recent study show that the degree to which the service quality component is tangible has a significant impact on customer satisfaction (Aseres & Sira, 2020; Hussein, 2016; Al-Mhasnah et al., 2018). Therefore, this study assumes that the tangibility dimension will affect the passengers' satisfaction with MRT. Thus, the following hypothesis has been drawn.
H1: Tangibility has a positive relationship with passengers' MRT satisfaction.
ii. Reliability
The ability of the service provider to deliver the promised service precisely and dependably is referred to as reliability (Parasuraman et al., 1988; Vasanthi et al., 2023) for instance, metros are punctual in their arrival and departure (Jayanthi et al., 2023). Octavines et al. (2023) assert that reliability is a representation of a customer's dedication, promptness, and relevance in obtaining satisfaction. Some recent studies found that the reliability attribute has the greatest impact on customer satisfaction (Christian et al., 2023; Luo et al., 2023; Shamsudin et al., 2023). The reliability construct has a positive and significant impact on customer satisfaction, according to similar findings (Conceicao et al., 2023; Cebeci et al., 2023). Eventually, the authors perceive that the reliability dimension will affect the passengers' satisfaction with MRT. Hence, the following hypothesis is as follows-
H2: Reliability has a positive relationship with passengers' MRT satisfaction.
iii. Responsiveness
Response time, as demonstrated by having service employees on call (Awasthi et al., 2011), demonstrates how flexible and timely the service provider is (Parasuraman et al., 1988). In several studies on transportation services, it was found that responsiveness had a significant and positive impact on customer satisfaction (Arteaga-Sanchez et al., 2020; Ong et al., 2023; Wong et al., 2023; Luo et al., 2023). The timeliness component of outstanding service has a considerable and direct impact on customer satisfaction, according to recent research (Hamzah et al., 2023; Wurtz & Sandkuhl, 2023). Additionally, Sama et al. (2023) discovered that responsiveness is a crucial element of the quality of e-services that affects client satisfaction. In light of these findings, this study posits that the authors perceive that the responsiveness dimension will affect the passengers' satisfaction with MRT. So, the hypothesis is designed as below-
H3: Responsiveness has a positive relationship with passengers' MRT satisfaction.
iv. Assurance
The ability of the employees to convey trust, faith, and confidence as well as their knowledge and manners are all aspects of assurance (Parasuraman et al., 1988; Vasanthi et al., 2023; Ong et al., 2023). An emergency circumstance can call for staff communication, for instance. Experts have highlighted assurance as one of the crucial components of transport systems, especially when individuals are traveling with random people (Tengilimoglu et al., 2023; Parmar & James, 2023; Moulahi et al., 2023). According to Zhang & Jennings (2023), customer satisfaction with transportation services is significantly impacted by assurance. Additionally, earlier studies have shown that the assurance construct of the service quality dimension significantly and favorably affects customer satisfaction (Al-Mhasnah et al., 2018). Consumer happiness is significantly impacted by worries about privacy and security, according to a study by Zhu et al. (2023) and Khan et al. (2023). Hence, this study supposes that the assurance dimension will affect the passengers' satisfaction with MRT. Accordingly, the hypothesis here is-
H4: Assurance has a positive relationship with passengers' MRT satisfaction.
v. Empathy
Empathy implies thoughtfulness on the part of staff members and customized customer care. Drouet et al. (2023) and Parasuraman et al. (1988) both mention the assistance of seniors or youngsters in getting through toll gates to access the station. The empathy construct of the service quality dimension has been shown to have a large and positive impact on customer satisfaction (Biswas & Verma, 2023; Jasin et al., 2023). In a study on service quality and customer satisfaction in the context of an online cab company, researchers found that empathy had a substantial impact on consumer satisfaction (Panggabean & Yohana, 2023). Arteaga-Sanchez et al. (2020) assert that empathy has a favorable and significant effect on customer satisfaction in the transportation industry. The results of the earlier studies similarly demonstrated a significant relationship between customer satisfaction and the empathy construct of service quality (Ananda et al., 2023; Putta, 2023; Jou et al., 2023). Thus, the authors daresay that the empathy dimension will affect the passengers' satisfaction with MRT.
Therefore, the proposed hypothesis is as follows
H5: Empathy has a positive relationship with passengers' MRT satisfaction.
vi. Hedonic Motivation
Hedonic motivation is the idea that people get certain benefits from an event they find enjoyable, pleasurable, multisensory, emotional, and thrilling (Hirschman and Holbrook 1982: Venkatesh et al., 2012). Offering all passengers this kind of experience is one of the foundational elements of transport and destination services (Chen et al., 2023; Maas et al., 2023).
Researchers, professionals, and governments are becoming intensely interested in the relationships between transportation and hedonistic motivation (Osman et al., 2023; Cui & Aulton, 2023; Parvatiyar & Sheth, 2023). It's also added that in order to increase traffic security as well as commuters' satisfaction for all, stakeholders need accurate methods for assessing the emotional states of travelers. Hedonic motivation measurement has been usefully used in the travel domain. The researcher also mentioned that the Satisfaction with Travel Scale (STS) is linked to Hedonic motivations, which are connected to core affect (emotions) and cognitive evaluation. In line with this, Liu et al. (2021) commented that the subject of mobility and transportation has become increasingly interesting in studies that link commuting and hedonic well-being. They discovered that certain combinations of personality traits and modes of transportation are connected to the commuter experience and hedonic well-being. Since these studies used hedonic motivation to identify passengers' satisfaction and found the results positive, the authors also assume that hedonic motivation will positively affect the satisfaction of passengers with MRT. Therefore, the following hypothesis has been drawn.
H6: Hedonic motivation has a positive relationship with passengers' MRT satisfaction.
vii. Price Value
The price value (PV) is defined as the customers' cognitive tradeoff between the perceived benefits and monetary cost of using a product or service (Venkatesh et al., 2012). PV significantly affects passengers' intentions to consume autonomous public transport services (Korkmaz et al., 2022). Additionally, in the case of Uber-based transportation systems, PV is regarded as a significant construct in instigating the passengers' intentions to take ride-sharing services (Soares et al., 2020). The MRT must ensure a good price value tradeoff to satisfy the passengers significantly (Yan et al., 2023). Furthermore, it creates a significant user perception around the relationships between benefits and costs leading to adopt travel services (García de Blanes Sebastián et al., 2023). As the PV construct has been used in identifying passengers' satisfaction in these earlier studies, the authors perceive that this construct will also positively affect the satisfaction of passengers with MRT in Bangladesh. Hence, the authors posit that:
H7: Price value has a positive relationship with passengers' MRT satisfaction.
IV. METHODOLOGY
a) Research Design
The previous studies adopted both qualitative (Satranarakun & Kraiwanit, 2023; Nxele, 2021; Cascajo et al., 2019; Balasubramani et al., 2020; Bergman et al., 2019;) and quantitative (Zhang et al., 2023; Yin et al., 2022; Kumar & Cao, 2021; Dong et al., 2021; Kumar & Cao, 2023) approaches to conduct their studies on metro rail transit and other public transportation. Since we have collected numerical data, we have analyzed our data using a quantitative approach (Bauer et al., 2021). In addition to that, a quantitative method focuses on validating or rejecting predefined research hypotheses (Mcleod, 2019). Qualitative research focuses on in-depth interviews, statements, and "how" type questions whereas quantitative research focuses on collecting and analyzing numerical data (Brazen et al., 2021). Therefore, we have conducted quantitative research.
b) Measurement
The UTAUT2 model (Venkatesh et al., 2012) and the SERVQUAL model (Parasuraman et al., 1985) were taken into consideration when designing the study's variables and creating the questionnaire to gauge MRT passengers' satisfaction. The study's questionnaire was prepared after examining the expert's advice and recommendations, the passengers' perspectives, and a pretest. Tangibility, dependability, assurance, empathy, and responsiveness are SERVQUAL model aspects that are also referred to as RATER model characteristics (Ziyad et al., 2020). The remaining variables, hedonic motivation, and price value are obtained from Venkatesh et al. (2012). According to the specifications of the setting of the current investigation, every element from these models has been altered. The researchers employed a five-point Likert scale. The scale ranges from strongly disagree (1) to strongly agree (5). On the basis of these scales, every construct has been examined. The questionnaire is broken up into two sections, the first of which covers all of the items and constructs and the second of which covers the sociodemographic characteristics of the chosen respondents.
The Partial Least Square (PLS)-structural equation modeling method was employed by the researchers in this study, which was carried out using SmartPLS software 3.0. This statistical technique is used to assess the constructs' discriminant validity, path coefficients, validity and reliability of the constructs, and structural model. In the case of exploratory research, researchers regularly used SmartPLS, especially in the marketing sector (Hair et al., 2012).
c) Target Population
As the study context is the MRT in Bangladesh, the target population is the users of MRT in Bangladesh. The persons who traveled by MRT frequently are mainly targeted in this study since they could scale in-depth insights and experience with MRT. The population of this study includes people who have traveled by the MRT several times.
d) Questionnaire Design and Pretesting
The data was collected by an in-person survey using a closed-ended structured questionnaire using a five-point Likert scale ranging from strongly disagree (1) to strongly agree (5)(Emerson, 2015). Furthermore, the respondents' confidentiality and anonymity were protected by the researchers. The researchers provided an introduction before the survey began and explained why it was being conducted. 290 questionnaires were supplied to the respondents where 39 questionnaires were found incomplete in getting actual responses. 251 surveys were found to be full and suitable for statistical analysis, and the response rate of met the benchmark or general guideline for the Smart PLS procedures, according to the researchers (Urbach & Ahlemann, 2010). We collected our data from March to October 2023 (eight months). For better and more insightful understanding we prepared the questionnaire in both English and Bengali languages.
Before beginning the primary data collection process, we conducted two rounds of pre-testing on our questionnaire. Two subject-matter experts extensively examined the study questionnaire's first draft. In the following stage, 30 MRT users pretested the questionnaire. We moderated our questionnaire accordingly. Finally, 24 items that are the best fit for the questionnaire were retained.
e) Sample Size, Sample Technique, and Data Collection
This study has focused on a field survey to evaluate the satisfaction of MRT passengers in Bangladesh. Dhaka city has been taken into consideration as the MRT is functioning only in this city in the country. The sample-to-variable ratio should not be less than 5:1, even though a 15:1 or 20:1 ratio is preferred (Hair et al., 2018; Liao et al., 2016; Yeoh et al., 2016; Forsberg & Rantala, 2020). In light of these references, the minimum sample size in our study should be . The non-probability convenience sampling technique is considered by the researchers to obtain the needed sample size for the research (Aseres & Sira, 2020). The convenient sampling technique is appropriate when a large sample size is required for generalization (Tsiotsou, 2015) and it makes the data collection quick and easier (Senyo & Osabutey, 2020). The authors collected data from MRT stations, their waiting areas, and inside the metro rails.
The confidence level in this study's methodology is set at . Information for secondary sources was gamthered from prior publications, including papers, books, online sources, and others. Despite this, the researchers chose a deductive method over an inductive one because the study's base was an established theory of the Bangladeshi context (Ziyad et al., 2020). SMART-PLS 3.00 was used to evaluate the data.
V. FINDINGS AND ANALYSIS
a) Demographic Profile
From table-01, it's been seen that most of the respondents are male passengers (74.90%) followed by female passengers (25.10%). Furthermore, the majority of the respondents (38.25%) fall in the age group of 24-30 years followed by 31-37 aged respondents (29.89%). Besides, the majority portion of the respondents (43.03%) are undergraduates followed by graduates (34.26%). The income range of the majority of respondents (39.44%) is between 20,001- 30,000 takaper month. In addition to that the most significant number of respondents (56.97%) have used MRT services more than 10 times in their journeys.
| Variables | N | Percentage (%) |
| Gender | ||
| Male | 188 | 74.90 |
| Female | 63 | 25.10 |
| Ages (in terms of years) | ||
| 17-23 | 39 | 15.54 |
| 24-30 | 96 | 38.25 |
| 31-37 | 75 | 29.89 |
| 38-44 | 23 | 9.16 |
| 45- Above | 18 | 7.16 |
| Level of Education | ||
| Up to Secondary | 12 | 4.78 |
| Higher Secondary | 11 | 4.38 |
| Undergraduate | 108 | 43.03 |
| Graduate | 86 | 34.26 |
| Postgraduate | 34 | 13.55 |
| Income (BDT)-Monthly | ||
| Below 20,000 | 79 | 31.48 |
| 20,001- 30,000 | 99 | 39.44 |
| 30,001- 40,000 | 62 | 24.70 |
| Above 40,001 | 11 | 4.38 |
| Frequency of using MRT | ||
| 4-6 times | 40 | 15.94 |
| 7-9 times | 68 | 27.09 |
| More than 10 times | 143 | 56.97 |
b) Measurement Model
All of the suggested constructs have Cronbach's alpha and composite reliability values of more than 0.7, which is considered acceptable (Fornell & Larcker, 1981; Table-02), which is in the range. The outer loadings value should be equal to or more than 0.7 but in exploratory research values of 0.5 to 0.6 even could be acceptable (Chin, 1998). Cronbach's alpha is used to measure the internal consistency of the data. The range of acceptable Cronbach's alpha values, in this case, is from 0.701` to 0.842. Given that the values are more than 0.7, this study complies with the requirements for outer loadings. Cronbach's alpha and composite reliability have both been examined in order to guarantee the data's dependability. To further confirm the accuracy of the data, the average variance extracted (AVE) has been carried out. The values of CR and AVE should be equal to or higher than 0.7 and 0.5, respectively (Hair et al., 2014). These parameters are easily met by our results, which provide a strong fit of the data dependability with CR values ranging from 0.832 to 0.894 and AVE values ranging from 0.524 to 0.683. Because all VIFs values are below the required levels, which are lower than 5 (Hair et al., 2014), the results of this investigation are within acceptable ranges.
| Constructs | Items | Items' Loadings | VIFs | Cronbach's Alpha (β) | Composite Reliability | AVE | R2 |
| Tangibility | TAN1 | 0.866 | 1.240 | 0.842 | 0.894 | 0.683 | - |
| TAN2 | 0.778 | 1.165 | |||||
| TAN3 | 0.798 | 1.212 | |||||
| Reliability | REL1 | 0.708 | 1.585 | 0.772 | 0.845 | 0.598. | - |
| REL2 | 0.776 | 1.086 | |||||
| REL3 | 0.752 | 1.132 | |||||
| Responsiveness | RES1 | 0.850 | 1.171 | 0.832 | 0.876 | 0.658 | - |
| RES2 | 0.792 | 1.280 | |||||
| RES3 | 0.766 | 1.152 | |||||
| Assurance | ASS1 | 0.852 | 1.217 | 0.753 | 0.856 | 0.667 | - |
| ASS2 | 0.781 | 1.470 | |||||
| ASS3 | 0.825 | 1.483 | |||||
| Empathy | EMP1 | 0.748 | 1.530 | 0.801 | 0.860 | 0.567 | - |
| EMP2 | 0.725 | 1.479 | |||||
| EMP3 | 0.780 | 1.720 | |||||
| Hedonic Motivation | HMV1 | 0.727 | 1.248 | 0.701 | 0.832 | 0.623 | - |
| HMV2 | 0.853 | 1.199 | |||||
| HMV3 | 0.795 | 1.433 | |||||
| Price Value | PRV1 | 0.720 | 1.410 | 0.765 | 0.851 | 0.524 | - |
| PRV2 | 0.748 | 1.488 | |||||
| PRV3 | 0.820 | 1.004 | |||||
| Satisfaction | STF1 | 0.784 | 1.349 | 0.787 | 0.863 | 0.609 | 0.598 |
| STF2 | 0.817 | 1.278 | |||||
| STF3 | 0.758 | 1.260 | |||||
| Variance explained by Harman's single factor test 31.59% | |||||||
c) Common Method Variance
The researchers conducted Harman's single-factor test on the questionnaire items to check whether there is any common method variance (CMV). The 30 survey questions were placed onto a single factor. The additional factor was not a component of our study framework; it was just added for analytical purposes and eliminated subsequently. According to Table 01, fewer than of the variance could be explained by a common component, indicating that the items did not contain CMV (Eichhorn, 2014). Along with this, Hong et al. (2023) claimed that if the VIFs results are equal to or lower than 3.3 (see Table 02), then we could recommend that the findings are not affected by the common method bias.
The researchers have applied Fornell & Larcker's (1981) discriminant validity test to measure the relationships or validity among the proposed constructs in this study. The discriminant validity is thoroughly examined by taking into account the square roots of AVE values and the correlations between the components (Chiu & Wang, 2008). The statistics for discriminant validity in table-03 demonstrate that convergent validity and discriminant validity both support the correlations between the components.
| Constructs | TAN | REL | RES | ASS | EMP | HMV | PRV | STF |
| TAN | 0.826 | |||||||
| REL | 0.524 | 0.773 | ||||||
| RES | 0.702 | 0.632 | 0.811 | |||||
| ASS | 0.602 | 0.612 | 0.547 | 0.817 | ||||
| EMP | 0.532 | 0.628 | 0.562 | 0.621 | 0.753 | |||
| HMV | 0.585 | 0.590 | 0.502 | 0.627 | 0.657 | 0.789 | ||
| PRV | 0.487 | 0.387 | 0.423 | 0.469 | 0.579 | 0.425 | 0.724 | |
| STF | 0.295 | 0.192 | 0.217 | 0.287 | 0.325 | 0.388 | 0.393 | 0.780 |
In addition to figuring out the correlation matrix and the square root of the average variance extracted, Henseler et al. (2015) recommended checking the discriminant validity with the help of the HTMT ratio. Having the value of the HTMT ratio less than 0.90 or
0.85 alludes that the discriminant validity accepted all constructs (Azeem et al., 2021). We have all HTMT ratios under these cut-off values. The values of the HTMT ratio in Table 04 are presented below.
| Constructs | TAN | REL | RES | ASS | EMP | HMV | PRV | STF |
| TAN | ||||||||
| REL | 0.684 | |||||||
| RES | 0.770 | 0.654 | ||||||
| ASS | 0.688 | 0.600 | 0.778 | |||||
| EMP | 0.736 | 0.520 | 0.660 | 0.632 | ||||
| HMV | 0.787 | 0.790 | 0.685 | 0.452 | 0.777 | |||
| PRV | 0.802 | 0.604 | 0.748 | 0.632 | 0.780 | 0.524 | ||
| STF | 0.584 | 0.768 | 0.669 | 0.784 | 0.776 | 0.452 | 0.762 |
d) Structural Model
To test the hypotheses in this study, the researchers have conducted path analysis. Along with that, Reddy et al. (2023) mentioned that the cause-and-effect relationships are figured out by the path coefficients. Additionally, to analyze the structural model, the path coefficients and the coefficients of the determination are taken into consideration (Akbari et al., 2021). The value of (0.598) indicates that the passengers of MRT are getting satisfaction from their MRT journeys considering seven dimensions. A moderate association has been found, and the findings are supported by the value of . The path coefficients are tested using the effective 1000 bootstrapping resampling method (Chin, 2009). From the findings, we found five hypotheses are supported out of seven. Empathy and reliability do not have significantly positive impacts on passengers' satisfaction , , and , , respectively). But the other constructs have significantly positive impacts on passengers' satisfaction (Tangibility has , , ; Responsiveness has , , ; Assurance has , , ; Hedonic Motivation has ,
; Price Value has .
| Direct relationships | Path Coefficients (β) | Sample Mean | Standard Deviation | T Statistics | P Values | Comments Supported (✓) Not Supported (✗) |
| H1: TAN -> STF | 0.173 | 0.198 | 0.081 | 1.967 | 0.003 | ✓ |
| H2: REL -> STF | 0.063 | 0.011 | 0.073 | 0.060 | 0.450 | ✗ |
| H3: RES -> STF | 0.221 | 0.258 | 0.065 | 2.124 | 0.007 | ✓ |
| H4: ASS -> STF | 0.197 | 0.186 | 0.085 | 2.506 | 0.001 | ✓ |
| H5: EMP -> STF | 0.052 | 0.013 | 0.071 | 0.556 | 0.354 | ✗ |
| H6: HMV -> STF | 0.245 | 0.297 | 0.055 | 2.274 | 0.042 | ✓ |
| H7: PRV -> STF | 0.272 | 0.221 | 0.076 | 2.802 | 0.032 | ✓ |
VI. DISCUSSION
The study tends to evaluate the satisfaction of MRT passengers in Bangladesh. Using five dimensions of SERVQUAL and two dimensions of UTAUT2 the study has designed the methodology to explore the satisfaction of MRT passengers. The dimensions are tangibility, reliability, responsiveness, assurance, empathy, hedonic motivation, and price value. Among the dimensions, reliability, and empathy do not significantly affect passengers' MRT satisfaction. All other dimensions positively affect the MRT satisfaction of the passengers.
Responsiveness, hedonic motivation, and price value have the most significant impacts on the satisfaction of MRT passengers. In this study, tangibility positively affects the satisfaction of the passengers which is also supported by Arteaga-Sanchez et al. (2020) in the case of the transit industry. Shah (2021) also found tangibility as a driver to satisfy the passengers' satisfaction in the Indian transit perspective. In other studies, tangibility was identified to have a direct, significant, and positive impact on customer satisfaction (Al-Mhasnah et al., 2018). Therefore, the policymakers of MRT should focus on ensuring the creation and maintenance of tangibility to reap the benefits of MRT through passengers' satisfaction. Reliability in this study is found to have insignificant effects on passengers' satisfaction whereas the other studies found it as the significant one (Aseres & Sira, 2020; Horsu and Yeboah, 2015). The authorized stakeholders should focus on generating a significant level of reliability to ensure a higher level of passenger satisfaction with MRT. According to our study, responsiveness has a considerable favorable effect on passengers' satisfaction. This finding is also supported by earlier studies (Alarifi & Husain, 2023; Arteaga-Sanchez et al., 2020; Al-Shamayleh et al., 2015; Prentice, 2023). The authority should maintain strong responsiveness to ensure the continuous satisfaction of the MRT passengers. Assurance also positively affects passengers' satisfaction in this study and is supported by several other studies (Khan et al., 2023; Bhojak et al., 2023; Kautish et al., 2022). Therefore, the assurance should get considerable attention to make the passengers satisfied enough. Though several prior studies had found empathy as a significant construct in passengers' satisfaction (Al-Mhasnah et al., 2018; Arteaga-Sanchez et al., 2020)) whereas in our studies, it's found to be insignificant in passengers' satisfaction. So, to make it more productive, the authority should milk this construct. Hedonic motivation has got special attention from the passengers of MRT. This construct has also a significant positive impact on their MRT satisfaction. Our findings are also strongly supported by other previous studies (Liu et al., 2021;Tomas, 2022; Zhang et al., 2022). Finally, the price value in this study has the maximum path coefficient values and most significantly impacts passengers' satisfaction with MRT services. The passengers have been getting a good value for their prices. Our results are supported by a number of earlier studies (Korkmaz et al., 2022; Paramita et al., 2018; Soares et al., 2020; Zhang et al., 2022; Zhou et al., 2022). Policymakers should keep their constant eyes on making the prices more reasonable to ensure the durability of the passengers' satisfaction with MRT in Bangladesh.
VII. THEORETICAL IMPLICATIONS
This study can contribute new knowledge to the MRT sector. It can also input new insights into the literature on the SERVQUAL model dimensions and the dimensions of UTAUT2 in exploring the satisfaction of passengers with MRT services. Hedonic motivation and the price value can be viewed as important characteristics in addition to SERVQUAL model dimensions including tangibility, reliability, responsiveness, assurance, and empathy to measure the satisfaction of customers in a particular field, especially in the MRT sector of Bangladesh. The proposed theoretical model in this study has a significant impact on evaluating passengers' MRT satisfaction. The price value and hedonic motivation constructs have significant positive impacts on passengers' satisfaction. In contrast, the empathy and reliability constructs exert insignificant impacts on passengers' satisfaction.
VIII. PRACTICAL IMPLICATIONS
The policymakers in the MRT area could get significant insights to design and improve the levels of service and passenger satisfaction. They can improve the level of service dimensions to ensure the satisfaction levels of MRT passengers in a great manner. Responsiveness, hedonic motivation, and price value are found the most significant factors in ensuring passengers' satisfaction with MRT. So, the policymakers can shed light on these areas. In addition to that the empathy and reliability dimensions should get special attention so that the passengers would get them as the significant dimensions in the case of satisfaction with the MRT experience. As the tangibility has a significant impact on passengers' MRT satisfaction the authority must add more features to make the service tangible enough and it should be maintained with care. The assurance should also be important to satisfy the MRT passengers. The MRT sector can take the initiative to excel in service quality by emphasizing all SERVQUAL factors and two factors namely price value and hedonic motivation from UTAUT2. This sector can train its personnel to interact with passengers, keep track of its progress, and examine passengers' reviews to scale a good quality of its service. The authority should maintain better tangibility in its service from various perspectives. The MRT service sector should also create reliability in the service areas. Passengers must embrace responsiveness while traveling through the MRT. This sector must design assurance and empathy as per the expectations of the passengers and maintain for constantly. To ensure a pleasant journey, the sector could focus on building a concrete Hedonic motivation with MRT. Additionally, as price and satisfaction stand together, this sector must provide a significant dive into the price factor.
IX. CONCLUSION
MRT service in Bangladesh is completely a new addition to the transportation field. Evaluating its service quality and passengers' satisfaction could find out the required areas to improve and offer the best possible services to the passengers. The concerned authority also can utilize the insights from this study in other related mega projects in Bangladesh. Using SERVQUAL and UTAUT2 model's dimensions could generate a deep understanding of user satisfaction levels and ensure proper service from the concerned authority. It's significant to evaluate the satisfaction of MRT passengers in Bangladesh because it's completely a new milestone in the transportation field of Bangladesh and no prior research is conducted in this field.
X. LIMITATIONS AND FUTURE RESEARCH DIRECTION
This study has met some limitations from different perspectives. The respondents are mostly young and students at different levels. So, the specification in the demographic profile might generate new findings. The non probability convenient sampling technique has been taken into consideration to collect the data where other sampling techniques might make different results. Furthermore, a few MRT stations have not yet been launched. Passenger satisfaction ratings may be the same, lower, or higher than the current figures when all stations are operating at full capacity. In addition to that, a bigger sample size might be a better representative of all passengers traveling through the MRT frequently. Along with the proposed constructs, further research could be conducted considering several other reasonable constructs. Finally, the continuous usage intention of passengers' MRT service might be another study area.