
I. INTRODUCTION
Coconut oil is vegetable oil derived from the kernel of cocos nucifera Linn. It can be extracted either by mechanical pressing or with solid-liquid extraction using solvent (Sriti et al., 2011; Amin et al., 2010). According to Amin et al. (2010) and Liauw et al. (2008), extraction using solvent gives a higher yield and less turbid oil. Oil obtained from this process can be used as edible oil, production of cosmetics and biodiesel among many other industrial uses.
Whereas coconut oil has been used mainly for edible and cosmetic purposes, transformers have traditionally used mineral oils and synthetic esters for insulation purposes. Such oils serve the dual purpose of temperature regulation (cooling) and insulation in these transformers (Rouabeh et al., 2019; Muhamad and Razali, 2016). As an insulating medium, the oil fills the pores in fibrous insulation as well as the gaps between the coil conductors, windings and tanks, thereby increasing the dielectric strength of insulation. Also, these transformers generate an enormous amount of heat in the winding process which is transmitted by the oil to the radiators by convection; oil from the radiators in-turn cools the winding. Other important properties of transformer oils include: dielectric strength, flash point, pour point, viscosity, specific gravity etc (Mahanta and Laskar, 2017; Tanteh and Al-Liddawi, 2014). The oil demand of these transformers, in terms of quality, is relative to their rating.
Works on the kinetics of the oil extraction process include: Sulaiman et al. (2013), Saxena et al. (2011), Perez et al. (2011), Topallar and Geçgel (2010), Amarni and Kadi (2010), Sayyar et al. (2009), Liauw et al. (2008), Meziare et al. (2008), Mani et al. (2007), Kumoro and Hassan (2006), among others. Kinetic study of solid-liquid extraction depends on the nature of the oil and solvent, temperature of the process, particle size, reaction time and the ratio of the solid to the solvent (Sayyar et al. 2009).
There is a need to seek an alternative to these commercial-grade transformer oils based on considerations for cost, environmental factors and other physicochemical properties. However, to qualify as good grade transformer oil, the aforementioned properties have to be considered. Understanding the extraction process of this grade of oil obtained from coconut also implies having an adequate knowledge of the kinetics of the process, evaluation of the intra-particle mass transfer and the thermodynamic data parameter estimation. This study, therefore, seeks to evaluate these parameters for the extraction of transformer-grade oil from coconut seed.
II. MATERIALS AND METHODS
a) Materials
The thirteen (13) coconut seeds used in this study were purchased from a local market at Choba, Rivers state (4°47'21" N, 6°59'55"E) Nigeria. Equipment used include: manual blender, mantle heater, water bath, round bottom flasks, marked tape, filter paper, soxhlet extractor, thermostat and beaker. Reagents used were obtained as pure grade namely: n-hexane (95%w/w) and phosphoric acid (85%w/w) supplied by Analar and distilled water.
b) Method
This work involved the following processes: sample pre-treatment, oil extraction and purification, physico-chemical property analysis, kinetic and thermodynamic data parameter estimation and analysis.
These processes were carried out using the American Society for Testing and Materials (ASTM) procedures under the laboratory conditions.
c) Sample Preparation & Pre-treatment
The pretreatment process for the coconut oil extraction involved the removal of the coconut shell, shredding, washing and drying of the coconut seed. The drying was done using an oven drier operated at a temperature of C for 3 days. The dried seed were further crushed using a blender so as to improve its surface area to ensure good contact of the particles with the solvent. The coconut particles were then stored in clean dry containers.
d) Extraction Process
The extraction process was conducted using a 1000 ml capacity laboratory soxhlet extractor. Heating of the solvent was done using a heating mantle while the cold water circulating was controlled by water bath. The crushed coconut seed (copra) was weighed, wrapped in a filter paper and placed inside the thimble of the soxhlet extractor while the extraction liquid (n-hexane) was placed inside a reservoir (round bottom flask) for about half its volume. On application of heat from the heating mantle, the liquid vapourized and further condensed in the condenser before coming in contact with the wrapped sample inside the thimble of soxhlet extractor to extract components of solid sample.
The oil was extracted into the extraction compartment through the thimble into the siphon tube and emptied into the reservoir tank. The content of the thimble was exposed to fresh liquid extractant (n-hexane) from the condenser and the cycle repeated during which the solvent boiled off from the miscella. The extraction process was conducted at varying time (1 to 8 hrs) and temperature (70 – 80 °C).
The solvent was recovered through a distillation process after equilibrium had been reached, so as to separate the solvent from the extract (miscella) using a Liebig condenser. Based on boiling point difference, the solvent was distilled off and recovered in a flask while the oil was left behind in the reservoir (round bottom flask) as the residue.
The oil yield from the coconut was determined by the correlation of Equation 1.
e) Oil Refining and Purification
The extracted oil was refined through degumming, bleaching, and de-odourization processes.
i. Degumming: This was done by adding 0.03% phosphoric acid ( ) inside the oil and the mixture heated at a temperature of 90 °C for 10 mins using a Jenway hotplate with a magnetic stirrer (model 1000) after which the phospholipids were removed after settling.
ii. Bleaching: The degummed oil was bleached using bleaching earth (Tonsil 267FF) at temperature of 120 °C over 1 hr period. Filtration of the degummed oil was done using Whats mann filter paper after which the filtered sample was further heated to a temperature of 130 °C for 90 mins.
iii. Deodourization: The bleached oil was deodourized by heating it at a temperature of for 10 minutes in a water bath.
f) Physico-Chemical Property Analyses
i. Moisture Content Analysis
A clean 250cm beaker was dried and weighed after which 5ml of coconut oil was added into it, and the setup re-weighed. The sample was heated for 5 mins in a microwave oven at 60 °C to evaporate as much water as possible and re-weighed after evaporation. It was thereafter placed in a desiccator for cooling and re-weighed. This moisture content was obtained as a ratio of the weight of the oil samples before and after heating using Equation 2.
ii. Flash Point
Using the Pensky-Marten's closed test cup method and a 0 to thermometer, the flash point of the oil was evaluated. Following standard laboratory procedures, the oil samples were placed in the well or barrel of the tester and a thermometer inserted into the cup to monitor the temperature of the setup which was heated at temperature intervals of . The fumes released from the oil were tested with a lighted match stick and the temperature at which the fumes support the flame for about 2 seconds was determined as the flash point.
iii. Pour Point
The pour point test was carried out in the laboratory using ice bath, test tubes and a negative thermometer. The apparatus was set up in such a way that the test tubes containing the oil samples were stuck in the ice bath with the flow characteristics monitored periodically at temperature intervals of C. The temperature at which the oil sample starts to coagulate was determined as pour point. (1)
iv. Density
This test was carried out on the oil samples using a known weight of a 50 ml volume density bottle from where the oil density was derived through calculation.
v. Viscosity
This was carried out using the NDJ-5S digital Rotary viscometer and the DBK minimag stirrer/heater. The oil samples were placed in the beaker on a heater t = time (s)
and the piston of the viscometer placed inside the beaker. Readings were taken from the viscometer over the range of 45-60 °C. Temperature was monitored using a thermometer placed at the side of the beaker and the viscometer.
vi. Dielectric Strength
To evaluate this, 50 g of the extracted oil samples were placed in two 500 ml constant fixed volume beakers which were then placed in an SW19 model of Foster transformer (serial no 91ZA925) manufactured in London. Current was passed through the oil samples until the circuit breaker unit went off indicating the stoppage of current. The voltage at which this occurred indicates the voltage dielectric strength. This process was repeated for three more times while noting the results at each stage.
g) Kinetic and Thermodynamic Data Parameter Estimation
i. Kinetic Model Development
A kinetic model of the process was developed for the oil extraction process with the assumption that its rate is controlled by the mass transfer of the oil from the crushed coconut particles (solute) to the liquid (solvent) in accordance with the works of Saxena et al. (2011) and Amin et al. (2010).
Using the correlation of Liauw et al. (2008) the mass transfer rate can be expressed as follows:
Where
A = surface area of the mass transfer process ( )
= initial (equilibrium) concentration of coconut particles in the solvent (g/m )
= concentration of coconut particles in the solvent at time, t (g/m )
Also, since the extraction was conducted in a batch process, the volume was constant throughout the experiment hence Equation 3 becomes
Where:
Taking the natural log of both sides
The model for the determination of the mass of coconut oil at any given time is Equation 18
Expressing this in terms of Yield (Y)
Where
= yield of coconut oil at time t (g)
The non-linear regression analyses of the kinetic model were done using Microsoft Office Excel Solver (2007). The regression analysis was performed to estimate the model parameters. The coefficient of determination , root mean square error (RMSE), the reduced chi-square , and standard error of the estimate (SEE) were used as the primary criteria to assess the goodness of the fit of the models to the experimental data. Moreover, the coefficient of determination serves as a measure of the closeness of the relation to linearity, whereas the RMSE, , and SEE shows the deviation between the predicted and experimental values. Hence, the best model exhibits the highest , whereas the RMSE, and SEE approaches to zero. The statistical parameters were calculated using the following equations:
Where
n = the number of experimental data points z = the number of constants in the model.
The scatter plot was equally used to assess the appropriateness of the extraction model at different temperatures. This was obtained by plotting the errors against the experimental yield ratio from the correlation:
ii. Intra-particle mass transfer
The intra-particle mass transfer for the oil extraction process was evaluated with the Thiele modulus with the assumption that this process was neither controlled nor limited by internal diffusion. To determine the Thiele modulus, the effective diffusivity ( ) was evaluated using Fick's law from the slope of the plot of the Yield vs Time using the correlation presented by Pinelo et al. (2006) as shown in Equation 25
Where:
Y = yield of oil (g) r = radius of coconut particle (mm)
= effective diffusivity ( ) t = time (s)
From the plot of In Y vs t, the slope and intercept were given by Equations 26 and 27 respectively.
The effective diffusivity value obtained from the slope was used to evaluate the intra-particle mass transfer during the oil extraction process using the Thiele modulus as expressed by Equation 28
Where:
iii. Thermodynamic data parameter estimation
At each experiment, the change in equilibrium constant was determined using the linear form of the Van't Hoff equation shown in Equation 29 from where thermodynamic parameters of enthalpy change , entropy change , and Free energy were also evaluated.
Plot of vs 1/T is effective in estimating the change in enthalpy, total energy, and entropy or amount of disorder of a chemical reaction (Scott, 2016).
Where: = equilibrium constant for the oil yield at different temperatures, R = ideal gas constant, = standard enthalpy change of the extraction process (KJ/mol), = standard entropy change of the system (KJ/mol)
Where: = the yield percent of extraction oil at Temperature (T); = the yield percent of unextracted oil in the coconut.
Where Free Energy
a) Effect of Temperature and Time on Yield of Coconut Oil
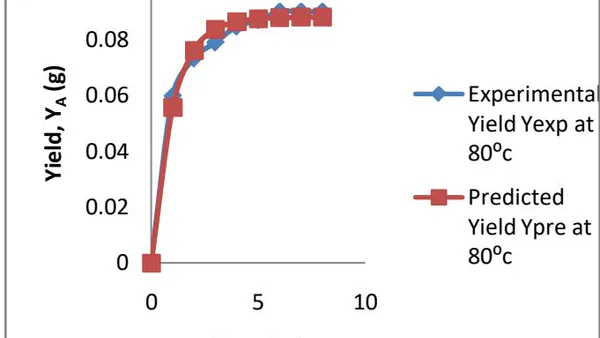
The Plots of experimental and predicted yields of Coconut oil at 80, 75 and 70°C respectively are shown in Figures 1 to 3:
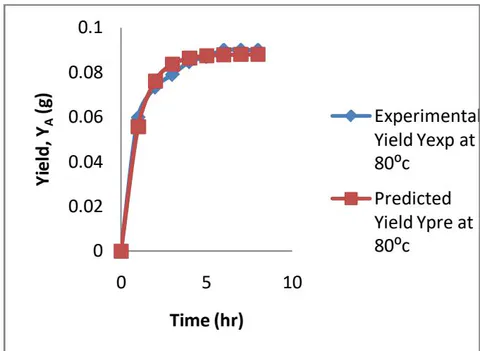
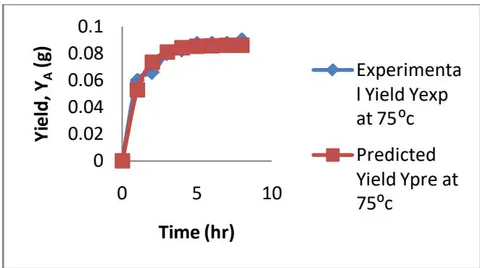
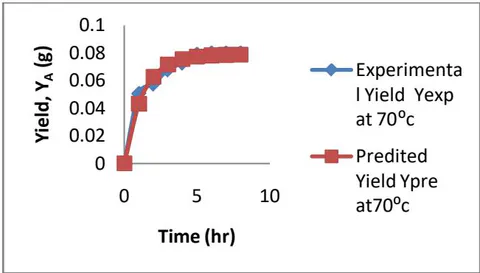
Similar yield pattern was observed for the oil extraction process carried out at the 3 different temperature conditions. Increase in extraction time also gave a corresponding increase in yield of oil under experimental conditions although the yield became constant after 7 hours. This same pattern was observed for the predicted yield with slight increment observed after 7 hours for extractions done at 70 and 75 °C. Generally, increase in temperature resulted in increased yield during the extraction process. Sulaiman et al. (2013), Eikani et al. (2012) and Meziane and Kadi (2008) reported temperature to have a direct relationship with oil diffusion rate and an inverse relationship with the oil viscosity. The mass transfer coefficient of the extraction process also increases with temperature thus affecting diffusion. According to Sulaiman et al. (2013), Amarni and Kadi (2010), and Sayyar et al. (2009), choice of solvent affects the oil yield hence the 15% increase in yield observed using hexane solvent. Moreover, Sulaiman et al. (2013) also reported an inverse relationship between yield and surface area. The rapid yield rate at the beginning of the process gradually declined in the course of the process as the copra was exposed to more of the fresh solvent. Hence as the free oil on the surface of the copra was being solubilized, the extraction rate increased accordingly. This finding corroborates with the work of Aryee and Simpson (2009). Low concentration of oil in the solvent was observed whereas the mass transfer gave rise to rapid diffusion of oil from the copra to the solvent. The oil yield remained constant even on extension of extraction time as soon as the maximum amount of extractable oil was reached.
b) Physicochemical Properties of Coconut Oil
| Properties | CrudeCoconut Oil | RefinedCoconut Oil | MineralOil |
| Moisture content (mg/kg) | 3.47 | 0.89 | 1.5 |
| Flash point (°C) | 224 | 203 | 154 |
| Pour point (°C) | 16.5 | 13 | -40 |
| Density (kgdm ) | 0.95 | 0.94 | 0.91 |
| Viscosity@60°C | 26 | 24 | 22 |
| Dielectric strength (KV) | 25.6 | 39 | 50 |
Tanteh and Al-Liddawi (2014) reported that properties such as moisture content, flash point, pour point, density, viscosity and dielectric strength affect the efficiency of transformer oil. Muhamad and Razali (2016) reported an adverse effect of moisture content on the properties of transformer oil which could also affect its performance. Solid insulation and a risk of paper insulation breakdown are some of the likely consequences of moisture content in transformer oil (Swanson et al., 2018; Hamrick, 2009). Temperature has been reported to also affect the moisture content of transformer oil. Transformer oil (mineral oil) is obtained from fractions of crude (petroleum) and so is more volatile with little water content compared to coconut oil which contains unsaturated acids that can easily absorb moisture. The moisture content for the mineral oil was obtained as 1.5 mg/kg, whereas the moisture content for crude and refined coconut oil was 3.47 and 0.89 mg/kg respectively. Low moisture content observed of the refined coconut oil indicates its enhanced insulating property compared to that of the mineral oil. Previous report (Muhamad and Razali, 2016) have highlighted the adverse effect of moisture content on the dielectric properties of transformer oil, in addition to other such similar effect on paper insulation of the core and the winding of transformer. However, low moisture content alone does not disqualify the coconut oil sample as good alternatives to mineral oil since the moisture content can be reduced by heating to enhance insulating property of oil sample.
Rouabeh et al. (2019) as well as Biermann and Metzger (2007) showed that a relationship exists between moisture content, ageing time, and dielectric strength of transformer oil. The moisture content obtained in this study corroborates the work of Muhamad and Razali (2016) whereas Mahanta and Laskar (2017) reported similar values for mineral oil and 100 mg/kg as the value for moisture content from vegetable oil.
Crude coconut oil had a flash point of 224 °C which was higher than the 203 °C and 154 °C reported for refined oil and mineral oil respectively. This value for the refined oil was moderate because low value obtained for the mineral oil grade shows its ease to ignite and hence a limitation to its usability. The flash point values obtained in this work are less than what was reported by Muhamad and Razali (2016). However these values corroborate the work of Abeysundara et al. (2001) for coconut oil and these values are above the value of 154 °C for standard oil (IEC 296). The low flash point of the mineral oil has been attributed to its exposure to more volatile substances which burn faster at lower temperatures. High flash point values are desirable to aid cooling property thereby reducing the risk of explosion during operation of transformer. Furthermore, El-refaie et al. (2009) reported that flash point changes with the duration of use of the transformer because of age and temperature of operation. High temperatures could lead to the production of hydrocarbons with lower molecular weight causing a reduction in the flash point values of the transformer oil. Based on flash point consideration, all samples considered in this study are good candidates for transformer oil.
The nature and type of bonds between carbon chains of the fatty acids affect the pour point of the transformer oil obtained from the edible seeds such as coconut oil (Biermann and Metzger, 2007). Pour point of unsaturated acid is usually very low compared to pour point of saturated acids (Bremmer and Plansker, 2008; Franco et al., 2007 and Bassim et al., 2003). The pour point values obtained from this study using the ASTM D97 corroborated the findings of Biermann and Metzger (2007). The refined coconut oil gave a better pour point value than that of the crude coconut oil. Pour point affects the insulating property of the oil when the transformer is used in cold weather conditions. It is important to keep this value as low as possible so as not to disrupt the cooling operation of the transformer by convection. The transformer, while in operation, generates heat which result in a rise in the temperature of the oil and this is fundamental in pour point consideration (Biermann and Metzger, 2007). The standard pour point for transformer oil is -40 °C, although there is a tendency that coconut oil can solidify if the power supply is disconnected for a long time due to its higher pour point which could lead to a failure of the transformer (Abeysundara et al., 2001). However, unsaturated fatty acids in the transformer oil contain double bonds and this could pose a challenge when it is subjected to heavy electromagnetic fields (Mcshane et al. 2003). There is a possibility that double bonds may break due to polarization. This work therefore posits that refined coconut oil is far better than crude coconut oil based on its pour point value.
The refined coconut oil and crude coconut oil had a density of and respectively which are both high when compared to mineral oil whose value is . Moreover, Abeysundara et al. (2001) reported the effect of density on the flow and convection of transformer oil. Hence the lower the density, the more efficient the oil and although reported in this work is higher than the reported by Abeysundara et al. (2001) for coconut oil, it corroborates the standard reported by Biermann and Metzger (2007) for environmentally friendly fluids. El-refaie et al. (2009) reported the effect of time of operation on the specific gravity of transformer oil.
A similar effect has also been reported for the oil viscosity by Muhamad and Razali (2016). Viscosity of the oil affects its cooling property, because the cooling of a transformer is mainly governed by convection, so it is important to have a low viscosity to facilitate convection. Hence, the lower the viscosity of the oil, the more effective it is at cooling. Increase in temperature reduces viscosity while the viscosity of the crude and refined coconut oil decreased with increasing temperature. It is possible that the desired range of viscosity could be reached at some elevated temperature. At the highest temperature tested in the laboratory (45 - 60 °C), viscosities of crude coconut oil and refined coconut oil were 26 and 24 respectively. Abeysundara et al. (2001) did not ascertain any effect of oil viscosity on the dielectric strength of the transformer oils obtained from similar sources because of the nature of the bonds between their molecules.
In this study, the dielectric strength was obtained as 25.6 KV for crude coconut oil while upon refinement and purification, it improved significantly to 39KV. The dielectric strength of the crude coconut oil shows that it can be used as insulating liquids in low medium voltage transformers having a capacity range of 69 to 288KV which require minimum dielectric breakdown voltage of between 20 to 30KV. This phenomenon can be explained by the degree of unsaturation of the coconut oil sample whereas the refined coconut oil can be used in high medium voltage transformers having a capacity of 35KV and above in agreement with the work of Bhumiwat et al. (2010).
c) Kinetics of the Oil Extraction Process
The results of the model and statistical parameters which was used to access the goodness of fit of the kinetic model to the experimental data at various temperatures are shown in Table 2:
| Temperature (°C) | Model parameters | Statistical Parameters | ||||
| RMSE | SEE | |||||
| 80 | 0.08801 | 0.99952 | 0.999998 | 0.000318 | 1.35E-07 | 0.000367 |
| 75 | 0.08624 | 0.95469 | 0.999951 | 0.001414 | 2.6667E-06 | 0.001633 |
| 70 | 0.07877 | 0.79496 | 0.999987 | 0.000636 | 5.4E-07 | 0.000735 |
All the temperatures considered gave very high and low error values thus showing the suitability of the kinetic model in describing the extraction process under these conditions. The predicted aligned closely to the experimental values. Furthermore, the extraction process performed at had the highest value and the least RMSE, , and SEE values closest to zero and hence the model best describes the process at this temperature.
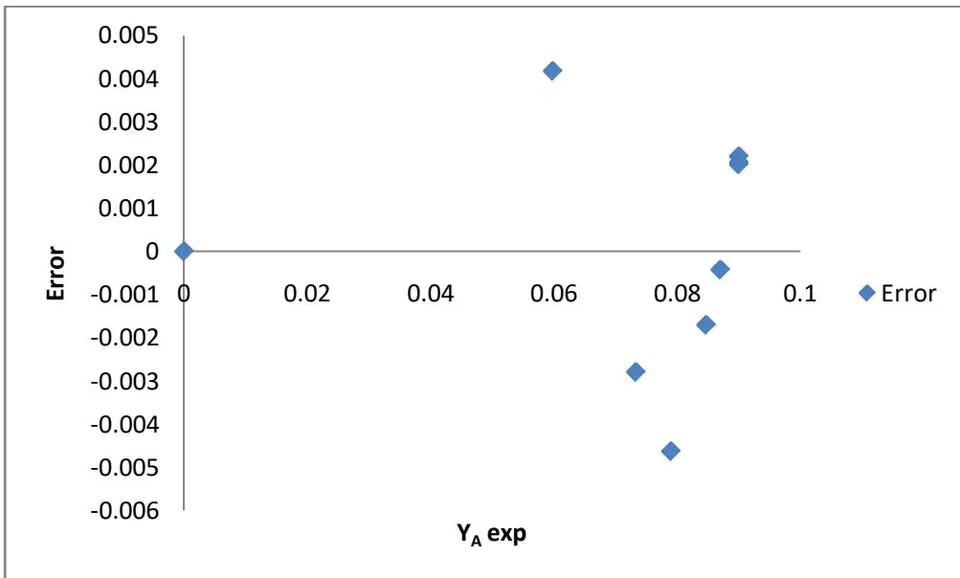
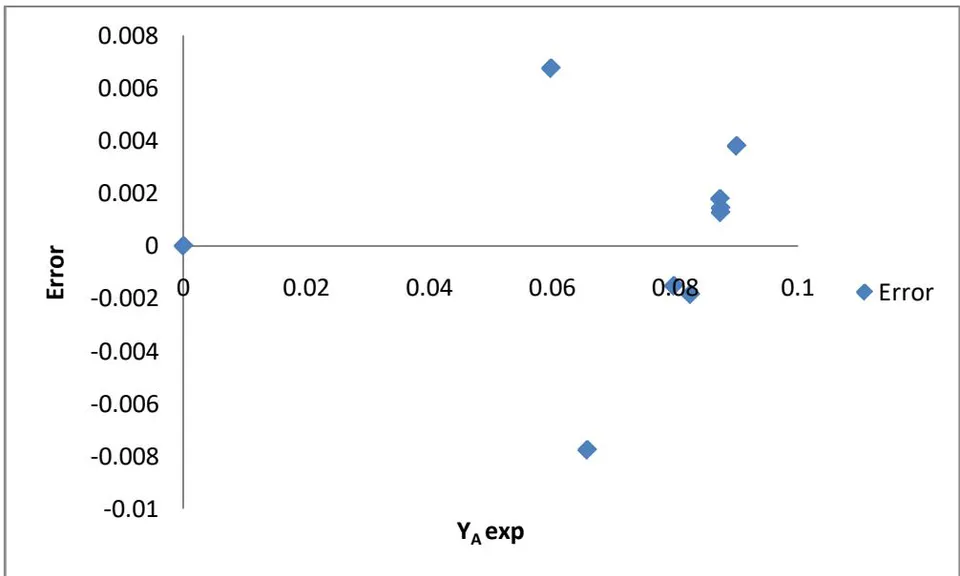
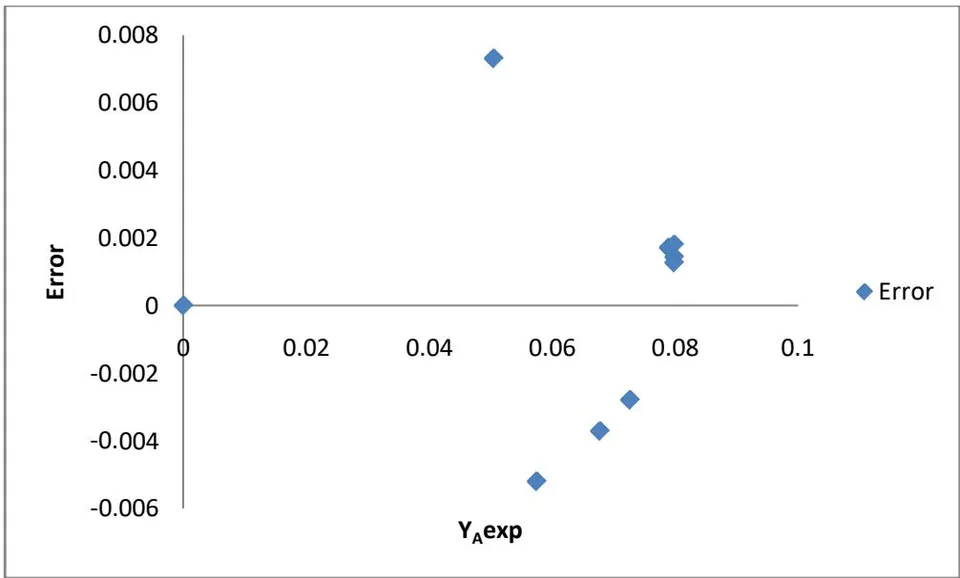
The scatter plots (Figures 4 to 6) show that which indicate the closeness of the experimental values to the population mean at these temperature conditions. These plots further show the appropriateness of the extraction model to predict the oil yield at these temperatures.
d) Intra Particle Mass Transfer
Thiele modulus was used to investigate the mass transfer within the particle. To determine the value of Thiele modulus, effective diffusivity ( ), was calculated. The Ficks second law was used to determine effective diffusivity by assuming the constant with the yield (Y) at time (t) for initial yield of the oil. Evaluation of effective diffusivity was done using the correlation of Pinelo et al. (2006) and shown in Figures 7 to 9.
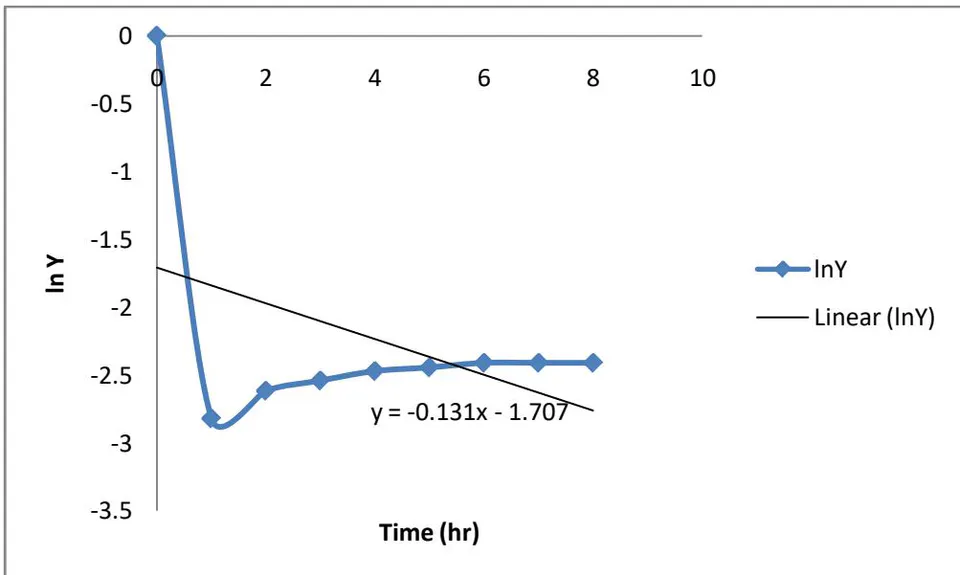
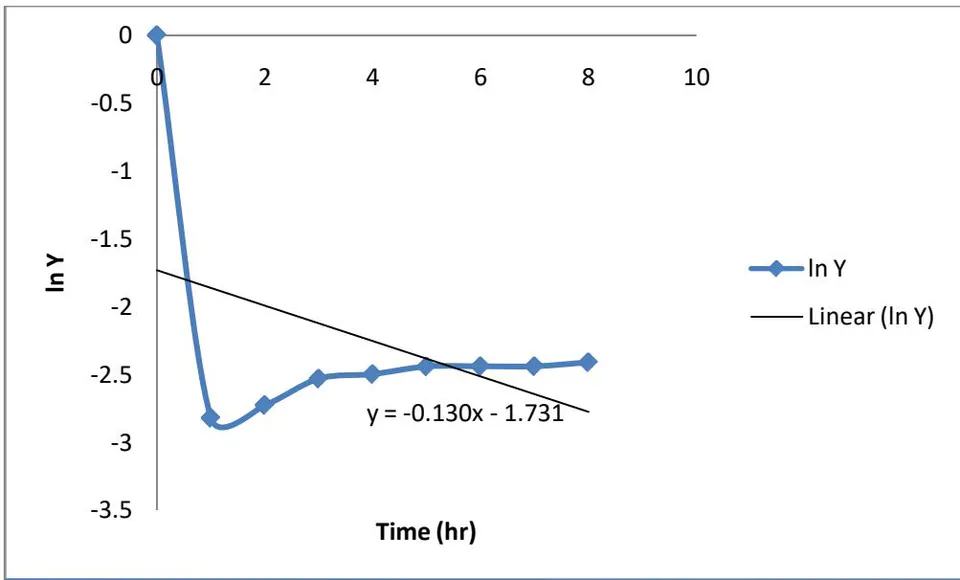
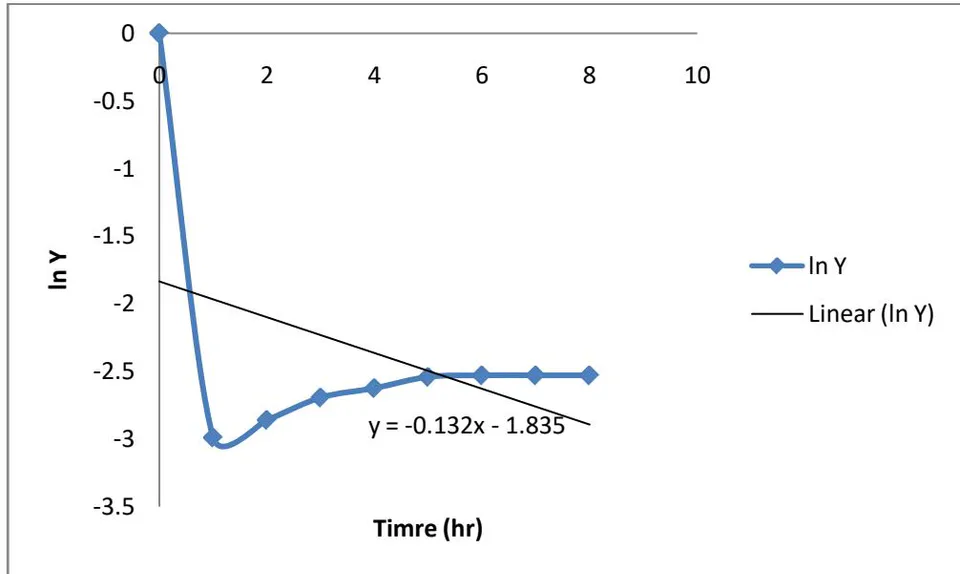
The density of the oil and the average particle size were found to be and 0.5cm respectively. Substituting values for the slope and particle radius, the effective diffusivity ( ) were obtained as , , and at temperatures of 80, 75, and 70 °C respectively. Furthermore, substituting values of the extraction rate (K) and density ( ) of the coconut oil, particle diameter of the crushed coconut (chopra) as well as the effective diffusivity into the correlation of Giri and Sharma (2000) the Thiele modulus was obtained as 2.1751, 2.0909 and 1.8039 at temperatures of 80, 75, and 70 °C respectively, therefore, showing a corresponding decrease with temperature. Low value of the Thiele modulus indicates that surface reaction controls the process and the good diffusive property of the solvent (Scott, 2006). According to Giri and Sharma (2000), limited surface reaction decreases the rate of internal mass transfer diffusion. However, results obtained from this study shows that the system was not affected by the mass transfer within the particle, because of the small value of the Thiele modulus which was less than 3. Giri and Sharma (2000) reported that the Thiele modulus values of Coal were 0.1057 and 0.016 at particle sizes of 0.1275mm and 0.016mm respectively.
e) Thermodynamic Parameter Estimation
The values of the thermodynamic parameters were obtained as shown in Table 3.
| Temperature (K) | Thermodynamic Properties | |||
| (J/mol) | (J/mol) | (J/molK) | ||
| 353 | 1.89 | -36709 | ||
| 348 | 1.76 | -36188.5 | 34.82 | 104.09 |
| 343 | 1.31 | -35668.1 | ||
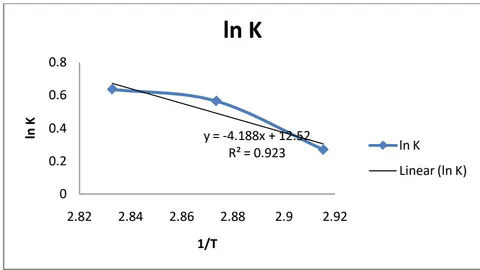
The plot of vs 1/T (Figure 10) was used to determine the value of the Thermodynamic parameters for the extraction process. Enthalpy value for this process was obtained as 34.82 Jmol which is comparable to the value obtained for other agricultural products such as melon, rubber seed and olive cake oil (Meziane and Kadi, 2008; Attah and Ibemesi, 1990). Also, Topallar and Geçgel (2010) reported an enthalpy value of 112 KJmol ; these values are within the acceptable range of 30 – 135 Jmol for these oils. Positive enthalpy change indicates the endothermic nature of the extraction process and the energy required to achieve this process in agreement with the works of Amin et al. (2010) and Topallar and Geçgel (2010).
Furthermore, the mixture contained grounded coconut (copra) in hexane which implies an increase in entropy of the mixture due to the oil molecules extraction. The entropy value which was obtained as 104.09 Jmol K describes the process as irreversible and hence corroborates the findings of Saxena et al. (2011), Topallar and Geçgel (2010), as well as Meziane and Kadi (2008).
The Gibbs free energy values of -36709, -36188.5, -35668.1Jmol were obtained at temperatures of 353, 348, 343K respectively. Negative value of the Gibbs free energy indicates that the process is spontaneous which shows that the energy required to break the solute-solvent and solvent-solvent interaction are more than the energy released in solute-solvent interaction; hence, the reaction proceeds in the forward direction. The Gibbs free energy values obtained in this work were also less than the range of 0.23 –1.25kJmol and 33.31–39.57 Jmol reported by Sulaiman et al. (2013) for 1.2, 0.7 and 0.5 mm of particle size respectively.
IV. CONCLUSION
The extraction process using the soxhlet extractor gave good yield of the oil from coconut seed. For all the temperature conditions, a similar pattern was observed for the experimental and predicted yields of the oil. The density and viscosity of the oil were comparable to that of the commercial grade mineral oil whereas the flash point and dielectric strength were indicative of the cooling and insulating capacity of the oil. The kinetic model gave good fit with the experimental data with above 0.99 and the process was best described at 80 °C. Effective diffusivity ( ) were obtained as , , and at temperatures of 80, 75, and 70 °C respectively. of 34.82 Jmol indicates the endothermic nature of the extraction process and the energy required to achieve this process whereas which was obtained as 104.09 Jmol K describes the process as irreversible. These findings show the suitability of the extracted oil as good transformer grade oil.