
I. INTRODUCTION
We need to evaluate the dental-jaw system in three different directions, i.e. sagittal, transverse and vertical [1]. With the help of research in these directions, we study the relationship between the teeth, head and face, and make it possible for us to find out exactly what part of the changes caused the anomaliesand to plan their treatment in time. It is known to all of us that orthodontic normative data can be determined mainly from these directions using a cephalogram in sagittal projection [2]. We do not want to dwell on the disadvantages of lateral cephalograms, we only want to clarify that they are not enough to evaluate the problems of the face and jaw in the transverse direction, and to evaluate these problems in the transverse direction, the cephalogram in the frontal: front-back projection and its indicators are necessary. Orthodontists and maxillofacial surgeons around the world use these frontal cephalometric analyzes in the diagnosis and treatment of transverse anomalies [3].
The study that we want to cover in this article is a frontal (front-back projection) cephalogram [4], which shows the main indicators in the detection of anomalies in the transverse direction. Problems in the transverse direction of the maxillofacial area can also cause serious problems for orthodontists, and it is these problems that are most likely to cause relapse [5]. Vertical anomalies are easy to detect in lateral cephalometry [6], but vertical asymmetry on both the right and left sides of the face can be fully analyzed only in frontal projection cephalometry [7]. In the literature on orthodontic diagnosis, there is very little information on the schematic measurement of the dimensions of the face in the transverse direction, that is, the data of the face jaw area at the developing period in the sagittal and vertical directions have not been sufficiently studied [8, 9]. In this study, we will clearly explain the uniqueness of the growth of the face in the vertical direction in people with long faces (dolichocephals) - mainly the development of the lower part of the face, and the increase in the angle of the lower jaw [10]. In determining the vertical dimensions of the face, the transverse growth indicators of the upper and lower jaws are primary important [11]. Therefore, this study will be of great help in determining frontal cephalogram parameters for assessing the symmetry of facial bones and teeth.
a) The Purpose of the Study
To determine the "maxilla-mandibular relationship" indicators of the frontal cephalogram of "Grummons" in the frontal cephalogram of representatives of the normal physiological bite of the Uzbek population, and to compare them with the indicators of "Grummons".
II. MATERIALS AND METHODS
The study was conducted on a total of 95 (55 men and 40 women) representatives of the Uzbek population with physiologically normal bite. In their frontal cephalogram, indicators of maxilla-mandibular relationship according to Grummon were determined.
a) Assessment of the Relationship of the upper and lower jaws (Maxillo - Mandibular Comparison)
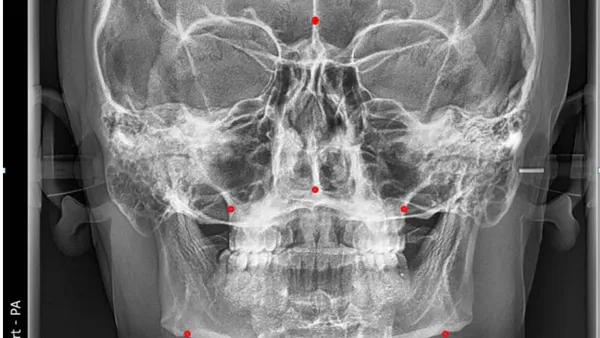
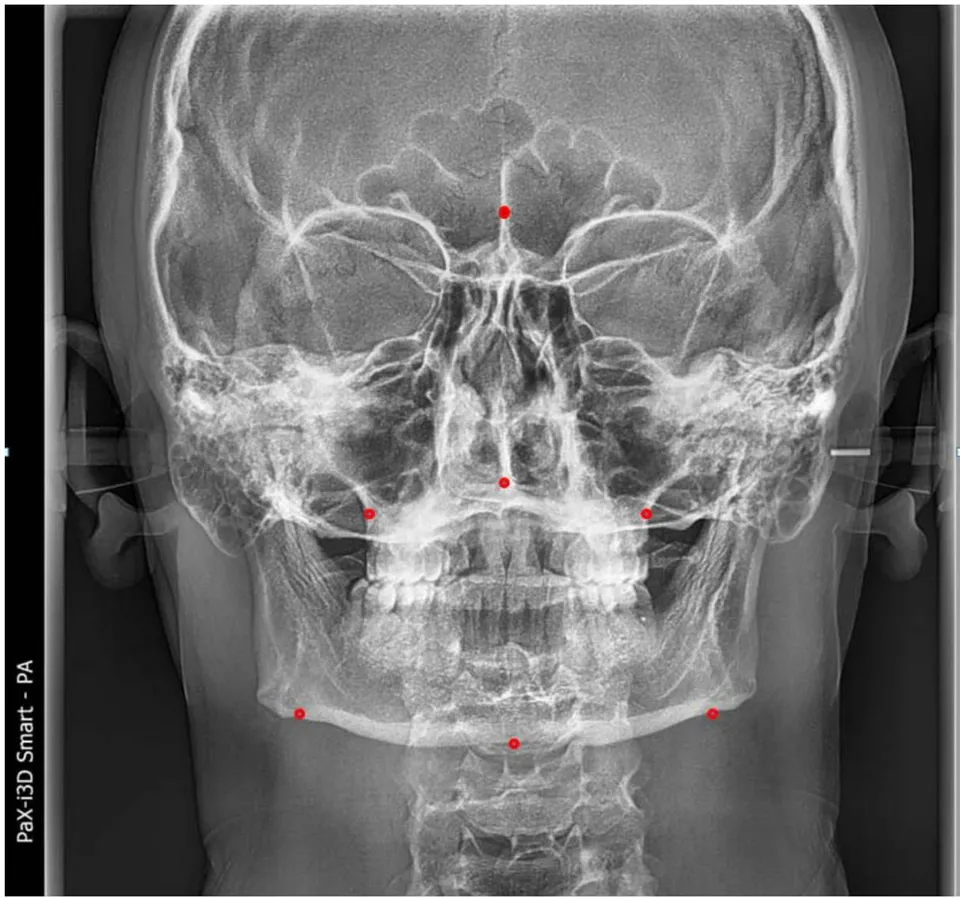
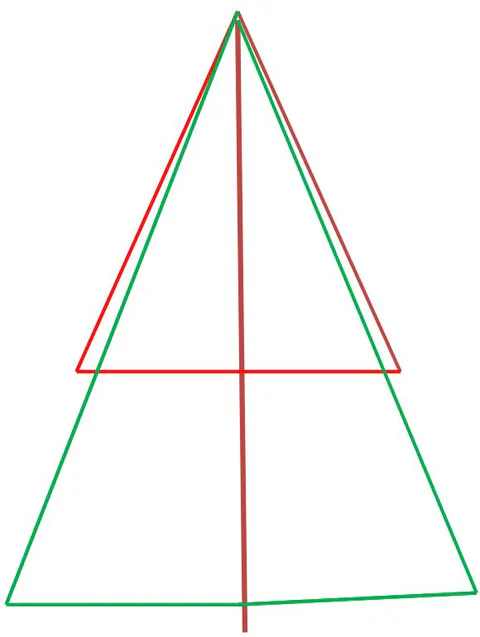
We described the comparison of the upper and lower jaws in such a perfect way that it is impossible not to use these indicators during this research. To determine the relationship of the upper and lower jaws to each other, a line is drawn from the Cg point to the J and Ag points on the right and left sides [9], the names of these points and lines are given in tables 1 and 2, and pictures 1 and 2. The right J and left J points are also connected, resulting in the formation of J-Cg-J triangle. Similarly, a horizontal line is drawn from the right Ag to the left Ag point and the triangle Ag-Cg-Ag is formed. These triangles are divided into two using MSR and four triangles: right J-Cg- MSR and left J-Cg-MSR; Ag-Cg-MSR and Ag-Cg-MSR are produced (Figure1). In this
article, the authors compared the length of the sides of the triangles and evaluated their symmetry [6,9,10]. The indicators of the upper and lower jaw symmetry of representatives of the Uzbek population were determined, compared the indicators of men and women Grummons indicators (table 3).
III. RESULTS
| No. | Cephalometric Points (Landmarks) | Latin Naming of Points | Description of the Points of the Frontal Cephalogram |
| 1 | Ag | Antegonial Notch | The groove of the corner of the lower jaw |
| 2 | ANS | Anterior Nasal Spine | Anterior point of the base of the nose |
| 3 | Cg | Crista Galli | The peak of the forehead growth of the nose is the crown of the rooster |
| 4 | J | Jugal process | Cheek growth of the upper jaw |
| 5 | Me | Menton | Chin center |
The length (mm) of the sides that form these four triangles and angles are compared and symmetry is determined (table 2).
| No. | Latin designation of surfaces | Names of surfaces generating frontal cephalogram indicators (in Latin script) | Names of surfaces generating frontal cephalogram indicators (Linear measurements on postero-anterior (PA) cephalogram) |
| 1 | MSR | (Mid-sagittal reference plane) | Mid sagittal line |
| 2 | J- J | Jugal Process - Jugal Process | The line connecting the middle points of the right and left upper jaw |
| 3 | J-MSR | (Jugal Process - Mid-sagittal reference plane) | J-line connecting the middle point of the maxillary growth - midsagittal line bn |
| 4 | Cg-J | Crista galli - Jugal Process plane) | frontal growth of the nose- cock (the line connecting the point of the crown (Cg) with the growth of the upper jaw |
| 5 | Ag-Ag | Antegonial notch plane-Antegonial notch plane | the middle point of the groove of the angle of the lower jaw is the line connecting the right and left sides |
| 6 | Cg-Ag | Crista galli - Antegonial notch plane) | - the forehead growth of the nose - the line connecting the point of the crown of the cock (Cg) with the point of the angle of the lower jaw ( |
| 7 | Ag-MSR | Antegonial notch-Mid-sagittal reference plane | Distance from the groove of the angle of the mandibular joint to the midsagittal line |
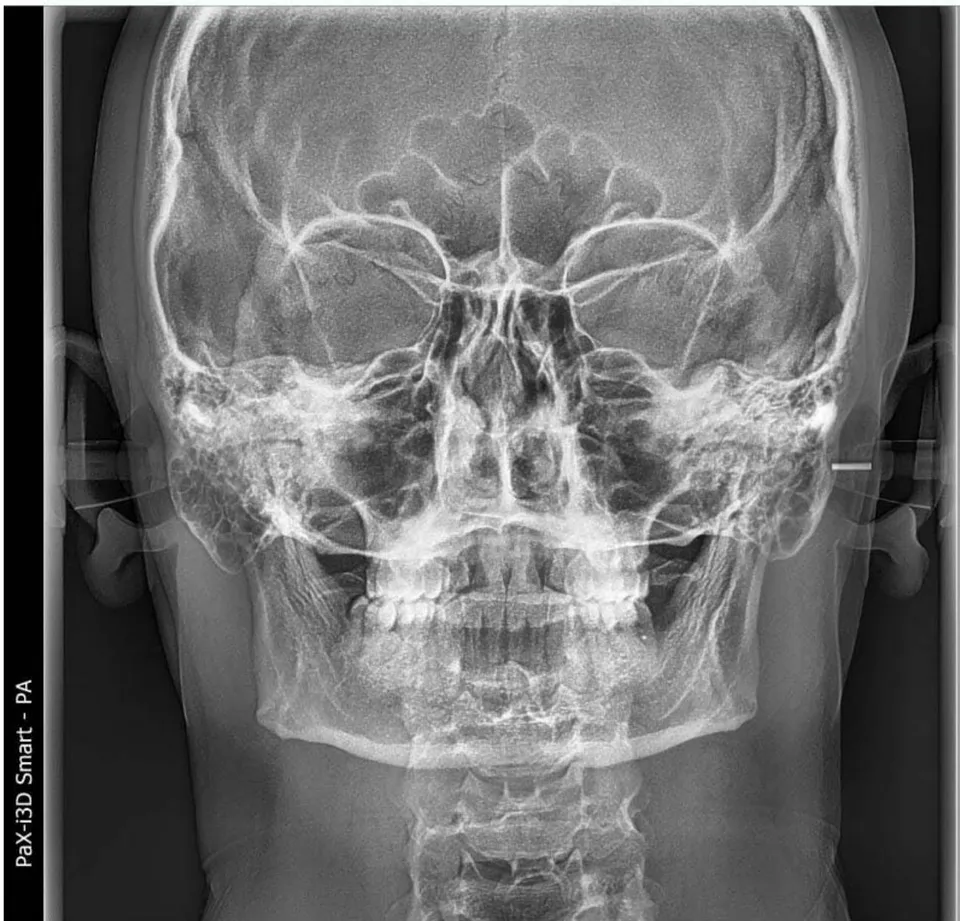
In this study, we determined and tabulated the indicators of "maxilla-mandibular relationship" according to Grummons' frontal cephalometric analysis in representatives of the Uzbek population with normal physiological pricus (table3).
| Line Name Variables | Sides | Women (N=40) (M±m) | SD | Men (N=55) (M±m) | SD | Average (Men and Women) (N=95) (M±m) | SD |
| J-MSR | Oh | 31.25±0.25 | 1.77 | 32.07±0.21 | 1.59 | 31.72 ± 0.18 | 1.73 |
| Ch | 31.33±0.27 | 1.68 | 31.96±0.21 | 1.58 | 31.69 ± 0.17 | 1.66 | |
| Ag-MSR | Oh | 39.98±0.37 * | 2.33 | 42.6±0.25^ | 1.85 | 41.49 ± 0.25 | 2.51 |
| Ch | 41.0±0.35 | 2.24 | 42.49±0.29 | 2.14 | 41.86 ± 0.24 | 2.45 | |
| Cg-J | Oh | 65.7±0.45* | 2.82 | 71,09±0,58*^ | 4.32 | 68,82±0.47 | 4.61 |
| Ch | 65.55±0.49* | 3.08 | 70,87±0,55*^ | 4.10 | 68,63±0.46 | 4.55 | |
| Cg-Ag | Oh | 109.28±0.81* | 5.12 | 118.02±0.66*^ | 4.88 | 114.33±0.68 | 6.62 |
| Ch | 109.15±0.81* | 5.13 | 117.91±0.67*^ | 4.96 | 114.22±0.68 | 6.66 |
Cg-J Oh 65.7\pm0.45 * 2.82 71.09\pm0.58 * \uparrow 4.32 68.82\pm0.47 4.61 Ch 65.55\pm0.49 * 3.08 70.87\pm0.55 * \uparrow 4.10 68.63\pm0.46 4.55 Cg-Ag Oh 109.28\pm0.81 * 5.12 118.02\pm0.66 * \uparrow 4.88 114.33\pm0.68 6.62 Ch 109.15\pm0.81 * 5.13 117.91\pm0.67 * \uparrow 4.96 114.22\pm0.68 6.66
| Ch | 41.0\pm0.35 | 2.24 | 42.49\pm0.29 | 2.14 | 41.86 \pm 0.24 | 2.45 | |
|---|---|---|---|---|---|---|---|
| Cg-J | Oh | 65.7\pm0.45 \* | 2.82 | 71.09\pm0.58 \* \uparrow | 4.32 | 68.82\pm0.47 | 4.61 |
| Ch | 65.55\pm0.49 \* | 3.08 | 70.87\pm0.55 \* \uparrow | 4.10 | 68.63\pm0.46 | 4.55 | |
| Cg-Ag | Oh | 109.28\pm0.81 \* | 5.12 | 118.02\pm0.66 \* \uparrow | 4.88 | 114.33\pm0.68 | 6.62 |
| Ch | 109.15\pm0.81 \* | 5.13 | 117.91\pm0.67 \* \uparrow | 4.96 | 114.22\pm0.68 | 6.66 |
We compared the indicators of "comparison of the upper and lower jaws" of the representatives of the Uzbek population with normal physiologicalbite with the results of the average indicators of men and women. The J-MSR index for Uzbeks is on the right and on the left; in men, right . and left ; right in women and left . equal to, and no significant difference was found when they were compared with each other or compared with the average values ( ). Ag-MSR index in men is right and left; Ag-MSR index of women is right and left. is equal to it was found that the average of the Ag-MSR indicator of Uzbeks is equal to on the right and on the left. Now, when we compared Ag-MSR values of women and men with respect to mean Ag-MSR values, only female Ag-MSR R values were significantly different ( ). When the Ag-MSR indicators of men and women were compared, it was found that there was a reliable difference between the Ag-MSR R indicator of men and the Ag-MSR R indicator of women ( ). The average of the Cg-J indicator of Uzbeks is on the right and on the left. Cg-J index in men is right and left; in women, the right is and the left is . When comparing the Cg-J index of women and men, there are reliable differences in the Cg-J index of men compared to the Cg-J index of women ( ). Now, when comparing the Cg-J index of women and men to the average of Uzbeks, a reliable difference was found only in men's Cg-J index compared to the average Cg-J index .
The average Cg-Ag indicator of Uzbekks is on the right and on the left; Cg-Ag indicator of women is right and left ; in men it was found that the right is and the left is . When comparing the Cg-Ag index of women and men to the average Cg-Ag indicator of Uzbekks, a reliable difference was found only in the Cg-Ag indicator of men compared to the average Cg-Ag indicator . When the Cg-Ag indicators of women and men were compared, a reliable difference was found in the Cg-Ag indicator of men compared to the Cg-Ag indicator of women .
a) Comparison of Personally Obtained Results with Indicators Determined by Grummons
In order to evaluate the relation of the upper and lower jaws of the representatives of the Uzbek population, we need the "relationship of the upper and lower jaws" indicators proposed by the author - Grummons. For this, we studied several articles of the author and used the most favorable indicators [5,6]. In table 4, we compare the upper and lower jaw relationship indicators of male and female representatives of the Uzbek population with the upper and lower jaw relationship indicators of women and men determined by the author.
| Surfaces Variables | Sex | Party(side) | N | Uzbeks | SD | N | Grummons | SD | P |
| J-MSR | A | Right | 40 | 31.25±0.25 | 1.77 | 15 | 39.1±0.28 | 1.84 | >0.05 |
| Left | 31.33±0.27 | 1.68 | 39.2±0.21 | 1.78 | >0.05 | ||||
| E | Right | 55 | 32.07±0.21 | 1.59 | 15 | 37.37±0.42 | 2.35 | >0.05 | |
| Left | 31.96±0.21 | 1.58 | 35.5±0.39 | 1.66 | >0.05 | ||||
| Ag-MSR | A | Right | 40 | 39.98±0.37 | 2.33 | 15 | 37.1±0.44 | 1.52 | >0.05 |
| Left | 41.0±0.35 | 2.24 | 38.8±0.24 | 2.81 | <0.05 | ||||
| E | Right | 55 | 42.6±0.25 | 1.85 | 15 | 44.5±0.31 | 2.37 | >0.05 | |
| Left | 42.49±0.29 | 2.14 | 43.5±0.29 | 2.08 | >0.05 | ||||
| Cg-J | A | Right | 40 | 65.7±0.45 | 2.82 | 15 | 60.2±0.52 | 3.11 | <0.05 |
| Left | 65.55±0.49 | 3.08 | 59.4±0.47 | 2.73 | <0.05 | ||||
| E | Right | 55 | 71,09±0,58 | 4.32 | 15 | 60.8±0.55 | 3.3 | <0.01 | |
| Left | 70,87±0,55 | 4.10 | 62.2±0.51 | 2.95 | <0.01 | ||||
| Cg-Ag | A | Right | 40 | 109.28±0.81 | 5.12 | 15 | 101.5±0.74 | 4.98 | <0.05 |
| Left | 109.15±0.81 | 5.13 | 99.4±0.9 | 5.24 | <0.01 | ||||
| E | Right | 55 | 118.02±0.66 | 4.88 | 15 | 108.5±0.71 | 4.35 | <0.01 | |
| Left | 117.91±0.67 | 4.96 | 108.8±0.68 | 5.13 | <0.01 |
The J-MSR index of representatives of the Uzbek population in women, right and left ; in men, the right and left . The same J-MSR indicator in women according to the author is . and left ; in men, right . and left . mentioned in the articles of its establishment. Now when we compared these J-MSR scores, no reliable differences were found .
Ag-MSR index in female representatives of the Uzbek population is mm. and left mm.; in male representatives, the right is and the left is mm. According to the author - Grummons, Ag-MSR indicator is right mm and left mm in women; right mm in men. and the left is equal to mm. We can see from table 4 that there is no reliable difference between the Ag-MSR indicators of the author and the Ag-MSR indicators of representatives of the Uzbek population ( ).
Cg-J index in female representatives of the Uzbek population is right and left ; and in male representatives, the right is . and the left side is . was found to be equal to Cg-J indicator Grummons during his research in women right . and the left . in men, the right is and the left is equal to . When we compared the Cg-J indicators of female representatives of the Uzbek population with the Cg-J indicators determined by the author in women, a reliable difference was found compared to the Cg-J indicators of the Uzbek population representatives (P<0.05). When we compared the Cg-J indicators of male representatives of the Uzbek population with the Cg-J indicators determined by the author in men, a highly reliable difference was found compared to the Cg-J indicators of the Uzbek population representatives (P<0.01).
Cg-Ag index in Uzbek women is on the right and left sides. and . According to According to the author, the Cg-Ag indicator is right in women and left in men; right in men. and left . is equal to in his article. Now, when we compare the Cg-Ag indicators of the author with the Cg-Ag indicators of Uzbeks, reliable differences were found between the Cg-AgR indicator of Uzbek women and the author's Cg-AgR indicator in women . When comparing Cg-AgL indicator of
Uzbek women, Cg-AgR and Cg-AgL indicators of Uzbek men, Cg-AgL indicator of the author's same in women, in the Cg-AgR and Cg-AgL indicators of the author, we can see that high-level reliable differences were detected .
IV. CONCLUSION
In comparison of the upper and lower jaws relationship of representatives of the Uzbek population, the Cg-J index is in women. and in men. and Cg-Ag index is equal to in women; in men. It was found that there is a difference of in the Cg-J index and in the Cg-Ag index ( ). Gender dependence should be taken into account when performing the analysis of the comparison of the upper and lower jaws.
When comparing the average upper and lower jaws of men and women of the Uzbek population, the Cg-J index of men is 2.16 mm. and 3.68mm differences were found in Cg-Ag indicator . When determining Cg-Ag and Cg-J indicators in Uzbeks, gender dependence should be taken into account.
Comparison of upper and lower jaws of male and female representatives of the Uzbek population compared to the parameters proposed by the author - Grummons, Cg-J index is 9.48 mm., 9.31 mm in the Cg-Ag index. Differences were found . Therefore, it is appropriate to use the norms developed for the Uzbek population when analyzing according to Grummons.