## I. INTRODUCTION
Caesarean section is the most common surgical procedure performed worldwide. Rising rates are attributed to various medical and non-medical factors $^{(1)}$. With an increase in the number of cesarean sections, there is a significant increase in the number of SSIs $^{(2,3)}$. The incidence of SSI following cesarean section worldwide has been reported to range between 0.63 to $9.85\%^{(4-6)}$. SSIs are the most common health care associated infections (HAI) in India. The incidence of post caesarean SSI in India varies from 3.1 to $24.2\%^{(7,8)}$. This trend emphasizes the need for robust surveillance and preventive strategies to mitigate the risk of SSIs. This will help to develop targeted interventions to reduce SSIs and improve patient outcomes.
There is a dearth in the existing literature with large data sets of Indian studies and there is lack of uniformity in practices. This study aims at bringing in the uniformity in post operative practices to bring down the SSI rates to acceptable rates. The SSI rates in India differ from international numbers based on the patient demographics, hospital settings, resource limitations and infrastructure etc.
Caesarean sections have a low procedure-level risk of infection as they are considered as clean wound type. Most SSIs after caesarean are preventable with adherence to infection control strategies and good surgical practices.
SSI post cesarean section is defined as an infection that occurs at or near the surgical site within 30 days of the procedure $^{(9)}$. SSI can be because of contamination before the surgery (traumatic injuries), contamination from the patient (skin flora) or contamination during the surgery (staff, equipment). It is considered as SSI, if one of the following is observed or reported:
- A purulent (pus) discharge in, or coming from, the wound (including evidence of an abscess) OR
- Evidence of fever with painful, spreading erythema surrounding the surgical site OR
- Any reopening of the surgical wound
The diagnosis of wound infection does not require bacteriology/laboratory confirmation. Sometimes, it is difficult to identify the causative organism, because multiple organisms are often found in a single infected wound. Most of the time, anaerobes play a major role. SSIs are classified as superficial (involving only the skin and subcutaneous tissue), deep (discharging wounds with deep tissue involvement of the fascial and muscle layers) and organ space SSIs (extend beyond the facial and muscle layers) $^{(10)}$. Each type presents distinct clinical challenges and requires specific management approaches. Understanding the classification of the SSI and the microbiological profile of these infections is essential for optimizing the treatment regimens. Most of the superficial SSI are managed symptomatically with dressings or antibiotics while deep SSI need surgical interventions.
This study aims to provide comprehensive insights into the incidence and the risk factors following Caesarean sections from a five-year period data.
### Primary Objective:
- To determine the incidence of surgical site infections (SSI) following caesarean section.
#### Secondary Objectives:
- To analyse the risk factors associated with SSIs in women undergoing both elective and emergency caesarean sections.
- To classify SSIs into superficial, deep, or organ space infections.
- To identify and analyse the bacterial isolates in the cases of SSI and plot an antibiogram for the institute.
## II. MATERIALS AND METHOD
This 5- year observational study was conducted at Fernandez Hospital, a tertiary care referral centre in Hyderabad, Telangana, India, specializing in obstetrics, gynaecology, and neonatology. Utilizing data from five years, the study included all women who had caesarean sections at the study site from January 2018 to December 2022, with patients being followed up to 30 days postoperative period. The reason for choosing this study period was the introduction of the HICC (Hospital Infection Control Committee) team with ICO (Infection Control officer) and ICN (Infection Control Nurse). Data collection was done meticulously, and a standard protocol was practiced. Data were sourced from medical records and hospital infection control surveillance data, encompassing all confirmed cases of surgical site infections (SSIs) during this period.
The women who underwent caesarean sections at other hospitals but came to the study site for follow-up of wound infection and women who were lost to follow-up after caesarean section were excluded. The reason for excluding women who had caesareans in other hospitals was the possibility of difference in practices and inability to get the details of pre OP intra OP and post OP findings.
Hospital protocol: A surgical safety check list adapted from WHO has been used at the study site for monitoring and surveillance. The institute follows usage of single dose antibiotic prophylaxis 30 to 60 minutes prior to the surgical incision $^{(11)}$.
Surveillance: The study procedure involved surveillance of caesarean births, starting from postoperative day 1, continuing as inpatients, and extending up to 30 days post-caesarean sections. This surveillance was carried out by designated staff, including a dedicated staff nurse and the Infection Control Nurse (ICN). The role of ICN was to train the staff in following the set practices in reducing the SSI and follow up the women in the immediate postoperative period, sensitize them about the practices to be followed at home and alerts to visit the hospital after discharge. Data collection methods included postnatal visit forms, with relevant information recorded and maintained as excel sheets. The data was collected in real-time and was entered in the excel sheets. The ICN s were trained to maintain standard data collection and entry. The Infection Control Officer (ICO) analysed the collected data and discussed it with clinicians during monthly Hospital Infection Control Committee (HICC) meetings to identify and address gaps in infection prevention measures. The SSI rate was calculated. The organizational benchmark for SSI was set at $2\%$ with the consensus of HICC based on the Institutional records. Ethical considerations were strictly adhered to throughout the study.
Statistical analysis: Descriptive analysis was carried out by frequency and proportion for categorical variables. Continuous variables were presented as median (IQR) due to non-normal data. The chi-square test was used to test the statistical significance of cross-tabulation between categorical variables. Mann-Whitney U test was used to compare the median (IQR) of continuous variables between two groups. Binary logistic regression was used to assess the predictors of the outcome.
P value $< 0.05$ was considered statistically significant. RStudio Desktop latest version was used for statistical analysis. (Reference: R Studio Team (2024). R Studio: Integrated Development for R. R
Studio, PBC, Boston, MA URL http://www.rstudio.com/.)
## III. RESULTS
A total of 24,010 women had cesarean sections in the study period. Out of these 13628
(56.7%) were elective and 10382 (43.2%) were emergency cesarean sections. A total of 248 women had SSI during the study period with an incidence of 1.03%. The SSI rate following elective caesarean was 0.44% (60/13628) and SSI rate after emergency caesarean was 1.81% (188/10382).
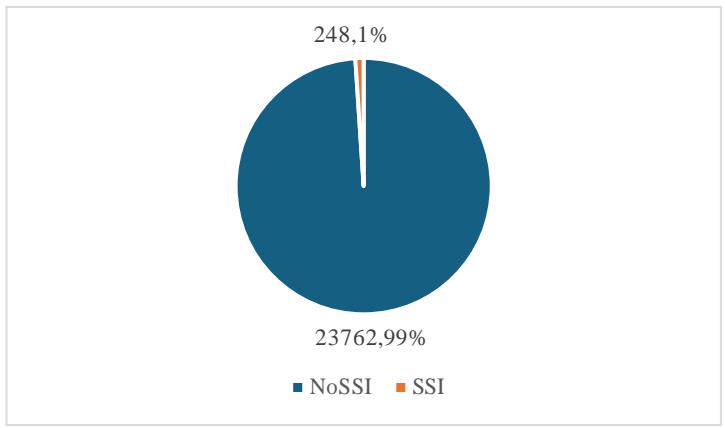
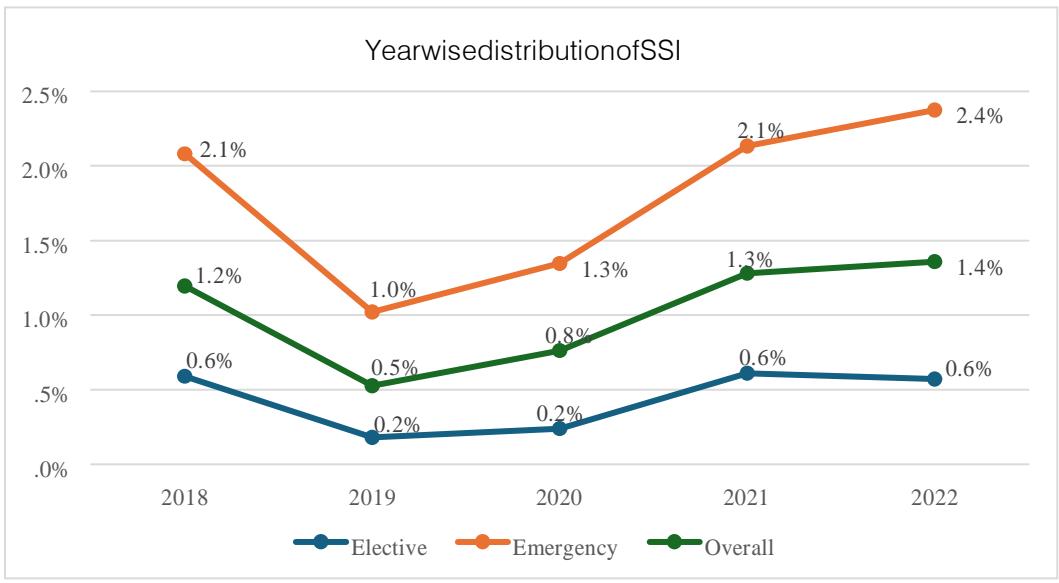 Pie Chart: SSI among CS deliveries (N=24010) Year wise distribution of SSIs
The baseline characteristics of the patients with SSI are mentioned in Table 1.
Most SSIs occurred in the 20 to 34 years age group (82.7%), with a small proportion in the $<= 19$ years (0.8%) and $>= 35$ years (16.5%) age groups. There was a significant variation in SSI cases across different BMI categories. The incidence of SSI was directly proportional to BMI. The distribution of SSI cases between preterm and term cases were 27.8% and 72.2% respectively. Out of the total SSI 24.2% were following an elective caesarean section and 75.8% were following an emergency caesarean section. 34.7% of the women were Diabetic and 22.2% of the women had hypertensive disorders in pregnancy. 92.7% of the women had singleton pregnancies and $7.3\%$ of the pregnancies were multifetal.
Table 2 compares the basic and obstetric characteristics between the SSI group and the control group.
When compared with the control group, SSI group had higher incidence in women with Class I, Class II and Class III obesity with a significant p value. Emergency LSCS, prelabour rupture of membranes and PPH also showed a significant difference in SSI group when compared with the control group with no SSI.
Table 3 explains the logistic regression to assess the risk factors of SSI.
Higher age, obesity, emergency cesarean section, prelabour rupture of membranes and PPH were found to be significant predictors of SSI following a cesarean section according to univariate analysis $(p < 0.05)$. Those variables with $p < 0.05$ in the univariate analysis were included in the multivariable analysis. Women aged between 20 to 34 were $44.9\%$ (adjusted OR: 0.551; $95\%$ CI: 0.385 to 0.789) less likely to have SSI following CS as compared to women aged $>=35$ years. Overweight, Class I obese women, class II obese women and class III obese women were respectively 2.332 times (adjusted OR: 2.332; $95\%$ CI: 1.432 to 3.799), 6.548 times (adjusted OR: 6.548; $95\%$ CI: 4.071 to 10.530), 14.061 times (adjusted OR: 14.061; $95\%$ CI: 8.360 to 23.650), and 37.349 times (adjusted OR: 37.349; $95\%$ CI: 21.444 to 65.051) more likely to have SSI as compared to women with normal BMI. Women with emergency cesarean section were 3.822 times (adjusted OR: 3.822; $95\%$ CI: 2.735 to 5.340) more likely to have SSI compared to women with elective cesarean section. Women with PPROM/PROM were 3.75 times (adjusted OR: 3.750; $95\%$ CI: 2.731 to 5.149) more likely to have SSI following cesarean section as compared to women without rupture of membranes. Women with PPH were 1.711 times (adjusted OR: 1.711; $95\%$ CI: 1.167 to 2.508) more likely to have SSI following cesarean section as compared to women without PPH.
Table 4 presents a comparison of various risk factors between elective $(n = 60)$ and emergency $(n = 188)$ cesarean sections. This detailed comparison highlights the statistically significant difference between the elective and emergency cesarean sections in terms of risk factors such as BMI, Induction of labor, number of vaginal examinations, intrapartum pyrexia and rupture of membranes. Other factors, including age, hypertensive disorders, Diabetes mellitus, autoimmune disorders, PPH, anemia and gestational age did not show significant differences between the two groups.
Majority of the SSI cases (99.19%) were classified as superficial, and 2 cases (0.8%) were classified as deep SSI. The average number of days that the women came back with complaints postsurgery was 10.22 days. Most common complaint was purulent discharge and skin gape at the suture site (31.5%). The commonest organisms isolated in the wound swabs were Escherichia Coli (23%), Staphylococcus aureus (21,4%) followed by Enterococcus fecalis (16.1%) and Klebsiella Pneumoniae (15.7%). In 32 cases (12.9%) no organism was isolated from the wound culture as shown in graph 1.
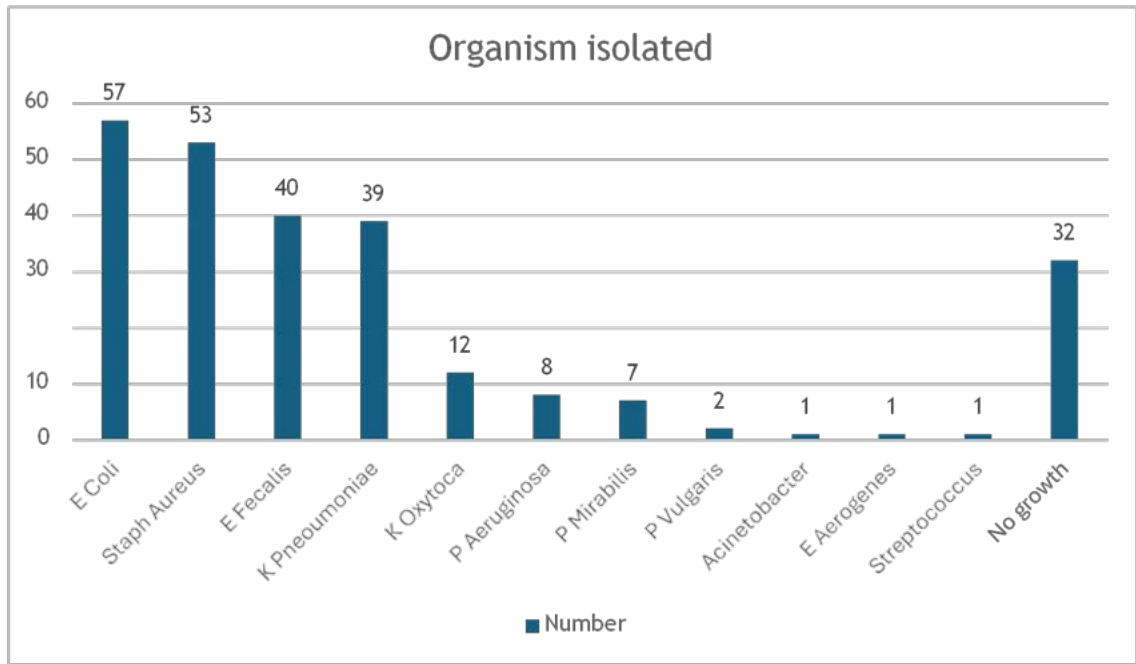 Organisms isolated from the wound swabs
Table 5 highlights the distribution and associations of different organisms isolated from SSI cases with clinical conditions. E. Coli (24.4%), Staphylococcus aureus (18.6%), Klebsiella Pneumoniae (14%) and Enterococcus faecalis (11.6%) are significantly associated with diabetes mellitus.
Of these 248 SSI cases, 241 (97.17%) were managed by conservative management, antibiotics and 7 cases (2.82%) required surgical intervention.
Tables 6 and 7 show the antibiogram plotted for 5 years data taking all the LSCS wound swab samples data. Bacteriological analysis is done in different medical conditions. Antibiogram is plotted following the "CLSI M39: guidelines for the preparation and use of antibiograms". Antibiogram for 5 years data taking all the LSCS wound swab samples data was plotted. Antibiotic susceptibility is followed by the CLSI guidelines for the year and Cascade reporting is followed while reporting. As the study population involves mostly naive mothers without prior exposure to high end antibiotics the sensitivity pattern is very good. The Gram-negative isolates are sensitive to $3^{\text{rd}}$ generation cephalosporins/ BLI preparations, Carbapenems, Aminoglycoside and Fluroquinolones. The Gram-positive isolates are sensitive to Beta lactams, Vancomycin, Fluroquinolones.
## IV. DISCUSSION
The findings of this study highlight important factors influencing the incidence of surgical site infections (SSIs) among women undergoing cesarean sections. This study found SSI incidence of $1.03\%$ among caesarean deliveries. In a study done at a teaching hospital by Basany K et al showed SSI incidence as $4.6\%$ and another study done by Hirani S et al showed an SSI incidence of $5.63\%$ which is higher than the current study $^{(7,12)}$. The prevalence of SSI in Polish hospitals and at a study site in Kenya was reported to be $0.5\%$ and $2.1\%$ respectively indicating varied incidences of SSI in different setups $^{(13,14)}$. Basany et al showed that $99\%$ of cases were labelled as superficial SSI which is the incidence at the study site $^{(12)}$. The current study highlights a strong association between higher BMI and increased SSI risk, particularly in the obese and overweight categories.
This aligns with findings from a meta-analysis by Carter et al who reported that obesity is a significant risk factor for SSIs in caesarean sections $^{(15)}$. A study done by Astha Regmi et al in Nepal also had women with obesity having a higher risk of SSI than those with normal weight and underweight (adjusted OR 15.72 (4.60- 53.67) at p value of $< 0.001$ ${}^{(16)}$ ). Both studies emphasize the need for targeted interventions to restrict weight gain in pregnancy. Emergency caesarean sections had more SSI when compared to elective caesareans which is similar to the study by Panwar D et al and Chhetry et al $^{(8,17)}$. This is similar to the other studies $^{(18,19)}$. The increased risk of SSIs in emergency caesarean sections observed in this study is supported by previous research by Gomaa et al. with emergency CS (AOR 2.16; $95\%$ CI =1.61-2.51)(20). The significant association between the number of vaginal examinations and SSIs ( $p < 0.001$ ) is similar to the results of the meta-analysis done in Ethiopia which showed that repeated digital vaginal examination increased the risk of surgical site infection by 3.80 times than the counter parts (AOR = 3.80, $95\%$ CI;
(2.45-5.88) $^{(21)}$. Rupture of membranes was associated with a significant increase in the risk for SSI which is similar to the prospective cohort study done in Ethiopia which showed that the odds of developing an infection after a cesarean section with a history of rupture of membranes was two-fold higher than those without rupture of membranes (AOR: 2.10, $95\%$ CI: 1.04, 4.24) $^{(22)}$. The timing of antibiotic prophylaxis did not show significant impact on SSI rates $(p = 0.683)$. These results corroborate the findings of Baaqeel et. al, who emphasized the importance of timely antibiotic administration to reduce SSIs $^{(23)}$. The duration of surgery did not show a significant difference when compared to previous studies such as those by Olsen et al $^{(24)}$. Who documented that prolonged operative time increases the risk of infections due to prolonged exposure and the potential for bacterial contamination. Similar studies highlight the need for enhanced infection control measures during emergency caesarean sections. While evaluating the risk factors for SSI in correlation with the maternal medical diseases, the results did not show any significant correlation with diabetes, hypertension or autoimmune disorders as significant risk factor for SSIs. Most of the studies quoted the correlation between diabetes and SSI $^{(25)}$, which is not the same in the current study as most of the women had good glycaemic control during pregnancy. This emphasises the importance of maintaining normoglycemic state. Induction of labour and PPH were also significantly associated with SSI when compared with the control group similar to other studies $^{(26,27)}$.
The predominance of Escherichia coli and Staphylococcus aureus in the study mirrors findings from previous studies, such as those by Haas et al., and other studies $^{(28-31)}$. The presence of Enterococcus faecalis and other organisms like Klebsiella pneumonia and Pseudomonas aeruginosa in this study suggests a broad spectrum of potential pathogens, emphasizing the need for culture-specific treatment strategies.
Strengths of the study: The strengths of this study lie in its comprehensive real time data collection over five years and rigorous statistical analysis, providing robust insights into the epidemiology and risk factors of SSIs in this setting. The antibiotic policy and the surgical safety checklist have been followed at the study site was as per the WHO criteria. Women were followed up to 30 days postpartum as per the CDC criteria and a team of HICC was constantly monitoring the cases.
Limitations of the study: The results may not reflect the other centres in India as the socio-demographic, medical and obstetric risk factors may not be matched with the other centres in India.
## V. CONCLUSION
The current study's findings highlight the critical need for management of women with high BMI, optimizing maternal medical conditions such as diabetes mellitus, limiting the number of vaginal examinations during labour, and stringent infection control in emergency surgeries and strict adherence to infection control practices. The identification of prevalent organisms and strict compliance with surgical prophylaxis followed by targeted antimicrobial therapy will help reduce the unnecessary use of high-end antibiotics and antimicrobial resistance. The hospital introduced SSI bundle and IPC (Infection Prevention and Control) campaign from 2023, and the month of May has been dedicated to teaching and training the health care workers on infection control practices. Antimicrobial stewardship policy has been implemented strictly adhering to Antibiotic policy of the organization. SSI surveillance is an ongoing process, and a prospective study and publication is planned to look at the impact of introduction of the SSI bundle and IPC campaign on further reducing the SSI rates.
Table 1: Baseline Characteristics of the SSI group (N=248)
<table><tr><td>Variables</td><td>Frequency</td><td>Percentage</td></tr><tr><td colspan="3">Age, n (%)</td></tr><tr><td><= 19 years</td><td>2</td><td>0.8%</td></tr><tr><td>20 to 34 years</td><td>205</td><td>82.7%</td></tr><tr><td>>= 35 years</td><td>41</td><td>16.5%</td></tr><tr><td colspan="3">BMI, n (%)</td></tr><tr><td>Underweight</td><td>0</td><td>0.0%</td></tr><tr><td>Normal weight</td><td>22</td><td>8.9%</td></tr><tr><td>Overweight</td><td>63</td><td>25.4%</td></tr><tr><td>Class I obese</td><td>82</td><td>33.1%</td></tr><tr><td>Class II obese</td><td>45</td><td>18.1%</td></tr><tr><td>Class III obese</td><td>36</td><td>14.5%</td></tr><tr><td colspan="3">Parity, n (%)</td></tr><tr><td>Primiparous</td><td>179</td><td>72.2%</td></tr><tr><td>Multiparous</td><td>69</td><td>27.8%</td></tr><tr><td colspan="3">Gestational age, n (%)</td></tr><tr><td>Preterm</td><td>66</td><td>26.6%</td></tr><tr><td>Term</td><td>182</td><td>73.4%</td></tr><tr><td colspan="3">Labour, n (%)</td></tr><tr><td>Elective</td><td>60</td><td>24.2%</td></tr><tr><td>Emergency</td><td>188</td><td>75.8%</td></tr><tr><td colspan="3">Hypertensive disorders, n (%)</td></tr><tr><td>Yes</td><td>55</td><td>22.2%</td></tr><tr><td>No</td><td>193</td><td>77.8%</td></tr><tr><td>DM, n (%)</td><td></td><td></td></tr><tr><td>Yes</td><td>86</td><td>34.7%</td></tr><tr><td>No</td><td>162</td><td>65.3%</td></tr><tr><td>Autoimmune disease, n (%)</td><td></td><td></td></tr><tr><td>Yes</td><td>5</td><td>2.0%</td></tr><tr><td>No</td><td>243</td><td>98.0%</td></tr></table>
Table 2: Comparison of basic and obstetric characteristics between SSI group and control group
<table><tr><td>Variables</td><td>SSI Group (n=248)</td><td>Control group (n=23762)</td><td>P value</td></tr><tr><td colspan="4">Age, n (%)</td></tr><tr><td><= 19 years</td><td>2 (0.8%)</td><td>138 (0.6%)</td><td rowspan="3">0.009</td></tr><tr><td>20 to 34 years</td><td>205 (82.7%)</td><td>21112 (88.8%)</td></tr><tr><td>>= 35 years</td><td>41 (16.5%)</td><td>2512 (10.6%)</td></tr><tr><td colspan="4">BMI, n (%)</td></tr><tr><td>Underweight</td><td>0 (0.0%)</td><td>486 (2.0%)</td><td rowspan="6"><0.001</td></tr><tr><td>Normal weight</td><td>22 (8.9%)</td><td>7568 (31.8%)</td></tr><tr><td>Overweight</td><td>63 (25.4%)</td><td>9337 (39.3%)</td></tr><tr><td>Class I obese</td><td>82 (33.1%)</td><td>4664 (19.6%)</td></tr><tr><td>Class II obese</td><td>45 (18.1%)</td><td>1289 (5.4%)</td></tr><tr><td>Class III obese</td><td>36 (14.5%)</td><td>418 (1.8%)</td></tr><tr><td colspan="4">Parity, n (%)</td></tr><tr><td>Primiparous</td><td>179 (72.2%)</td><td>13047 (54.9%)</td><td><0.001</td></tr><tr><td>Multiparous</td><td>69 (27.8%)</td><td>10715 (45.1%)</td><td></td></tr><tr><td colspan="4">Gestational age, n (%)</td></tr><tr><td>Preterm</td><td>44 (17.7%)</td><td>4594 (19.3%)</td><td rowspan="2">0.528</td></tr><tr><td>Term</td><td>204 (82.3%)</td><td>19168 (80.7%)</td></tr><tr><td colspan="4">Labour, n (%)</td></tr><tr><td>Elective</td><td>60 (24.2%)</td><td>13525 (56.9%)</td><td rowspan="2">< 0.001</td></tr><tr><td>Emergency</td><td>188 (75.8%)</td><td>10237 (43.1%)</td></tr><tr><td colspan="4">Hypertensive disorders, n (%)</td></tr><tr><td>Yes</td><td>55 (22.2%)</td><td>4475 (18.8%)</td><td rowspan="2">0.180</td></tr><tr><td>No</td><td>193 (77.8%)</td><td>19287 (81.2%)</td></tr><tr><td colspan="4">DM, n (%)</td></tr><tr><td>Yes</td><td>86 (34.7%)</td><td>7786 (32.8%)</td><td rowspan="2">0.524</td></tr><tr><td>No</td><td>162 (65.3%)</td><td>15976 (67.2%)</td></tr><tr><td colspan="4">Autoimmune disease, n (%)</td></tr><tr><td>Yes</td><td>5 (2.0%)</td><td>407 (1.7%)</td><td rowspan="2">0.904</td></tr><tr><td>No</td><td>243 (98.0%)</td><td>23355 (98.3%)</td></tr><tr><td colspan="4">PROM/PPROM, n (%)</td></tr><tr><td>Yes</td><td>60 (24.2%)</td><td>1371 (5.8%)</td><td rowspan="2">< 0.001</td></tr><tr><td>No</td><td>188 (75.8%)</td><td>22391 (94.2%)</td></tr><tr><td colspan="4">PPH, n (%)</td></tr><tr><td>Yes</td><td>33 (13.3%)</td><td>1630 (6.9%)</td><td rowspan="2">< 0.001</td></tr><tr><td>No</td><td>215 (86.7%)</td><td>22132 (93.1%)</td></tr></table>
Table 3: Logistic Regression to Assess the Risk Factors of SSI
<table><tr><td rowspan="2">Variables</td><td colspan="2">Univariate analysis</td><td colspan="2">Multivariable analysis</td></tr><tr><td>Crude odds ratio (95%CI)</td><td>P-value</td><td>Adjusted odds ratio (95%CI)</td><td>P-value</td></tr><tr><td>Age group</td><td></td><td></td><td></td><td></td></tr><tr><td>>=35 years</td><td>(Ref)</td><td></td><td></td><td></td></tr><tr><td>20 to 34 years</td><td>0.595 (0.424-0.834)</td><td>0.003</td><td>0.551 (0.385-0.789)</td><td>0.001</td></tr><tr><td><=19 years</td><td>0.888 (0.213-3.709)</td><td>0.871</td><td>0.716 (0.165-3.112)</td><td>0.656</td></tr><tr><td>BMI</td><td></td><td></td><td></td><td></td></tr></table>
Table 4: Comparison of Basic and Obstetric Characteristics between Elective and Emergency
<table><tr><td>Normal</td><td>(Ref)</td><td></td><td></td><td></td></tr><tr><td>Underweight</td><td>-</td><td>0.966</td><td>-</td><td>0.965</td></tr><tr><td>Overweight</td><td>2.321 (1.427-3.775)</td><td>0.001</td><td>2.332 (1.432-3.799)</td><td>0.001</td></tr><tr><td>Class I obese</td><td>6.048 (3.772-9.696)</td><td><0.001</td><td>6.548 (4.071-10.530)</td><td><0.001</td></tr><tr><td>Class II obese</td><td>12.009 (7.188-20.065)</td><td><0.001</td><td>14.061 (8.360-23.650)</td><td><0.001</td></tr><tr><td>Class III obese</td><td>29.627 (17.274-50.812)</td><td><0.001</td><td>37.349 (21.444-65.051)</td><td><0.001</td></tr><tr><td>Parity</td><td></td><td></td><td></td><td></td></tr><tr><td>Primiparous</td><td>(Ref)</td><td></td><td></td><td></td></tr><tr><td>Multiparous</td><td>0.469 (0.355-0.62)</td><td><0.001</td><td>0.812 (0.588-1.120)</td><td>0.204</td></tr><tr><td>Gestational age</td><td></td><td></td><td></td><td></td></tr><tr><td>Term</td><td>(Ref)</td><td></td><td></td><td></td></tr><tr><td>Preterm</td><td>0.9 (0.649-1.248)</td><td>0.528</td><td></td><td></td></tr><tr><td>Labour</td><td></td><td></td><td></td><td></td></tr><tr><td>Elective</td><td>(Ref)</td><td></td><td></td><td></td></tr><tr><td>Emergency</td><td>4.14 (3.092-5.542)</td><td><0.001</td><td>3.822 (2.735-5.340)</td><td><0.001</td></tr><tr><td>Hypertensive disorders</td><td></td><td></td><td></td><td></td></tr><tr><td>No</td><td>(Ref)</td><td></td><td></td><td></td></tr><tr><td>Yes</td><td>1.228 (0.909-1.660)</td><td>0.181</td><td></td><td></td></tr><tr><td>DM</td><td></td><td></td><td></td><td></td></tr><tr><td>No</td><td>(Ref)</td><td></td><td></td><td></td></tr><tr><td>Yes</td><td>1.089 (0.837-1.417)</td><td>0.524</td><td></td><td></td></tr><tr><td>Autoimmune disease</td><td></td><td></td><td></td><td></td></tr><tr><td>No</td><td>(Ref)</td><td></td><td></td><td></td></tr><tr><td>Yes</td><td>1.181 (0.484-2.878)</td><td>0.715</td><td></td><td></td></tr><tr><td>PPROM/PROM</td><td></td><td></td><td></td><td></td></tr><tr><td>No</td><td>(Ref)</td><td></td><td></td><td></td></tr><tr><td>Yes</td><td>5.212 (3.878-7.006)</td><td><0.001</td><td>3.750 (2.731-5.149)</td><td><0.001</td></tr><tr><td>PPH</td><td></td><td></td><td></td><td></td></tr><tr><td>No</td><td>(Ref)</td><td></td><td></td><td></td></tr><tr><td>Yes</td><td>2.084 (1.440-3.017)</td><td><0.001</td><td>1.711 (1.167-2.508)</td><td>0.006</td></tr></table>
<table><tr><td>Variables</td><td>Elective(n=60)</td><td>Emergency (n=188)</td><td>P value</td></tr><tr><td colspan="4">Age, n (%)</td></tr><tr><td><=19 years</td><td>0 (0.0%)</td><td>2 (1.1%)</td><td rowspan="3">0.527</td></tr><tr><td>20 to 34 years</td><td>48 (80.0%)</td><td>157 (83.5%)</td></tr><tr><td>>=35 years</td><td>12 (20.0%)</td><td>29 (15.4%)</td></tr><tr><td colspan="4">BMI, n (%)</td></tr><tr><td>Underweight</td><td>0 (0.0%)</td><td>0 (0.0%)</td><td rowspan="6">0.034</td></tr><tr><td>Normal weight</td><td>3 (5.0%)</td><td>19 (10.1%)</td></tr><tr><td>Overweight</td><td>12 (20.0%)</td><td>51 (27.1%)</td></tr><tr><td>Class I obese</td><td>19 (31.7%)</td><td>63 (33.5%)</td></tr><tr><td>Class II obese</td><td>10 (16.7%)</td><td>35 (18.6%)</td></tr><tr><td>Class III obese</td><td>16 (26.7%)</td><td>20 (10.6%)</td></tr><tr><td colspan="4">Hypertensive disorders, n (%)</td></tr><tr><td>Yes</td><td>14 (23.3%)</td><td>41 (21.8%)</td><td rowspan="2">0.804</td></tr><tr><td>No</td><td>46 (76.7%)</td><td>147 (78.2%)</td></tr><tr><td colspan="4">DM, n (%)</td></tr><tr><td>Yes</td><td>22 (36.7%)</td><td>64 (34.0%)</td><td rowspan="2">0.71</td></tr><tr><td>No</td><td>38 (63.3%)</td><td>124 (66.0%)</td></tr><tr><td colspan="4">Autoimmune disease, n (%)</td></tr><tr><td>Yes</td><td>1 (1.7%)</td><td>4 (2.1%)</td><td rowspan="2">0.825</td></tr><tr><td>No</td><td>59 (98.3%)</td><td>184 (97.9%)</td></tr><tr><td colspan="4">PROM/PPROM, n (%)</td></tr><tr><td>Yes</td><td>7 (11.7%)</td><td>53 (28.2%)</td><td rowspan="2">0.009</td></tr><tr><td>No</td><td>53 (88.3%)</td><td>135 (71.8%)</td></tr><tr><td colspan="4">PPH, n (%)</td></tr><tr><td>Yes</td><td>7 (11.7%)</td><td>26 (13.8%)</td><td rowspan="2">0.668</td></tr><tr><td>No</td><td>53 (88.3%)</td><td>162 (86.2%)</td></tr><tr><td colspan="4">Parity, n (%)</td></tr><tr><td>Primiparous</td><td>27 (45.0%)</td><td>152 (80.9%)</td><td rowspan="2"><0.001</td></tr><tr><td>Multiparous</td><td>33 (55.0%)</td><td>36 (19.1%)</td></tr><tr><td colspan="4">Gestational age, n (%)</td></tr><tr><td>Preterm</td><td>6 (10.0%)</td><td>38 (20.2%)</td><td rowspan="2">0.071</td></tr><tr><td>Term</td><td>54 (90.0%)</td><td>150 (79.8%)</td></tr><tr><td colspan="4">Chorioamnionitis, n (%)</td></tr><tr><td>Yes</td><td>0 (0.0%)</td><td>5 (2.7%)</td><td rowspan="2">0.202</td></tr><tr><td>No</td><td>60 (100.0%)</td><td>183 (97.3%)</td></tr><tr><td colspan="4">Intrapartum pyrexia, n (%)</td></tr><tr><td>Yes</td><td>0 (0.0%)</td><td>16 (8.5%)</td><td rowspan="2">0.019</td></tr><tr><td>No</td><td>60 (100.0%)</td><td>172 (91.5%)</td></tr><tr><td colspan="4">Anemia, n (%)</td></tr><tr><td>Yes</td><td>7 (11.7%)</td><td>25 (13.3%)</td><td rowspan="2">0.743</td></tr><tr><td>No</td><td>53 (88.3%)</td><td>163 (86.7%)</td></tr><tr><td colspan="4">Type of SSI, n (%)</td></tr><tr><td>Deep</td><td>1 (1.7%)</td><td>1 (0.5%)</td><td rowspan="2">0.392</td></tr><tr><td>Superficial</td><td>59 (98.3%)</td><td>187 (99.5%)</td></tr><tr><td colspan="4">Singleton/Multifetal, n (%)</td></tr><tr><td>Multifetal</td><td>4 (6.7%)</td><td>14 (7.4%)</td><td rowspan="2">0.805</td></tr><tr><td>Singleton</td><td>56 (93.3%)</td><td>174 (92.6)</td></tr><tr><td colspan="4">Induction of labour, n (%)</td></tr><tr><td>Yes</td><td>8 (13.3%)</td><td>102 (54.3%)</td><td rowspan="2"><0.001</td></tr><tr><td>No</td><td>52 (86.7%)</td><td>86 (45.7%)</td></tr><tr><td colspan="4">Number of vaginal examinations after setting into labour, n (%)</td></tr><tr><td>1 to 4</td><td>2 (3.3%)</td><td>81 (43.1%)</td><td rowspan="4"><0.001</td></tr><tr><td>>=5</td><td>0 (0.0%)</td><td>29 (15.4%)</td></tr><tr><td>Not done</td><td>58 (96.7%)</td><td>70 (37.2%)</td></tr><tr><td>Data not available</td><td>0 (0.0%)</td><td>8 (4.3%)</td></tr><tr><td colspan="4">Antibiotic prophylaxis, n(%)</td></tr><tr><td><30 mins</td><td>32 (53.3%)</td><td>93 (49.5%)</td><td rowspan="3">0.683</td></tr><tr><td>>=30 mins</td><td>27 (45.0%)</td><td>88 (46.8%)</td></tr><tr><td>Date not available</td><td>1 (1.7%)</td><td>7 (3.7%)</td></tr><tr><td colspan="4">Duration of the surgery, n(%)</td></tr><tr><td><=45 mins</td><td>47 (78.3%)</td><td>135 (71.8%)</td><td rowspan="3">0.579</td></tr><tr><td>>45 mins</td><td>10 (16.7%)</td><td>43 (22.9%)</td></tr><tr><td>Data not available</td><td>3 (5.0%)</td><td>10 (5.3%)</td></tr></table>
Table 5: Distribution of Organisms Isolated in SSI Cases by Clinical Conditions
<table><tr><td>Type of organism</td><td>HTN (n=55)</td><td>DM (n=86)</td><td>Autoimmune disease (n=5)</td><td>PPROM/PROM (n=60)</td><td>PPH (n=33)</td></tr><tr><td>E. Coli</td><td>15 (27.3%)</td><td>21 (24.4%)</td><td>3 (60%)</td><td>16 (26.7%)</td><td>5 (15.2%)</td></tr><tr><td>Staphylococcus aureus</td><td>11 (20%)</td><td>16 (18.6%)</td><td>0 (0%)</td><td>6 (10%)</td><td>9 (27.3%)</td></tr><tr><td>Enterococcus faecalis</td><td>5 (9.1%)</td><td>10 (11.6%)</td><td>0 (0%)</td><td>15 (25%)</td><td>4 (12.1%)</td></tr><tr><td>Klebsiella pneumonia</td><td>7 (12.7%)</td><td>12 (14%)</td><td>0 (0%)</td><td>13 (21.7%)</td><td>8 (24.2%)</td></tr><tr><td>Klebsiella oxytoca</td><td>4 (7.3%)</td><td>5 (5.8%)</td><td>0 (0%)</td><td>3 (5%)</td><td>1 (3%)</td></tr><tr><td>Pseudomonas aeruginosa</td><td>4 (7.3%)</td><td>4 (4.7%)</td><td>1 (20%)</td><td>1 (1.7%)</td><td>2 (6.1%)</td></tr><tr><td>Proteus mirabilis</td><td>3 (5.5%)</td><td>5 (5.8%)</td><td>0 (0%)</td><td>0 (0%)</td><td>0 (0%)</td></tr><tr><td>Proteus vulgaris</td><td>0 (0%)</td><td>2 (2.3%)</td><td>0 (0%)</td><td>0 (0%)</td><td>0 (0%)</td></tr><tr><td>Acinetobacter</td><td>1 (1.8%)</td><td>0 (0%)</td><td>0 (0%)</td><td>0 (0%)</td><td>0 (0%)</td></tr><tr><td>Enterobacter aerogenes</td><td>0 (0%)</td><td>1 (1.2%)</td><td>0 (0%)</td><td>0 (0%)</td><td>0 (0%)</td></tr><tr><td>Streptococcus spp</td><td>0 (0%)</td><td>1 (1.2%)</td><td>0 (0%)</td><td>1 (1.7%)</td><td>0 (0%)</td></tr><tr><td>No growth</td><td>8 (14.5%)</td><td>12 (14%)</td><td>1 (20%)</td><td>6 (10%)</td><td>5 (15.2%)</td></tr></table>
Table 6: Gram Negative Antibiogram for 5 years for LSCS Wound swabs
<table><tr><td></td><td>n=</td><td>Amikacin</td><td>Gentamycin</td><td>Cefoperazone sulbactam</td><td>Piperacillin Tazobatum</td><td>Levofloxacin</td><td>Meropenem</td><td>Amoxyclav</td><td>Cefepime-Vth</td><td>Cefalexin-1st</td><td>Cefazolin-1st</td><td>Cefuroxime-llnd</td><td>Cefexime-llrd</td><td>Ceftazidime-llrd</td><td>Cefotaxim-llrd</td><td>Ceftazoxime-llrd</td></tr><tr><td>E coli</td><td>257</td><td>99</td><td>95</td><td>98</td><td>94</td><td>90</td><td>98</td><td>63</td><td>87</td><td>36</td><td>36</td><td>40</td><td>65</td><td>74</td><td>69</td><td>72</td></tr><tr><td>Klebsiella</td><td>125</td><td>98</td><td>97</td><td>100</td><td>99</td><td>99</td><td>100</td><td>45</td><td>87</td><td>28</td><td>28</td><td>38</td><td>69</td><td>70</td><td>66</td><td>70</td></tr></table>
Table 7: Gram Positive Antibiogram for 5 years for LSCS Wound swabs
<table><tr><td></td><td>n</td><td>Vancomycin</td><td>Linezolid</td><td>Piperacillin Tazob atum</td><td>Levofloxacin</td><td>Ciprofloxacin</td><td>Amoxycilin</td><td>Amoxycillin</td><td>Ampicillin</td><td>Penicillin</td><td>Clindamycin</td><td>Erythromycin</td></tr><tr><td>Staphylococcus aureus</td><td>87</td><td>-</td><td>100</td><td>100</td><td>98</td><td>73</td><td>100</td><td>100</td><td>-</td><td>100</td><td>98</td><td>83</td></tr><tr><td>Enterococcus faecalis</td><td>55</td><td>100</td><td>100</td><td>100</td><td>97</td><td>96</td><td>91</td><td>91</td><td>82</td><td>85</td><td>-</td><td></td></tr></table>
## ACKNOWLEDGEMENTS
We would like to acknowledge all the clinicians and health care workers for maintaining the standard infection control practices. We would also like to acknowledge Ms Thankamani for helping us extract the data and Mr Anantha Ghimire for guiding us with the analysis.
Conflict of interest: The authors declare that they have no conflicts of interest.
Author contributions: NP, SG, SAD, PCR, were involved in patient care and data collection. NP and PCR commented and edited the paper. NP and PCR were responsible for data analysis, the write up the first draft and revision of the paper. All authors checked, interpreted results and approved the final version.
Funding: None
Ethical approval: This study was approved by the Institutional Review Board (IRB) EC Ref No38-2023. This study was conducted in accordance with the 1964 Helsinki Declaration and its later amendments or comparable ethical standards.
Informed consent: N/A
Generating HTML Viewer...
Funding
No external funding was declared for this work.
Conflict of Interest
The authors declare no conflict of interest.
Ethical Approval
No ethics committee approval was required for this article type.
Data Availability
Not applicable for this article.
Nirupama Padmaja Bondili. 2026. \u201cExploring the Incidence and Determinants of Surgical Site Infections in Caesarean Sections: A Five-Year Study\u201d. Global Journal of Medical Research - E: Gynecology & Obstetrics GJMR-E Volume 24 (GJMR Volume 24 Issue E2): .
Our website is actively being updated, and changes may occur frequently. Please clear your browser cache if needed. For feedback or error reporting, please email [email protected]
×
This Page is Under Development
We are currently updating this article page for a better experience.
Thank you for connecting with us. We will respond to you shortly.