I. BACKGROUND
Natural hazard causes enormous damages in the form of human casualties, infrastructure destruction and economic losses and socio-psychological effect at all level in many parts of the world. Nepal is among the 20 most disaster-prone countries in the world and more than 80 percent of the total population of Nepal is at risk from one or another type of natural hazard (MoHA, 2018). With the fragile geology and topography, the country is highly vulnerable to natural hazards like, earthquake, landslide and flood. During the last 45 years period (1971-2015), occurrence of 3720 flood events, 3012 landslide events and 175 earthquake events have been recorded causing human and physical damages(MoHA, 2016). By the one year period of 2015-2016, number of flood events increased by 230, and 234 more landslide events have been recorded causing increased life and property damages (MoHA, 2018). Natural hazard are spatial phenomena and most are location specific. Chure (Siwalik) region of the country is very fragile and prone to different kind of hazards. The region is classified into different hazard susceptibility zone based on the topography, geology, geo-morphology and climate. More than 34 percent is found to be under the high-susceptible category followed by 41 percent the medium-susceptible category. Similarly, approximately 12% of the total area of the Tarai and Inner Terai lies in the region susceptible to flood and inundation (PCTMCDB, 2017). Risk-informed development and sociologically comprehensive approach for managing disasters are two guiding principles of Disaster Risk Reduction and Management Act of Nepal (MoHA,2018).
Managing risks rather than managing disasters becomes inherent to the process of development (UNISDR, 2015). Disaster risk reduction and management requires reducing the exposure or vulnerability of communities and assets to hazards through policies, structural measures and planning tools. Managing the underlying risk of disaster is very slow in many countries as it requires understanding of risk and risk management approaches (Zhou et. al., 2016). New risk are generated and accumulated in failing to understand and manage the existing risk. Understanding the frequency, intensity and spatial distribution of hazard events and associated risk augment effective disaster risk reduction and management.
Uncertainty of magnitude and occurrence in space and time makes natural hazard more alarming and hence low risk anticipation and preparedness least prioritized. Risk identification is the first step to disaster risk management for identifying and understanding the scale of problem. Identifying risk and understanding risk perception helps framing and supporting DRM policy, mitigation and adaptation strategies. The association between the natural hazard and social vulnerability of local area is emergent natural hazard and disaster analysis issue. Yet, Risk perception tend to be poorly reflected in many social vulnerability indicators (Rufat et. al., 2015).
Increased intensity of monsoon, changes in rainfall pattern and skewed temporal results in hazard like flooding and landslides. Local people in many parts are reliant on and accustomed to traditional/indigenous knowledge and local adaptation practices. However, traditional knowledge and indigenous practices are not yet considered important part of policies for disaster mitigation. Integration of scientific process, along with indigenous, traditional and conventional practices is emphasized for a national and regional policy through a participatory process (Dewan, 2014). Studies on hazard risk perception and understanding exhibit that better understanding ensure knowledge empowerment and effective management to achieve community resilience and sustainability (Rakib et. al., 2017). Public perceptions of risk are equally important as much as technological and scientific risk assessments (Tierney, Lindell and Perry, 2001).
The two major components of vulnerability are physical and social vulnerability to consider while disaster risk management. However, integrated study on physical vulnerability in terms of hazard susceptibility mapping and social vulnerability in terms of hazard and associated risk is less focused, which have direct effect on the disaster risk reduction and adaptation strategy of local people. In this context, the current study is an attempt firstly to assess landslide and flood susceptibility and physical vulnerability of built-up area and to explore the hazard risk perception in terms of type and severity, control factors, exposure and level of risk.
II. CONCEPT
Risk is regarded as function of hazard, exposure and vulnerability (IBRD, 2014). According to Varnes (1984), risk is referred to as 'the expected number of loss of lives and injuries, damage to property and disruption of economic activity due to a particular damaging phenomenon for a given area and reference period'. Risk can be quantified as a product of vulnerability for assessing physical loss such as buildings and built up area, amount of the elements at risk and probability of occurrence (van Wasten and van Asch, 2006). Risk perception has been conceptualized as the relationship between risk awareness, worry about risk, and preparedness (Wachinger et. al., 2013).
Vulnerability is defined and understood from various perspectives. Physical vulnerability is associated with geo-physical and locational attributes whereas and social vulnerability is associated with socio-cultural and economic setting (ADPC, 2010). It describes the characteristics and circumstances of the community (UNISDR, 2015). Spatial analysis tools and GIS are most common tools to analyze physical vulnerability (Brody et. al., 2008). Exposure to hazard is regarded as external side of vulnerability whereas coping capacity and adaptation is regarded as internal side (Bohle, 2001).
Susceptibility is expressed as the potential for hazard occurrence as a function of geo-environmental and morphological controls (Gonçalves and Zezere, 2018). Various approaches are suggested for susceptibility mapping. Three different approaches has been listed for landslide hazard risk zonation, namely, heuristic qualitative approach for small scale, statistical quantitative approaches for medium scale and deterministic approach for detailed studies at large scale (van Westen, 2000). Qualitative/heuristic and statistical and physically based quantitative approaches are most common methods of susceptibility analysis. Spatial distribution of landslides is regarded as the essential element for the analysis regardless of which approach is applied. However, the problem of attempting to quantify landslide risk over larger areas for landslide assessment and hazard zonation is discussed in van Wasten and van Asch (2006).
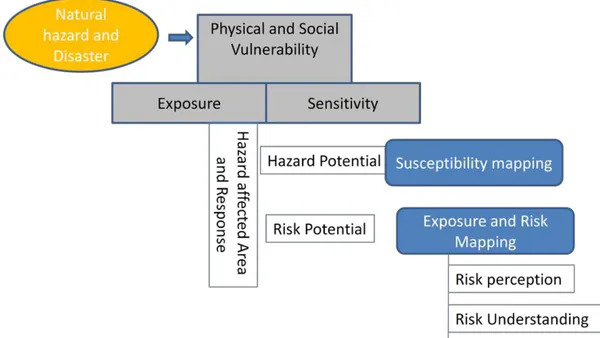
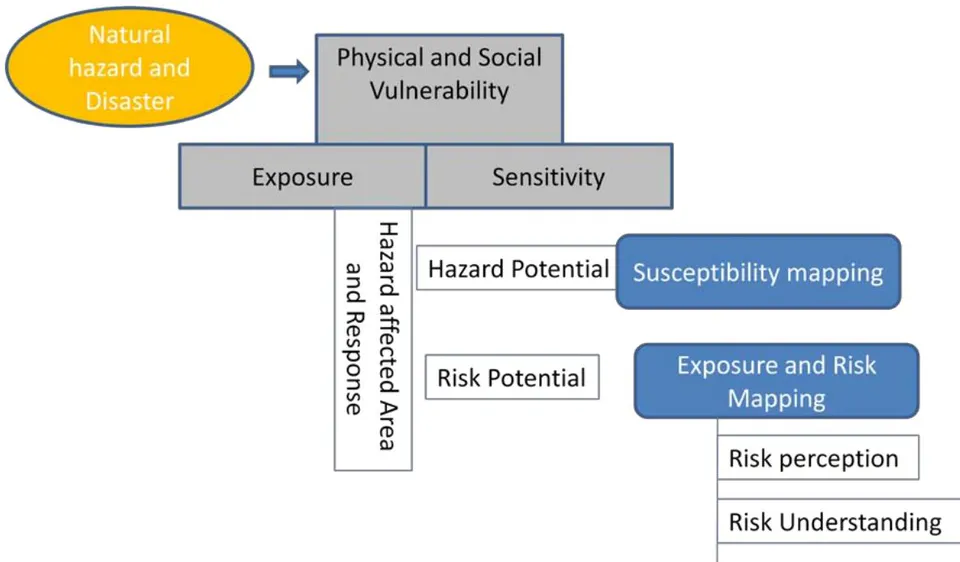
The relationship between actual and perceived risk is driven by specific types of physical conditions and experiences. The role of place and proximity in shaping the hazard risk perceptions is suggested (Brody et. al., 2008). Bounded rationality, Sense of place and Place attachment is associated to geographic proximity, experience and hazard risk perception (Mishra et. al., 2010). Place attachment contributes to amplifying high probability risks and attenuates the perception of low probability ones (Bernardo, 2013). Four categories of psychological distance namely, spatial, temporal, social, and uncertainty are identified by Spence et al. (2012). Studies show that hazard proximity can influence risk perception among individuals. Studies also show that direct personal experience of damage caused by hazard is one of the most important perceived risk factor.(exposure to hazard). A conceptual framework for the study is developed (Figure 1) based on the aforementioned concepts.
III. DATA AND METHODS
The study is based on a socio-physical research approach and both quantitative and qualitative method has been adopted. Both primary and secondary data sources have been used. The study adopted literature review, GIS based susceptibility mapping and field observation as key methods and tools for landslide and flood hazard risk assessment. Sample household survey using checklist, KIS, FGD and informal discussion and field observation are methods and tool devised to explore risk perception.
a) Data and method for hazard risk susceptibility (Physical Vulnerability)
GIS tool is used for mapping landslide and flood susceptibility. Spatial data layers used for landslide susceptibility include: existing landslides, slope, aspect, geology, soil type, drainage density, distance, land use, historical records. Spatial data layers used for flood susceptibility include: Slope, distance to drainage, Land use, geomorphology, historical records. Spatial data sources include digital topographical data sets from Survey Department, Nepal, Google Earth platform images and field observation.
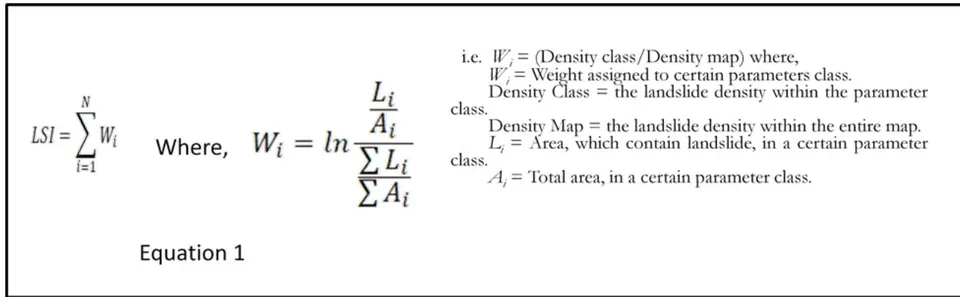
Susceptibility mapping was based on multi criteria evaluation with density based weighted index suggested by van Westen et. al. (1997) and calculated using Equation 1. Landslide and flood susceptibility was assessed and validated using a bi-variate statistical method. 30*30 meter grid is used as spatial mapping unit for landslide and flood susceptibility analysis.
b) Data and method for Risk Perception Analysis (Social Vulnerability)
The purposive random sampling was used for sample household selection in order to analyze the risk perception. Total of 60 household was selected for risk perception analysis 5 from each ward for all six stratified classes. Distribution of sample household is shown in Table 1. The sample was stratified into three groups low, moderate and high risk zone by wards for each hazard type. Household sample is selected from each which consist the highest percentage of area coverage in terms of susceptibility class. To determine the household location, building location information for each respondent that was collected from GIS database and located in the field. This GIS database of building allowed to locate the geographic coordinates (latitude/longitude), geospatially locate each sampled household.
| Ward | Landslide susceptible zone | Flood susceptible zone | ||||
| High | Moderate | Low | High | Moderate | Low | |
| 2 | ***** | ***** | ||||
| 4 | ***** | ***** | ||||
| 5 | ***** | ***** | ||||
| 6 | ***** | ***** | ||||
| 7 | ***** | ***** | ||||
| 11 | ***** | ***** | ||||
The respondents were asked to indicate the occurrence and extent of risk of three hazard types namely: earthquake, flooding and landslides based on a three-point Likert scale. Data and information on vulnerability, exposure and geographic proximity, awareness and knowledge also collected through standard checklist. Besides, 2 key informant who have direct experience of hazard event from each ward were interviewed. Three focus group discussion, FGD was carried out with mixed group of 8 to 10 people in public open space. Informal discussion was also carried out with local ward representatives.
IV. STUDY AREA
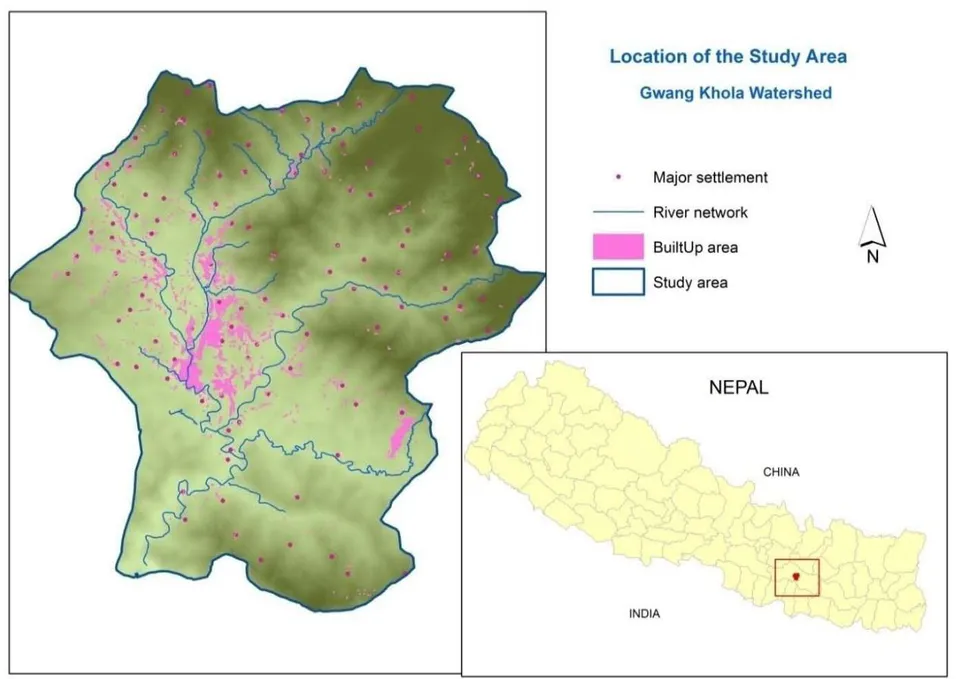
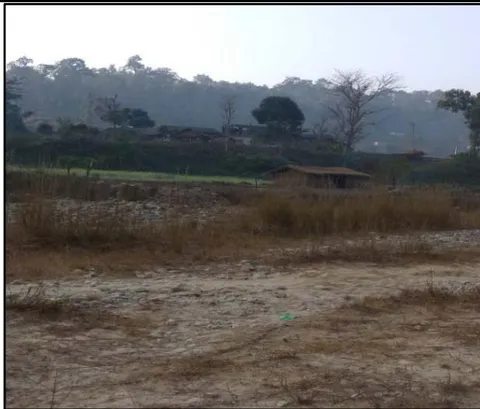
Gwang Khola, flowing from north to south, is one of the major river of the Kamalamai municipality, Sindhuli district of Nepal (Figure, 1). It joins Kamala river in the south which is the biggest river of the district. Gwang Khola watershed is selected as study area which lies within Kamalamai municipality and accounts the total area of 95.9 Km . Elevation range from 402 to 1595 meter from mean sea level. The watershed has mountainous area crossed by rugged topography with large flood plain towards south. The study area embraces the low hills of inner Churia range (Siwaliks) in the south and Mahabharat range (Lesser Himalaya) in the north composed of younger Cenozic dominant sedimentary rocks. The climatic condition slightly varies with the topography and elevation. The lower flood plain and Chure area has warm summer and dry winter, while the northern high elevation area has warm summer and dry cool winter. The average precipitation is about 2330 mm. per year, which is greater than national average. The highest rainfall is during four months (June-September) of monsoon season which causes water induced hazards like landslide and floods in the watershed.
The forest coverage comprises 60 percent of the total watershed. It is followed by cultivation area comprising 29.4 percent. Built-up area constitute only 3.58 percent of the watershed including tiny commercial and institutional area. The spatial coverage of built-up area and population density accounts low level of urbanization in comparison to other parts of the country. The watershed comprises part of six wards of the municipality covering 20 percent of total municipal area. Dense built-up of the municipality is confined to Gwang Khola flood plain which is largest of the municipality. Of the total built-up area of the municipality (8.6Km ) 41.6 percent (3.58 km ) built-up falls within this watershed. Population density of the watershed is 212 person per Km . Ward number 6 which falls completely within the watershed has the highest population (8976) of the municipality and smallest area (5.9 Km ) with 1521 person per Km (DDC Sindhuli, 2018).
In terms of natural hazards, earthquake, landslide and flood are three major hazards risk of the watershed. According to hazard risk assessment report (GoN, ADPC, NGI and CECI, 2010) earthquake hazard risk is high for 100 year return period and moderate for 50 year return period. Ninety-seven percent of the household is exposed to moderate to high earthquake risk. The area will experience the seismic intensity of VI (Strong: slight damage) and VII (Very strong: slight to moderate damage). Flood risk is of greater than 2m depth for 10 year return period. Similarly, risk of earthquake triggered hazard very high and precipitation triggered landslide hazard risk is moderate to high.
V. RESULT AND DISCUSSION
a) Physical Vulnerability: Landslide and Flood Susceptibility
Physical vulnerability was assess in terms of landslide and flood susceptibility and exposure of built-up and settlement area to different hazard risk zone.
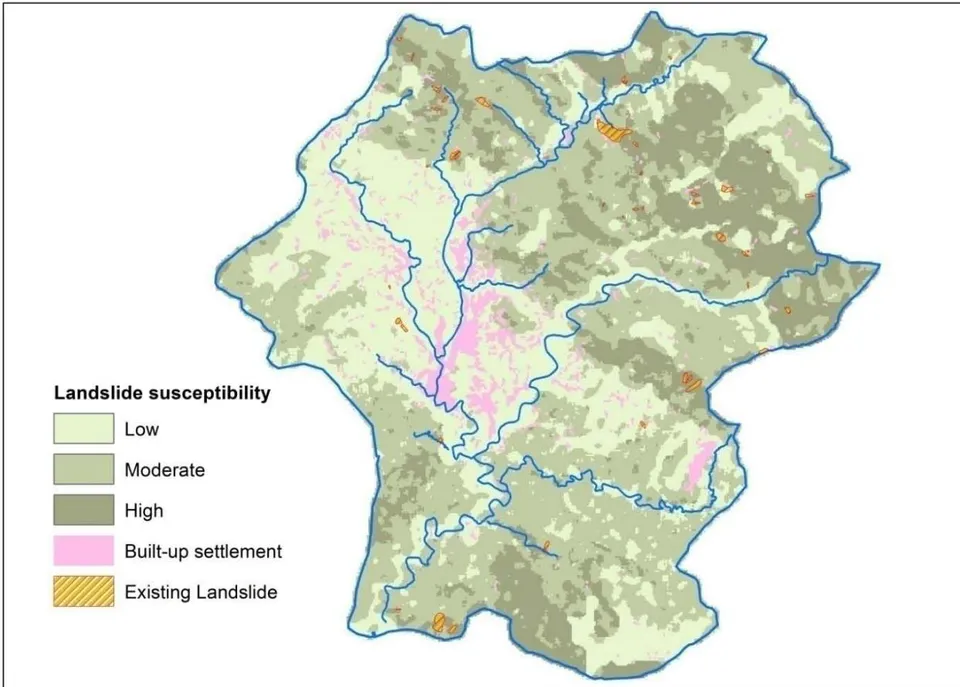
Landslide susceptibility is high in the northern sloping terrains (Figure 3). Of the total watershed, 22 percent area is under high landslide susceptibility. Moderate and low susceptibility account respectively around 39 and 38 percent of the watershed area.
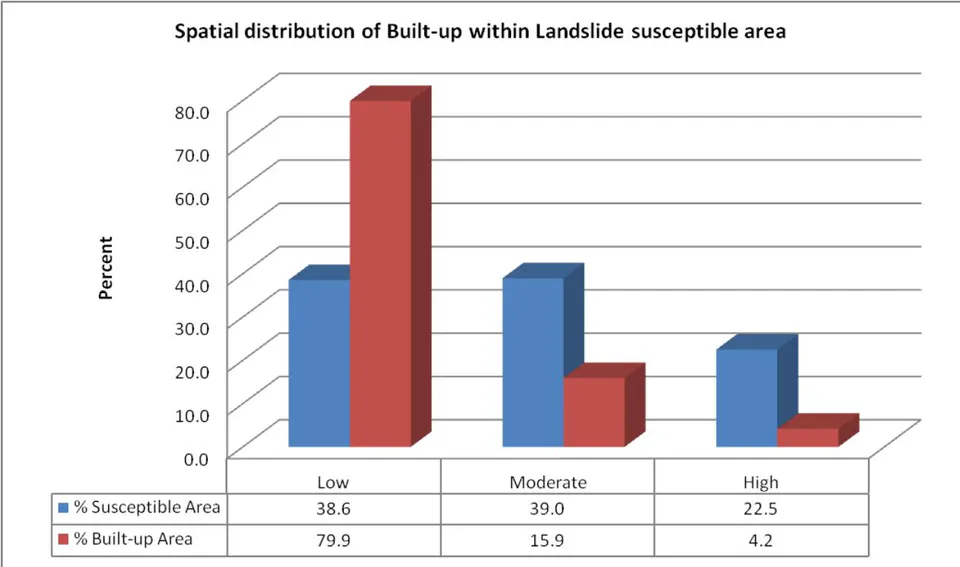
Assessment of exposure of existing built-up show that among total number of buildings (10998), six percent of the existing building (660) are located in high risk zone making them vulnerable to disaster. Thirty-six percent residential building is at risk of moderate and high risk zone. Most of the critical services like health, security and communication are located in low hazard risk zone. Though six percent of the existing building are located in high risk zone, the traditional practice of constructing building on level terraces in most cases show consideration of risk factors by the local people. Spatial distribution of built-up area and landslide susceptibility is detailed in Figure 4. Four percent of the built-up area is exposed to high landslide hazard risk.
b) Flood Hazard
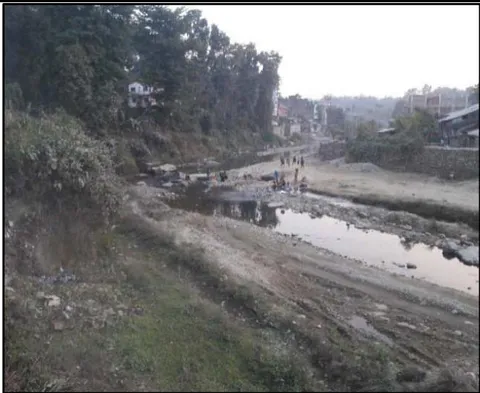
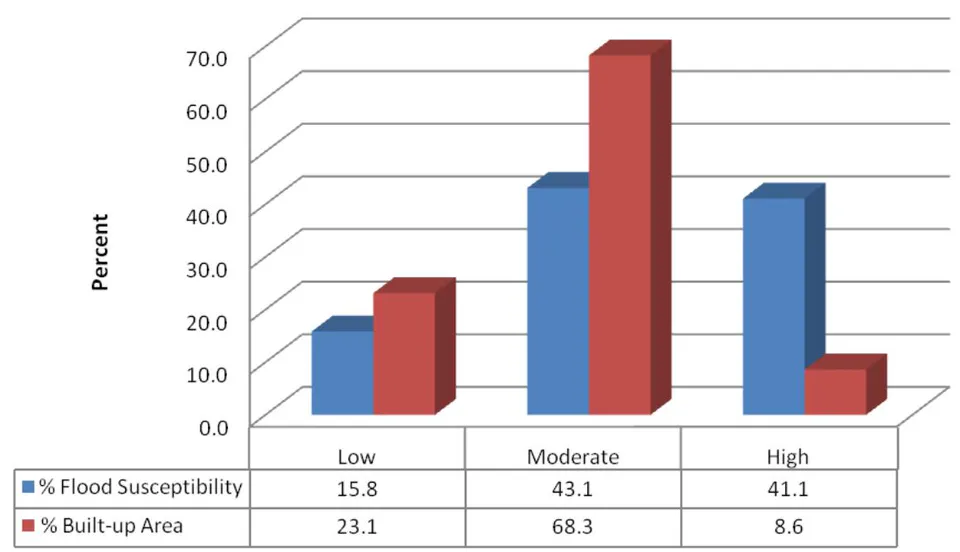
Flash flood is the most common type of disaster that residents this watershed come across. Flooding history of the watershed show that Gwang Khola has the highest frequency of flood event and the highest flood record is of July 1993 which caused the heavy damage. Flood susceptibility is assessed across 250 meter of the river and stream. Flood susceptibility is high in the southern flood plain and patches of eastern and northern part of the watershed (Figure 5). Of the total watershed, 41 percent area is under high susceptibility. Moderate and low susceptibility account respectively around 43 and approximately 16 percent of the watershed area.
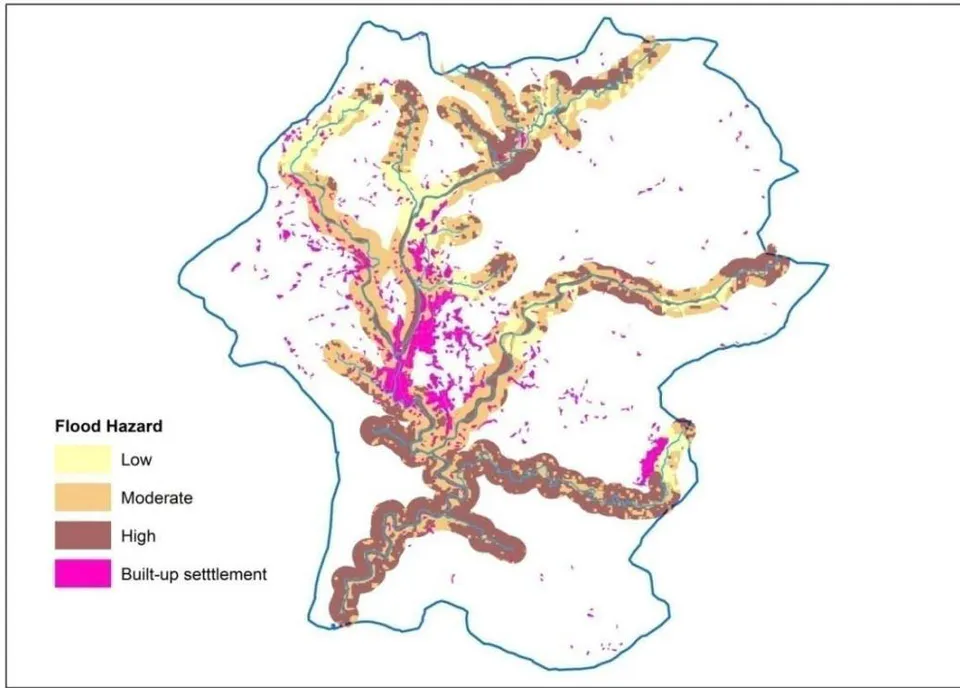
Assessment of exposure of existing built-up show that among total number of buildings(5359) within flood hazard risk zone of 250 meters, 5.5 percent of the existing building (298) are located in high risk zone making them vulnerable to disaster. Fifty-seven percent residential building is at risk of moderate risk zone. Most of the critical services like health, security and communication are located in low and moderate hazard risk zone. Though around 6 percent of the existing building are located in high risk zone, the traditional practice of constructing building in elevated surface is consideration of risk factors by the local people. Spatial distribution of built-up area and flood susceptibility is detailed in Figure 6. More than 8 percent of the built-up area is exposed to high flood hazard risk and more than 68 percent is exposed to moderate flood risk.
c) Social Vulnerability: Risk Perception and Understanding
i Perception on occurrence and risk severity
Due to intensity and relatively recent experience of earthquake event that took place in 2015, landslide and flood hazard risk is perceived as less destructive (Figure 7). Landslide and flood are perceived as regular phenomena and accepted as habitual to everyday life. Landslide and flood hazard events are perceived as location specific and possibility of temporal prediction of occurrence and hence regarded as less damaging. However, magnitude of both hazard risk is perceived as uncertain though people believe that intensity and duration of rainfall help them to predict magnitude of flood and landslide hazard risk to some extent.
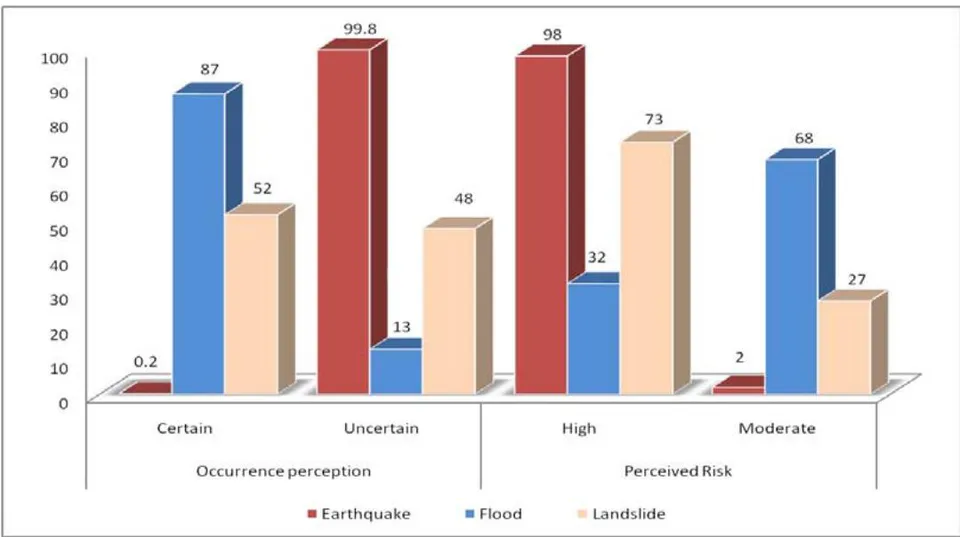
The respondents believe that frequency and risk of flood is high in Terai (southern plain of the country) and has caused most damage. Landslide is perceived less frequent than flood but causes more damage in the hill and mountain area due to steep slope and road construction.
ii Geographic proximity and vulnerability perception
Perception on physical and social vulnerability is examined across geographic proximity of respondents to landslide and flood hazard risk zone. Physical vulnerability is explore in terms of built-up area, building and human loss whereas social vulnerability is explored in terms of understanding, capacity and preparedness. Physical vulnerability is perceived as dominant risk, irrespective of the geographic proximity of the respondents to hazard risk zone (Figure 8).
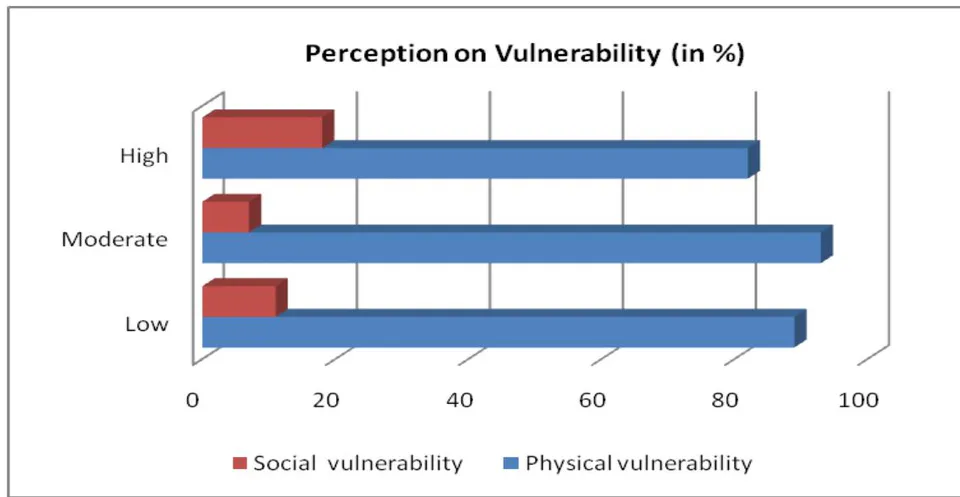
However, respondents who reside proximately to high hazard risk zone anticipated social vulnerability in comparison to those who reside further to high hazard risk zone. people residing in low hazard risk zone anticipated social vulnerability in contrast to people residing in moderate hazard risk zone.
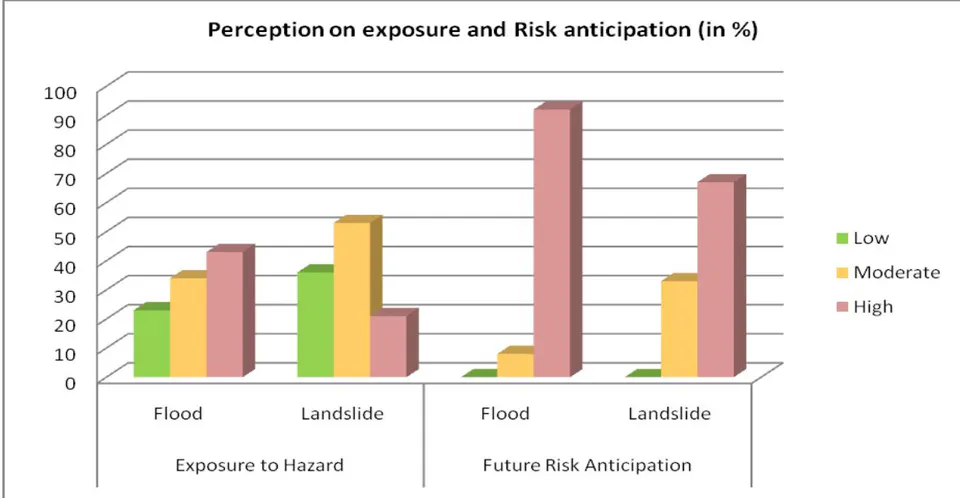
When geographic proximity and hazard specific perception is considered, variable perception is revealed. Those who are within high hazard risk zone of flood expected that they are exposed whereas in case of landside exposure it was not alike (Figure, 9). Similarity is found in case of potential risk anticipation.
iii Experience, Knowledge and awareness
Knowledge and awareness is explored based on individual's direct experience to hazard event. The result reveals that knowledge and awareness regarding exposure and control factor is high among those who have directly experienced the hazard event. Human activities and response is regarded as major controlling factor by those who have experienced the hazard event (Figure 10). Agricultural practices and construction on marginal land encroachment and exploitation of natural resource is identified as major determinant among human control factor whereas topography is considered as major physical controlling factor for flood and landslide hazard events. Risk management and preparedness for potential hazard risk is least admitted even by those who have direct individual experience. Uncertainty of the occurrence of hazard event in particular case of landslide is determinant for preparedness.
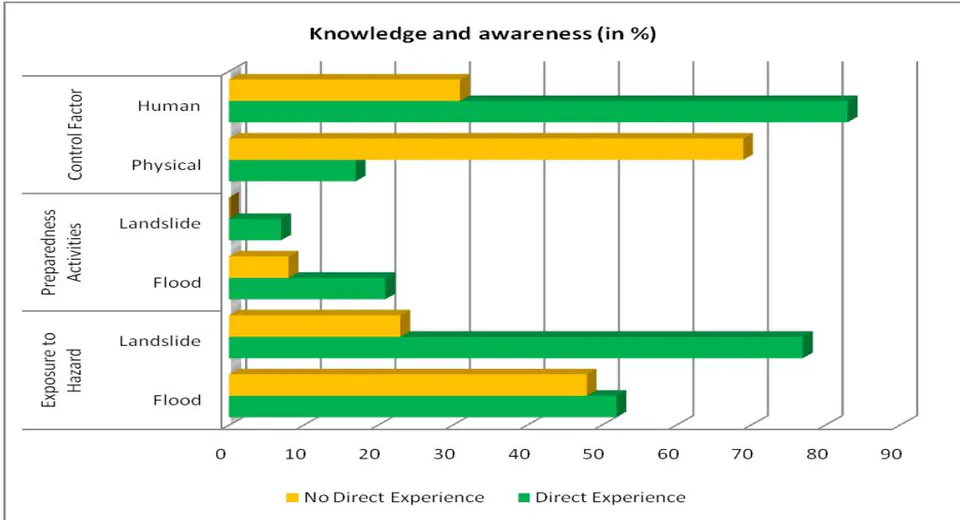
When structural activities and governance is considered as preparedness and local tax for disaster preparedness considered, local people resist on paying tax as support for disaster risk management to the local authority. But they accepted on community funding for the preparedness. Trust towards the authority and attitude over knowledge and awareness is dominant in risk preparedness and anticipation.
VI. DISCUSSION
a) Knowledge and preparedness
The most damaging hazard regarding affected household in last 45 years in Nepal is flood affecting more than 3 million households. But earthquake is perceived as the most destructive hazard regarding life and property. Forest fire and epidemic are causing more human casualties that earthquake (MoHA, 2018). Natural hazard is perceived as Daivi Prakop (Act of God) uncertain, can't be controlled and avoided particularly in case of earthquakes which cannot be predicted. Wachinger and Renn (2010) also found that occurrence of natural hazard can't be prevented and blamed and hence has higher risk perception. In contrast to the finding of current study, technological hazard is perceived more risky than natural hazard in Italy (Salvati et. al, 2014). Studies show that there is significant spatial variation in disaster history in Nepal and localized small-scale disasters collectively are having a greater impact upon society in terms of casualties than national large-scale disasters (Aryal, 2012). However, location specific small scale disaster and casualties are not considered by people while risk perception. It is evident that knowledge in terms of risk perception is localized.
The role of media and local organizations in understanding risk, creating awareness on preparedness is acknowledged though the role of individual household and community are key for implementing the preparedness to reduce disaster loss (Maharjan and Shrestha, 2017). Regardless of the intensity and level of vulnerability, actual damage varies with the adopted mitigation measures and local adaptation capacity to reduce its vulnerability (Walton, 2014). Trust towards the authority and personal attitude surpass knowledge and awareness in case of risk preparedness (Wachinger et. al., 2013, Salvati et. al., 2014).
b) Experience
Risk perception is higher among people having direct personal experiences (Maharjan and Shrestha, 2017; Wachinger et al., 2013) People's risk acceptance and preparedness is determined by direct event experience in contrast to risk perception of potential disaster. However, risk perception of low severity and rare experienced events is lower which may overlook the preparedness and misjudge the ability to cope.
The relationship between actual and perceived risk is driven by specific types of physical conditions and experiences. it is also hypothesized that if people have greater sense of efficacy and affiliation with the social network, people will perceive a greater risk (Brody et. al., 2008). Perceived risk of the rare events is low and ephemeral. Culture and social environment modulate the perception of hazard risk and action towards preparedness. Information received by individual or group from different sources also reshapes the risk perception and action towards risk management (Maharjan and Shrestha, 2017). Preparedness over awareness should be hence emphasized to minimize the risk. Similarly, risk assessment tools and mitigation measures is important for reducing risk (Maharjan and Shrestha, 2018).
c) Geographic Proximity
Most of the research studies have considered role of socio-economic and demographic variables such as age, gender, income, education etc. for perception analysis. Study also reveal that there is an association between cultural belief and sense of place of communities to low risk of awareness and preparedness (Donovan et. al., 2012). Why people resides in the hazard risk area is one of the important underlying social factor imbedded with sense of place and place attachment which shapes the hazard risk management and response system (Askman et.al., 2018). General understanding is that people living closer to hazard risk will be more familiar and possibly more concerned with its severity. Studies also show that location specific physical vulnerability has influence on risk perception (Brody, Highfield, and Alston, 2004). Number of studies have confirmed the direct relationship between proximity and risk perception and identified proximity as determinant factor (Askman et.al., 2018; Arias, et. al., 2017; Lindell and Hwang, 2008). Integration of proximity-based variables such as distance with socioeconomic and demographic variables assist in explaining location based environmental perceptions (Brody et. al., 2004). Attitudes toward and decisions about environmental risk is also associated to importance of place and proximity. Study found that persons residing in higher-risk areas express higher levels of environmental concern, even when adjusting for subjective values (Drori and Yuchtman-Yar's, 2002). Another study found that the greater the distance between the participant's residence (household) and the waterfront, the lower the perceived risk (Arias et. al., 2017). In contrast, other studies have showed that there is no direct relationship and socio-economic and demographic factors controls the proximity Arlikatti et. al., 2006). The current study result showed no significant relationship between geographic proximity and risk perception, regardless of the area of residence of the participant. The contradictory findings is because of different local understanding and ability to understand risk. This is again dependent on the socio-cultural environment one is conditioned and the structural and governance inputs (Lindell and Perry, 2012).
d) Overall Vulnerability and Risk perception
The tendency of researchers is to focus much on the already built environment with visible past destruction, and less on the social and economic vulnerability of the city areas at risk and their spatial association. Focus on physical vulnerability according is largely because of lacking comparability and consistency of census data to address social vulnerability dimensions (Armas and Gavris, 2016). Several research have suggested that higher the levels of risk higher the probability or preparedness (Miceli et al., 2008). Whereas other studies show that people accustomed to occurrence of hazard perceive hazard risk lightly overestimate the personal capacity and ability to control hazard risk (Sjoberg, 2000). In some cases, a higher perception of risk does not necessarily imply a greater preparedness and mitigation actions (Siegrist and Gutscher, 2006).
VII. CONCLUSION
The study concludes that proximity to hazard event location, magnitude of hazard and repetitive occurrence are determining factors on the intensity of risk perception. Decision to live in a high-risk area is associated with sense of place and place attachment. The relevance of the findings is for understanding risk for community preparedness and resilience in increasing urbanization context. Hazard risk with frequent and similar probability of reoccurrence with similar consequences are perceived as less destructive. Individual risk perception varies with the type of hazard, context and geographic setting. Preparedness is attributed to personal attitude over knowledge, experience and awareness. The study concludes that the findings of the research is relevant to community preparedness planning and resilience in increasing urbanization context.
ACKNOWLEDGEMENT
The researcher acknowledges DUDBC for building data and local students for assisting in data and information collection and field verification of buildings and landslides.