
I. INTRODUCTION
The Onyima Creek(Ede Onyima) was the major transport route between the Engennis in Rivers State and the Ogbias in Bayelsa State before constructing any road that links the two tribes. The creek also served as the main basis of freshwater that the inhabitants depends on. The creek receives its water Source from the Orashi River, which is the parent river that supplies water to the creek. The Engenni axis of the creek is called Ede Onyima. The Engenni axis of the creek in the 1980s and beyond used to be a fish haven preserved by the Okarki Community in Engenni. Fishes and aquatic reptiles were in abundance in the creek. The creek was treated as a lake where the dwellers were prevented from fishing by laid down laws of the community. This then culminates into a yearly fishing festival known by the Locals as Holiday Ede Onyima. This very day (the holiday), all activities cease, including government work to enable the inhabitants of Okarki to harvest from the abundance of fishes from the creek. The Engenni axis of this creek presently is under pollution threat due to the presence of petroleum hydrocarbons that enter into the creek as a result of illegal oil bunkering and other associated businesses along the creek and its coast.
The presence of petroleum hydrocarbons in water and sediments of aquatic water bodies are either from natural or anthropogenic sources, which are through spillage, transport, effluents from artisanal refineries, accidental discharges, runoffs from farmlands, oil exploration, biogenic (decomposition by organisms) and, seepage from rocks (Al-Imarah et al., 2010; Farid et al., 2014). Hydrocarbons of biogenic origin in water environments can also be synthesized by plants, algae, zooplankton, bacteria but the major source of hydrocarbons pollution is derived from human-related activities (Al-Saad, 1995).
Total petroleum hydrocarbons are known to be among hazardous materials because they are potential health risks to man and their carcinogenic nature. Petroleum poses health hazards to man after exposure over a long period and can create discomfort and other health challenges in man (especially those in direct contact). (Azhari et al., 2011). Petroleum hydrocarbons in the aquatic settings float and hinder the exchange of oxygen and the penetration of sunlight from reaching the lower depth for phytoplankton, and other aquatic plants to make use for photosynthesis, thereby altering the availability of oxygen in the system (Barbooti, 2011). Certain constituents of petroleum hydrocarbons such as normal alkanes, degraded oils, and combusted fossil fuels have low solubility in water (Wattayakorn, 2012) and therefore clog the penetration of oxygen to lower depth of the aquatic environment. The degree of variability of the oil type and the characteristics of the water that receives the contaminants has a resultant effect on the oil discharged and the degree of pollution that will likely occur (Abel, 2002).
This research work aimed at the determination of the level of the different total petroleum hydrocarbons components in the water and sediments of the Onyima Creek, and also to classify the leading sources and origin of total petroleum hydrocarbons in the creek to establish a data framework for future evaluation of the creek in terms of total petroleum hydrocarbons contamination.
II. MATERIALS AND METHODS
This investigation was carried out between the period of December 2019 to June 2020, at intervals of two months on the water and sediments of the Onyima Creek. Several water samples below the surface were collected from the Onyima Creek monthly and mixed. The samples were collected at about 25-30cm below the water surface with glass bottles and were immediately preserved by adding 25 mlcarbontetra chloride (CCl ), and then transported to the laboratory for pretreatment and chromatographic analysis. The method of UNEP (1989) was adopted to extracting 5L of total petroleum hydrocarbons from the water sample and then mixed with about (25 ml) of CCl for about 20 minutes with the aid of a water mixer. The liquid component was drained out while the petroleum and the remaining (about1L) were then put into an already prepared separator funnel. A mass of 5g weight of Na SO (anhydrous sodium sulphate) was used to dry the organic phase, which was then collected and put into an already prepared glass column. About 25ml n-hexane was used in dissolving the residue. It was then allowed to pass over a glass column of 20 cm, which was packed with 10g of silica gel of 150 mesh size, glass wool at the bottom, about 5 g weight of deactivated alumina of 150 mesh size and then 5g of Na SO (anhydrous sodium sulphate) was added at the top. The total petroleum hydrocarbons components were then eluted with 25ml n-hexane from the glass column. The eluted samples were dried and then stored until the detection of petroleum hydrocarbons components by Gas Chromatography-Flame ionization detector (GC-FID). Helium was used as the carrier gas. The Gas Chromatography-Flame ionization detector was operated at a velocity of 1 ml per minute at a temperature of 280°C and 300°C for the injector and detector respectively for the complete separation of the petroleum hydrocarbons components. The column temperature was maintained at 35°C as an initial temperature for 13 minutes then 5°C per minute to a temperature of 280°C (Al-Hejuje et al., 2015).
Van Veen Grab was used in collecting the sediment samples at a depth of 50cm of the creek from the top of about 5-6cm into the sediment. Sediment samples collected for total petroleum hydrocarbons were preserved in aluminum containers and thermally insulated with iced-park on the top to prevent rapid evaporation and then transported to the laboratory for further treatment before subjecting the samples to chromatographic analysis. Sediment samples were treated according to the method of Emadi Jamali et al (2020). The standard method used was the 3550C EPA (an extraction performed with an ultrasonic device), while the analysis for total petroleum hydrocarbons components, the SW-846 method 8015B, was used. The sediment samples were dried with anhydrous and weighed, and were then ready for extraction. The Surrogate Standards method of 1, 3, Dimethyl-2-nitrobenzene at 250 g/ml in Methyl tert-Butyl Ether) and a solvent mixture of 1:1 dichloromethane/acetone was used. The organic sample extracts were obtained through the use of an ultrasonic machine. The solvent was finally extracted, and then the concentration of the extracted sample was performed and was injected through the vial of the Gas Chromatography-Flame Ionization Detector(GC-FID) (USEPA, 1996).
a) Source Identification and Pollution Markers
Total petroleum hydrocarbons indices used to determine the level of pollution and the origin or sources of total petroleum hydrocarbons in the Ede Onyimaenvironment are shown below.
L/ H Ratio: Low Molecular Weight (L) total petroleum hydrocarbons (n-alkanes) originates through marine biogenic sources, while the High Molecular Weight (H) total petroleum hydrocarbons (n-alkanes) are produced through terrestrial vascular plants (Fagbote and Olanipekun, 2013). L is the Summation of the concentrations of the aliphatic hydrocarbon fractions from to while, H is the Summation of the concentrations of aliphatic hydrocarbon fractions from to . When the ratio is below 1 signifies contamination from natural sources, and terrestrial biogenic origin and values are above 1 then, it indicates natural sources of biogenic origin.
LHC/SHC Ratio: Long Chain Hydrocarbons/ Short Chain Hydrocarbons ratio calculates how abundant phytoplankton and vascular plants are in the creek (Fagbote and Olanipekun, 2013). The summation of , and give SHC while, the summation of , , and gives LHC.
Carbon Preference Index (CPI): This index is the ratio of odd number hydrocarbon fractions to even number hydrocarbon fractions in the sediments. CPI values equal to 1 signifies hydrocarbons that originated from a petrogenic source, while CPI values below 1 are possibly from bitumen and oils that have originated from a pyrogenic (evaporated rocks) source or from a carbonate origin (Fagbote and Olanipekun, 2013). CPI values greater than 1 reveals that the alkanes (total petroleum hydrocarbons) are from biogenic source.
Determination of : This ratio was used in detecting the origin and sources of petroleum hydrocarbons (n-alkanes) in the marine/aquatic environment. The detection of the presence of indicates hydrocarbons of terrestrial biogenic origin, while detection of indicates hydrocarbons inputs of marine biogenic sources.
Average Carbon Length (ACL): This index was determined using the mathematical expression of Kiran et al (2015) and Wang et al. (2015). The index helps evaluate odd hydrocarbons in a molecule present in a sample so that a link will be established with higher plants associated with n-alkanes (petroleum hydrocarbons).
III. RESULTS AND DISCUSSION
a) Total petroleum hydrocarbons Concentration in the Surface water of Onyima Creek (Ede Onyima)
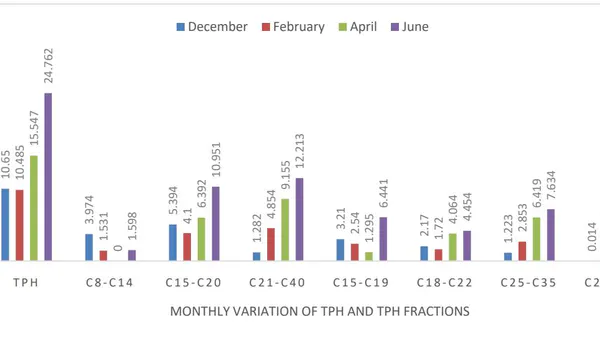
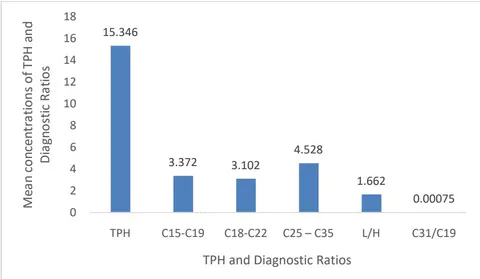
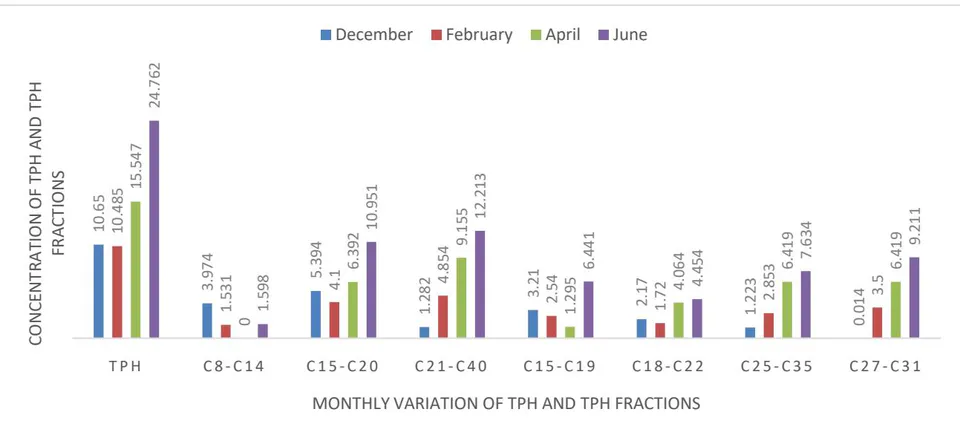
The level of surface-water contamination by total petroleum hydrocarbons and the source identification indices used in diagnosing the origin of total petroleum hydrocarbons in Onyima Creek (Ede Onyima) are shown in Table 1. The mean values of the parameters are shown in Figure 1. At the same time, the concentrations of major groups of total petroleum hydrocarbons fractions in the surface water of the creek are illustrated in Figure 2. The level of pollution by total petroleum hydrocarbons within the months investigated lie between 10.485 to 24.762mg/L with a mean concentration of 15.34 6mg/L. The highest value of 24.762mg/L was obtained in June, while the lowest value of 10.485mg/L was obtained in February. The odd number of total petroleum hydrocarbons of within the sampled months lie between 1.295 to 6.441mg/L with a mean concentration of 3.372mg/L. In contrast, even number of total petroleum hydrocarbons of lie within the values of 1.720 to 4.454mg/L with a mean concentration of 4.528mg/L. The observed values for low molecular weight hydrocarbons/high molecular weight hydrocarbons (L/H) lie within the values of 0.698 to 4.207 with a mean concentration value of 1.662 within the months. The values observed lie within not detected to 0.003 with a mean ratio of 0.00075. Both and were observed in December only.
The presence of total petroleum hydrocarbons on the surface water of the Onyima Creek (Ede Onyima) has introduced biochemical changes and geochemical imbalance on the aquatic environment due to the deficiency in oxygen, which was a result of coating of the surface water of the creek. The smothering affects the exchange of gases, the osmo regulation processes, and the life-support system in the creek become threatened, leading to a reduction in the certain species that were present in the creek. This finding was also observed by Luoma et al (1997) and Mendelssohn et al (2012), who showed that oxygen deficiency in water due to petroleum hydrocarbons floating on the water surface led to losses in the species population and affected the resilience of the community dwellers due to the imposition of hypoxic conditions. The oil has formed sheen on the water's surface due to the discharges of petroleum products by the illegal refiners, and the surface water of the creek has turned brown in coloration, and oil films surround any object that is found floating on the surface of the creek. This observation is similar to that noticed in the Ugbo Water Way by Ashiru and Ogundare (2019).
The activities of illegal oil bunkering, and artisanal oil refining within the area covered by the Onyima Creek (Ede Onyima) has led to the destruction of the ambient ecological system and a gross reduction of fish, aquatic reptiles, and birds within the creek environment as compared to the abundant fish supply by the creek in the 1980s and beyond. This assertion was corroborated by Ezekwe and Utong (2017) in the Oturuba Creek that the manifestation of hydrocarbons on the creek waters has led to the reduction in the quantity of fish catch. Due to the toxic effect of total petroleum hydrocarbons, certain species have been lost. Phytoplanktons and other lower organisms may have been drastically reduced due to the contamination of total petroleum hydrocarbons and tends to affect higher trophic organisms, such as aquatic birds that make use of the creek or river (Langston, 1990). This condition was also observed in Onyima Creek. The total petroleum hydrocarbons in the creek have negatively impacted on aquaculture because of the severity of oil and its tendency to bio accumulate in aquatic organisms like mollusk, fish, mussels, and mammals (Ahmed et al., 2014). The livelihood of the communities living along the creek have been affected due to the pollution effect. The activities of oil bunkering and its allied businesses has forestalled the popular "Ede Onyima Holiday" that was always observed in the 1980s and beyond. This was as a reduction in the quality and quantity of fish in the creek and has affected the general life pattern of the people. This assertion was agreed with and corroborated by other authors (Abowei, 1996; ATSDR, 1999).
| Parameters | Months | Range | |||
| December | February | April | June | ||
| TPH | 10.650 | 10.485 | 15.547 | 24.762 | 10.60-24.80 |
| (odd number TPH) | 3.210 | 2.540 | 1.295 | 6.441 | 1.30-6.44 |
| (even number TPH) | 2.170 | 1.720 | 4.064 | 4.454 | 1.70-4.50 |
| 1.205 | 2.853 | 6.419 | 7.634 | 1.21-7.63 | |
| L/H ( ) | 4.207 | 0.845 | 0.698 | 0.897 | 0.70-4.21 |
| 0.003 | - | - | - | nd-0.003 | |
b) Total Petroleum Hydrocarbons Concentration in the Sediments of Onyima Creek (Ede Onyima)
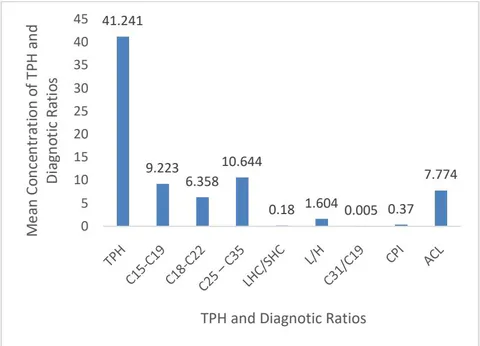
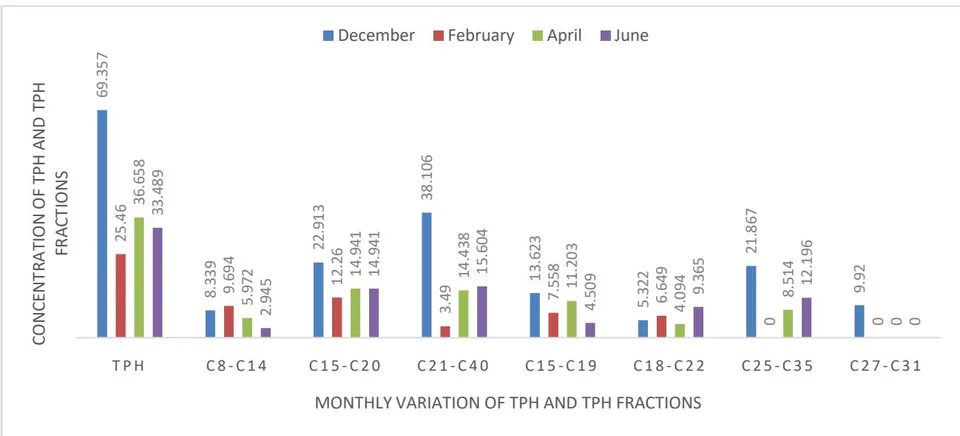
The level of contamination of the sediments of Onyima Creek by total petroleum hydrocarbons and the indices used in the diagnosis of the source of origin of pollution are shown in Table 2. The mean values for total petroleum hydrocarbons and the source identification indices are illustrated in Figure 3. In contrast the concentrations of major groups of total petroleum hydrocarbons fractions in the sediments of the creek are illustrated in Figure 4. The total petroleum hydrocarbons concentrations lie between 25.460-69.357mg/Kg with an average concentration of 41.241mg/Kg within the months investigated. The lowest value was obtained in February, while the highest value was obtained in December. Concentrations of 4.509 to 13.623mg/Kg were recorded for C -C (odd number TPH) with an average value of 9.223mg/Kg, while 4.094 to 9.365mg/Kg were recorded as the concentrations of C -C (even number TPH) with an average value of 6.358mg/Kg. The values obtained for C -C total petroleum hydrocarbon fractions lie between not detected to 21.867mg/Kg with an average value of 10.644mg/Kg. The ratio of low molecular weight hydrocarbons to that of high molecular weight hydrocarbons (L/H) lie within 0.601 to 3.518 with an average value of 1.604. The ratio of long chain hydrocarbons to short chain hydrocarbons (LHC/SHC) lies between not detected to 0.719 with an average of 0.180 within the months investigated. C /C ratio lies within not detected to 0.020 with an average of 0.005, CPI values were within not detected to 1.481with an average of 0.370 and ACL values lies within not detected to 31.095 with an average of 7.774 within the months. The results also indicated that C /C , CPI and ACL values were recorded in the month of December only in the sediments of the creek.
The sediment acts as the natural sink in the marine environment. The constant accumulation of pollutants such as total petroleum hydrocarbons can result in geochemical and biological alterations in aquatic organisms that dwell and feed on the bottom of the creek. The effect of such accumulation gives rise to a reduction in the population of fish, growth of organisms, the diversity of species, and also impair the reproduction of the aquatic organisms. The effect goes further to affect the moisture content, pH, organic carbon and organic matter, and electrical conductivities of the sediments (Singare et al., 2011; Onojake and Osuji, 2012). The effect of oil has direct consequences on the habitat of organisms, which results in bioaccumulation, loss of predators, and the migration of aquatic organisms. This resulted from accumulation of hydrocarbons adsorbed in the bottom sediments (Benson et al., 2008; Meador et al., 1995; Macauley and Rees, 2014).
The sediment absorbs and adsorbs pollutants in the water column. At the critical level of contamination of the sediment through the absorption and adsorption processes, the ecological system of the river/creek changes due to the loss of species and alteration in the ecological diversities of the aquatic system (Markovic, 2003). The food chain at both the bottom and upper levels in the ecological set-up becomes affected (Burton, 2002). There is also the possibility of direct effect on the bottom-feeding organisms, which can easily transfer to the man that consumes the fish and reptiles of the polluted river/creek. The contamination of the creek environment has led to deterioration and degradation of the environment whereby many plants and animals that were originally in the creek are found no more due to possible migration or extinction. This might have arisen due to the blocking of oxygen from properly dissolving into the water and sediment columns of the creek. The observation here is similar to those of Udoh and Akpan (2010) and Ogeleka et al., (2016), who observed that oil spill at sea poses a threat to organisms inhabiting the sea.
In general, the effect hydrocarbons contamination of the creek has led to socio-economic problems, such that those that depended on the creek for daily survival and sustenance are now forced to look somewhere else for alternative means of life. The cultural heritage of the people has been lost. The annual fishing event of 'Holiday Ede Onyima' is now foregone and will only remain in the minds of those that saw the festivals. The water of the creek is no more fit for human consumption. The observation above corroborates other authors who agreed that pollution in the environment leads to deterioration and degradation of the environment, creates economic and social challenges and, also loss of cultural heritage, especially in Nigeria, Niger Delta Region (Kponee et al., 2005; Ite and Ibok, 2013), where oil is in abundance and environmental concerns are not a priority of the government, and the people.
| Parameters | Months | Range | |||
| December | February | April | June | ||
| TPH | 69.357 | 25.460 | 36.658 | 33.489 | 25.50-69.40 |
| (odd number TPH) | 13.623 | 7.558 | 11.203 | 4.509 | 4.51-13.60 |
| (even numberTPH) | 5.322 | 6.649 | 4.094 | 9.365 | 4.10-9.40 |
| 21.867 | - | 8.514 | 12.196 | nd-21.90 | |
| LHC/SHC | 0.719 | - | - | - | nd-0.72 |
| L/H ( ) | 0.601 | 3.518 | 1.340 | 0.958 | 0.60-3.52 |
| 0.020 | - | - | - | nd-0.02 | |
| CPI | 1.481 | - | - | - | nd-1.50 |
| ACL | 31.095 | - | - | - | nd-31.10 |
c) Fingerprints of Total Petroleum Hydrocarbons in the Surface Water and Sediments of Onyima Creek (Ede Onyima)
The evaluation of the status of total petroleum hydrocarbons in the surface water and sediments of Onyima Creek by using certain indices in identifying and fingerprinting the source of pollution are discussed by applying the method of Adeniji et al. (2019a and b). These indices are useful markers and are essential tools in identifying the source of pollution in aquatic environments (Sakari et al., 2012).
d) The Pattern of Total Petroleum Hydrocarbons Distribution in the Onyima Creek (Ede Onyima).
The appearance of hydrocarbons on the surface water and sediments of the Onyima Creek was through the activities of man, the geochemical process of seepage, and hydrocarbons production through the activities of living organisms in the environment. The biosynthetic nature of living organisms that occupy the aquatic environment under certain conditions produces trace amounts of n-alkanes or petroleum hydrocarbons, while a great quantity of total petroleum hydrocarbons in aquatic surroundings resulted from activities of man (Sakari et al., 2012).
The variation of total petroleum hydrocarbons fractions in the surface water and sediments of Onyima Creek was an indication that different sources were responsible for petroleum hydrocarbons found in the creek. The fractions had an average concentration of 4.528mg/L in the surface water and 10.644mg/Kg in the sediments, which was an indicated biogenic input from vascular and terrestrial plants. The results showed a slight dominance of hydrocarbon fractions against the hydrocarbons fractions in both water and sediment columns, which attests to inputs from algae and phytoplankton sources of biogenic origin. The presence of , , and fractions in both surface water and sediments was an indication of an anthropogenic source of pollution in the creek. The presence of the and components in the creek suggested inputs from microbial biogenic activities and origin (Gao and Chen, 2008; Al-Baldawi et al., 2015).
The study revealed that total petroleum hydrocarbon fractions of , , were present in the surface water and sediments of the Onyima Creek (Ede Onyima). However, the fractions were either in little quantity or absent in certain months of the study. Heavier hydrocarbon fractions were dominant over the lighter hydrocarbon fractions. Odd hydrocarbon fractions of C21, and above were in little quantity or absent from the water and sediment columns of the creek. This observation disagreed with the findings of Ahmed et al. (2015). The presence of aliphatic hydrocarbons in the creek originated completely from biogenic sources. The presence of total petroleum hydrocarbons (n-alkanes) in the surface water and sediments of the creek was of the biogenic and anthropogenic origin. The presence of total petroleum hydrocarbon fractions in the creek may be due to runoffs from self-sustaining refining sites and farmlands during rain and direct discharge of contaminants by the operators of unauthorized refineries prevalent in the area of study (Edori et al., 2020).
e) Low Molecular Weight Petroleum Hydrocarbons/High Molecular Weight Hydrocarbons (L/H)
This ratio varied from 0.698 to 4.207 in the months considered with an average of 1.662 in the surface water and the sediments; it varied from 0.601 to 3.518 with an average of 1.604 within the months under investigation. When the ratio is less than one, it shows a clear picture of the dominance of petroleum hydrocarbons from marine animals, higher plants, and aquatic bacteria. Still, values close to one is an indication of total petroleum hydrocarbons from plankton and petroleum origin. Still, when the ratio is more than two, it is pollution from fresh hydrocarbon oil in the aquatic environment (Zrafi et al., 2013). The results from the table indicated that there was the presence of fresh oil in the creek, which was as a result of direct discharge from artisanal or self-sustaining refining sites abundant in the region and also from contamination due to planktons aquatic bacteria, marine animals, and higher plants.
f) Long Chain Hydrocarbons/Short Chain Hydrocarbons (LHC/SHC)
Short-chain hydrocarbons originate from plankton, and benthic algae, while long-chain hydrocarbons usually originate from vascular plants. Still when the ratio falls within 0.21 to 0.80, it shows that phytoplankton is dominating and when it falls within 2.38 to 4.33, it is a mixed origin, but when the ratio is greater than four, the origin is terrestrial plant waxes (Bianchi, 2007). The value of the ratio recorded in this work fell between not detected to 0.719 with a mean value of 0.180, which indicates that the origin was from phytoplankton.
g) Determination of Ratio
This ratio is used to quantify the predominance of hydrocarbons of terrestrial biogenic origin against inputs from marine biogenic sources (Fagbote and Olanipekun, 2013). The hydrocarbon ratio was recorded only in December in the surface water of the creek with a value of 0.003, and that of the sediments was 0.0198. The ratio was only calculated in this month due to the non-detection of the fraction in the other months investigated. This shows a predominance of the fraction against the fraction in the area of study. This showed that total petroleum hydrocarbons present in the creek were from marine biogenic sources. Values of the ratio higher than 0.4 reveal that hydrocarbons present are of non-marine origin (Ahmed et al., 2015). The value obtained in Onyima Creek (Ede Onyima) surface water and sediments were all less than 0.4 which signified little presence of hydrocarbons of terrestrial origin and more of marine biogenic sources.
h) The Carbon Preference Index (CPI)
This index in the sediment is expressed mathematically as;
The ratio can give the knowledge of the dominance of naturally occurring hydrocarbons as against anthropogenic hydrocarbons (Wu et al., 2001; Maioli et al., 2011). The CPI value ranged between not detected to 1.481, with an average of 0.370 obtained in the Onyima Creek (Ede Onyima). The finding showed that aliphatic hydrocarbons probably originated from natural sources. When CPI value is greater than one (in the range between 3 and 10), it identifies that the total petroleum hydrocarbons present is from biogenic sources (e.g., waxes of terrestrial vascular plants, and algae) and majorly predominated by odd-numbered total petroleum hydrocarbons. When there is odd-numbered hydrocarbon concentrations of , the source is mostly from algae or microbial origin and the concentration range originating from is majorly from vascular plants. The presence of total petroleum hydrocarbons from petrochemical source have CPI values close to 1 (Luan and Szelewski, 2008; Michelle et al., 2014).
The mathematical expression used in calculating ACL is given as;
IV. CONCLUSION
(Average Carbon Length ACL)
In non-polluted sites, the value is always constant and fluctuates in value in sites polluted with total petroleum hydrocarbons (Jeng, 2006). The ACL value in the sediments of the Onyima Creek (Ede Onyima) was an indication that total petroleum hydrocarbons were from both natural and anthropogenic sources.
The total petroleum hydrocarbons in Onyima Creek (Ede Onyima) was within the range or slightly higher than the acceptable limit of pollution in the surface water and slightly higher or lower than the limit in the sediments during the months considered for investigation. The contamination range showed not polluted to slightly polluted by total petroleum hydrocarbons in both surface water and sediments of the creek. The creek's status was also provided by the fingerprinting of the surface water and the sediments, which have provided basic data for developing measures in controlling the pollution of the creek due to oil and other related activities within the area. The total petroleum hydrocarbons in the area originated from both anthropogenic and natural sources. This was revealed through the application of diagnostic ratios, which are relevant biomarkers in hydrocarbons analysis. A proper monitoring system should therefore be established to effectively monitor the creek and to continuously sensitize the individuals involved in the oil business so that the pollution of the aquatic environment of the creek will be minimized.