I. INTRODUCTION
Until a few years ago, it was understood that climate changes were potential problems and that their eventual effects would be seen in the long term. Unequivocal evidence of the acceleration of climate changes are: the increase in the number and intensity of hurricanes, with increasingly frequent and more devastating floods; the succession of extreme droughts and heat waves, which often cause forest fires, deforestation, losses in agriculture and livestock; and the melting of the polar ice caps and high mountains glaciers.
Each year, about 80 cyclones and tropical storms are formed around the world. Those with categories 4 and 5 have doubled his number between 1970 and 2010 (Schweitzer, 2014). Consequently, the power dissipation index (PDI) of Atlantic storms, which measures the hurricane intensity, has been duplicated since the 1970's (McLendon, 2017).
By 2014, one of the consequences hitherto unforeseeable was evident; the greenhouse effect was no longer the only problem. Atmospheric pollution was responsible for about 2 million premature deaths per year in the world due to respiratory problems, caused by PM2.5 particles and combustion gases (Walther 2014, Garric, 2015). This warning accelerated the development of clean energy sources, particularly in China, the country with the highest GHG emission rate.
If cleaning tasks on the mainland are difficult, at sea and in the atmosphere, on a large scale, they are practically impossible. Without technology -which does not exist today- and without consuming energy, it is impossible to go down to the ocean's depths to eliminate the myriad of pollutants that have accumulated. It is also impossible to go high to eliminate the atmospheric GHG. Rohde & Muller (2015), with justified reason, warn that "The atmosphere pollution is the worst ecological catastrophe in the world." The oceans and atmosphere pollution are the greatest ecological disasters happened on Earth after the extinction of the dinosaurs.
Many worldwide actions are combined to claim to stop climate change. Even though the several UN Conferences of Parties (COPs) encouraging the Kyoto Protocol, the infinity of other conferences and events, the underlying problem is that the GHG concentration keeps rising. All this put into question the effectiveness of the set of all the initiatives; or rather, they warned about the fact that, although all the initiatives to preserve the Earth are extremely valuable, they are not enough to prevent climate change.
This document tries to clarify which are the obstacles preventing the fight against climate change from thriving. It will be concluded that the underlying problems have not been correctly visualized, and there are no legal mechanisms to impose solutions. Among other factors, governments do not have the power or will to induce a reduction in both fossil fuel consumption and GHG emissions.
II. SOME PRECISIONS ABOUT GREENHOUSE GASES (GHG)
GHGs are all kinds of atmospheric gaseous polyatomic molecules (of more than two atoms), which have the property of trapping a fraction of the infrared radiation (IR) that the Earth should emit into space (Butler, 2020). The most crucial GHG are: Carbon dioxide , Methane , Nitrous oxide , and Chlorofluorocarbons (CFC). Their ability to trap infrared radiation is typified by a factor called Global Warming Potential (GWP). has the lowest GWP but it is the most abundant one, therefore it contributes the most to global warming. The methane follows in abundance, with a GWP , meaning that each molecule has a reheating power equivalent to 25 molecules of . Then follows the nitrous oxide , whose . The chlorofluorocarbons, the most giant polyatomic molecules found in the atmosphere, have a GWP between 1800 and 22000 (Hofmann, 2006).
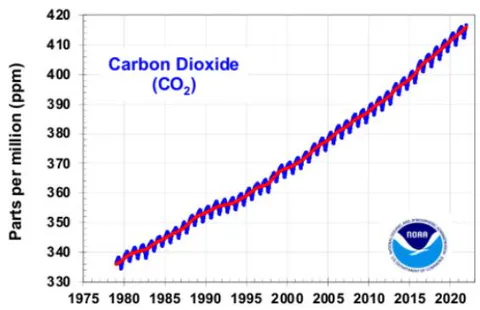
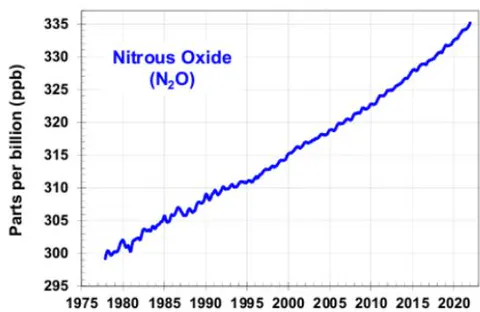
Figure 1, published by the National Oceanic and Atmospheric Administration (NOAA, 2022), shows the trends, over the last forty years, of the accumulation in the atmosphere of the leading GHG. It can be seen that and have stationary variations, but not . For , it can be easily verified that the growth rate is 0.777 ppb per year, which implies an accumulation of 4.11 million of tons (Mt) of per year.
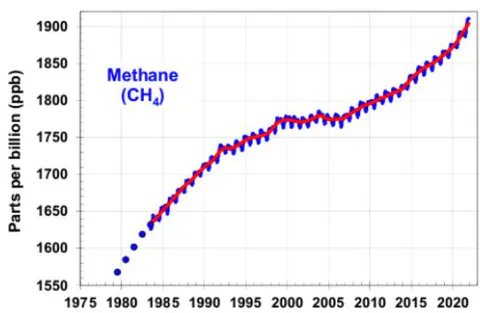
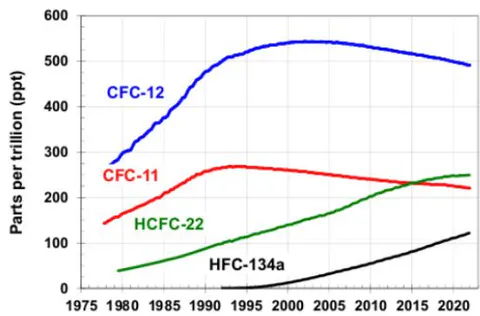
Source: http://www.esrl.noaa.gov/gmd/aggi/, [On line 2022]
It can be shown that with a current concentration of 335 ppb and aGWP = 298, is equivalent to 99.8 ppm of . This implies that the contribution of to the heating of the atmosphere is of the order of 24% concerning to , thing that have not deserved enough importance.
Similarly, it can be verified that with a concentration of 1920 ppb and a GWP = 25, is equivalent to 48 ppm of ; that is, its contribution of the order of 11% additional to that of .
And in the case of CFC-12, with a concentration of 500 ppt and a GWP = 10 900, it is equivalent to 5.45 ppm of . And the contribution of the remaining CFCs is equivalent to 0.89 ppm of .
Summarizing, the actual GHG set has a greenhouse effect on the atmosphere equivalent to 572 ppm of . It means that GHGs have doubled with respect to the pre-industrial era.
The life in the atmosphere of is 114 years, which implies that the current generation will not be able to see the end of that it has generated. That is why should be worrisome.
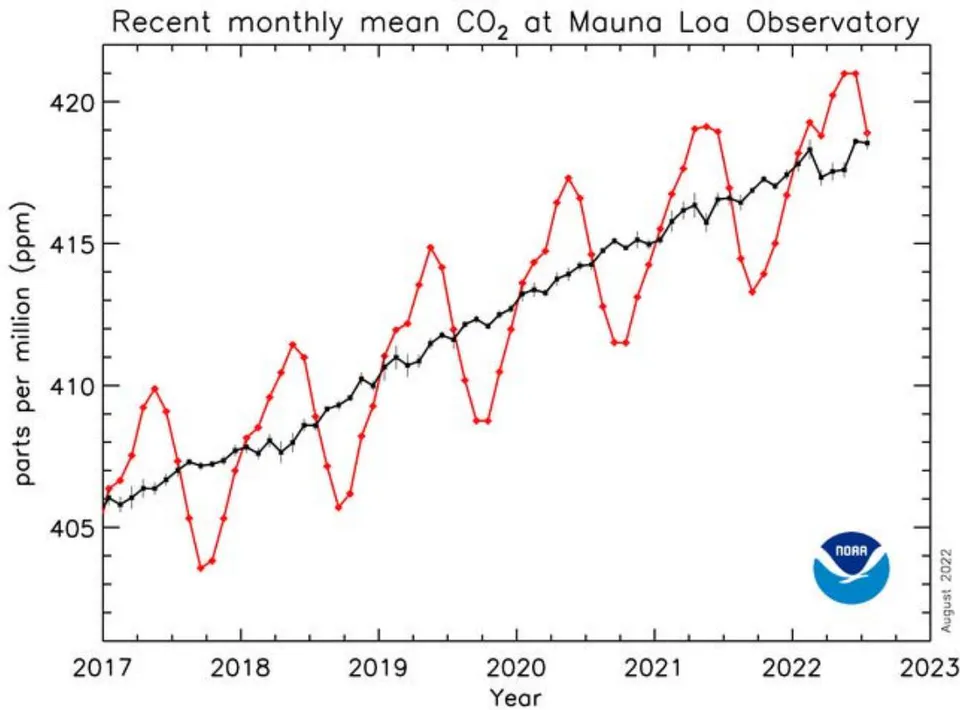
Figure 2, also published by NOAA (2022), shows the evolution of the accumulation in the atmosphere of -Accumulated implies that it could not be destroyed naturally-. A growth rate of 2.4 ppm of per year can be observed in the graph. Assuming that the atmosphere's mass is , it can be easily demonstrated that 1 ppm of any component in the atmosphere is equivalent to or 5290 . Therefore, if the rate of accumulation is 2.4 ppm per year, this implies that 12700 of accumulate in the atmosphere year after year.
But, as if that were not enough, not only produces a greenhouse effect. In the Polar atmosphere, where the temperatures are freezing, it condenses and forms stratospheric clouds that serve as a liquid medium that facilitates the destruction of ozone, by the chlorine action of CFCs. plays an essential role in the appearance of the ozone hole and continues to influence the destruction of ozone molecules.
There are three mechanisms of natural elimination of : photosynthesis, dragging through rainwater, and destruction by photo dissociation with UVC radiation.
Vegetation absorbs , but only the one in the vicinity of the leaves; obviously, plants are not vacuum cleaners. Therefore, they cannot process that is far from their reach. So, planting trees and caring for forests are not enough to counteract the accumulation of in the atmosphere. In apaper that appeared in Science, it was argued that the forest area at that time was higher than the previous assessment (Le Hir, 2017, Bastin, 2017). However, it can be seen in Figures 1 and 2, that there has been no decrease in the concentration trend. This proves that reforestation is essential, but it is an insufficient action to reduce effectively.
Rain can drag a certain amount of , but only the one below the clouds. But the dragged by rainwater is not entirely beneficial since it changes the pH of rivers and seas, causing the gradual extinction of coral, in which the food chain of multiple maritime species begins.
According to the National Oceanic and Atmospheric Administration (NOAA), in mid-2022, in the Mauna Loa laboratory, an average concentration of 418 ppm of has already been recorded (Figure 1); a concentration that existed at the time of the Pliocene, 2 million years ago. In the last million years, the mean concentration was 280 ppm. This level has increased by in just two centuries.
Because of its abundance and multiple effects, the first priority is to attack in the most efficient way possible.
The IPCC proposes to retain or trap before being released into the atmosphere. However, this requires a technology that has not yet been fully developed, which is still in the experimental phase and will be sophisticated and expensive in both financial and energy terms. In calculations, of the energy consumed is required to prevent the release of into the atmosphere. Unfortunately, this technology cannot be applied to transport, domestic consumption or small industry (Metz, 2005). However, capture is restricted for future , and not for accumulated in the atmosphere; because of this, the only alternative is destruction in a natural way.
The natural elimination mechanisms of fulfill their function, as they have always done. Unfortunately, these mechanisms - photosynthesis, rain drag, and photo dissociation - do not act for other pollutants since their physical and chemical properties are different. GHG are very stable molecules, with a fort molecular bond energy. With the exception of methane, the rest of the GHG have a long life or remains in the atmosphere for a very long time. Therefore, it is imperative to treat them individually, generating appropriate technology to capture or retain them, rather than releasing them into the atmosphere.
III. WORLD ENERGY CONSUMPTION
According BP Statistical Review (2022), in 2021, global primary energy consumption reached 595.15 Exa Joule (EJ) or 14 215 million tons of oil equivalent (Mtoe). The total consumption of primary energy grew at a rate of in the year. Its average rate in the last 10 years (2011-2021) was per year, the fastest since 2010.
Fossil energy accounted for of the total - oil, natural gas, and coal. The contribution of clean energy sources was - of nuclear energy, of hydroelectricity, and of renewable energy-.
Clean energies are considered those energy sources that do not release when used; these energy sources are also recognized as carbon-free energy sources. It should be emphasized that not all renewable energy is clean. Of this , is wind energy, is solar energy, and the remaining includes biofuels and biomass, which are not clean energies, because they are actually fuels; they produce when burned. So, subtracting biofuels, renewable sources only provide of -free energy.
Fuels - oil, coal, natural gas, biofuels, and biomass - supply of the energy consumed in the world. Clean or -free energies - hydraulic, nuclear, wind and solar, together represent only .
In 2021 oil consumption grew , consumption natural gas increased , coal consumption grew , nuclear generation increased , hydroelectric generation decreased while renewable energy grew .
Since 2007, China has been the world's leading energy consumer. In 2021, China consumed of the world's energy, followed by the United States (15.6%), India (6.0%), Russia (5.3%), Japan (3.0%), Canada (2.3%), Germany (2.1%), South Korea (2.1%), Brazil (2.1%), Iran (2.0%), France (1.6%), United Kingdom (1.2%), Indonesia (1.4%) Mexico, Italy and Turkey (1.1%).
The energy sources consumed in greatest proportion are fossil sources –oil, coal, and natural gas – due to their abundance and technological easiness for extraction, refining, and transport; however, all of them produce greenhouse gases (GHG).
World oil consumption in 2021 grew by . The United States remains the world's leading oil consumer; consuming ; It was followed by China , India , Saudi Arabia , Japan , Russia , South Korea , Brazil , Canada , Germany , Iran , Indonesia , France , Mexico .
Favored by higher hydrogen content, natural gas is the fossil fuel with the lowest emissions of (651 kg de carbon per ton of natural gas) (Jancovici, 2006). Its emissions represent about with respect to coal and with respect to oil.
In 2021, world consumption of natural gas increased by . Their price is very variable globally, being practically three times more expensive in Japan and twice in Europe, compared to the price in the United States. The United States remains the world's major consumer of natural gas. Its consumption represented . It was followed by Russia (11.8%), China (9.4%), Iran (6.0%), Canada (3%), Saudi Arabia (2.9%), Japan (2.6%), Mexico (2.2%).
Coal is the primary energy source that generates GHG in greater proportion (1.2 tons of carbon per ton of oil equivalent (toe) (Jancovici, 2006). Favored for being the cheapest source of energy in the world (100-150 US 6.3%53.8%(12.5%)(6.6%)(3.0%)(2.2%)(2.1%)(2.0%)(1.9%)(1.3%)79.9%$ of global coal consumption, making it the most polluted region on the planet.
IV. ROLE OF CLEAN ENERGIES
In 2020, clean energy consumption was 92.51 EJ and in 2021 was 97.14 EJ; that is, there was a net increase of 4.63EJ, which represented . In 2021, the contribution of clean energy to the world energy supplies was - hydroelectricity accounted for , nuclear energy , wind and solar energies .
That year (2021), they had a spectacular increase of due to wind power and to solar. However, the increase equals only 4.63 EJ.
In 2020 fossil energy consumption was 463.7 EJ, while in 2021 it was 489.6 EJ. Oil consumption increased by 10 EJ, natural gas by 6.9 EJ, while coal increased by 9 EJ. That is, in 2021, the net increase in
fossil source energy was 25.9 EJ, equivalent to ; of this increase (e.i. 20 EJ) was the responsibility of only 4 countries: China (10 EJ), the United States (4.4 EJ), India (3.2 EJ) and Russia (2.4 EJ).
The net increase in fossil source energy (25.9 EJ) was 5.6 times the net increase of all clean energy (4.63 EJ).
The share of clean energy sources is very important, - they avoid the order of of the emissions of -. But they are far from offsetting the increased concentration of in the atmosphere produced by fossil sources.
V. THE WORLD PRODUCTION OF
In 2021, the global release of into the atmosphere amounted to 33,884.1 million tons (MT). The emissions of worldwide increased by , a figure much higher than the growth observed in the decade (2007-2017). This is undoubtedly due to fossil energy consumption, which increased by .
China is the country that emits the most into the atmosphere. In 2021 its emissions amounted to 10,523 Mt (31.1 % of the world total); followed by the United States 4,701.3 Mt (13.9 %), India 2,552.8 Mt (7.5 %), Russia 1,581.3 Mt (4.7 %), Japan 1,053.7 Mt (3.1 %), Iran 660.5 Mt (1.9 %), Germany 628.9 Mt (1.9 %), South Korea 603.9 Mt (1.8 %), Saudi Arabia 573.5 Mt (1.7 %), Canada 527.4 Mt (1.6 %), Brazil 436.6 Mt (1.3 %), Mexico 373.8 Mt (1.1 %), United Kingdom 337.7 Mt (1.0 %).
China, the United States, and India, produce of the emissions of . Emissions reach if Russia and Japan are added. The previous 13 countries are responsible for of emissions. The most polluting industries are: the electricity-mainly because is produced by fossil sources: produced by coal, by natural gas, and by oil-; the oil production, the steel industry, the cement companies and of course the transportation.
VI. PIONEERS ON RENEWABLE ENERGY
China is the first consumer of renewable energy. In 2021, it consumed of renewable energy worldwide (13.32 EJ), and had an increase of 2.8 EJ of renewable energy. However, that year increased oil consumption by 1.86 EJ, natural gas by 1.51 EJ and coal by 3.79 EJ, which makes a total of 7.16 EJ of fossil energy increase, an amount that is 2.6 times higher than the increase in renewable energy.
The second producer of renewable energy is the United States, in 2018 it produced with worldwide (7.48 EJ), and had an increase of 0.83 EJ. However, that year, oil consumption increased by 2.81 EJ, that of natural Gas by 0.19 EJ, and coal by 1.37 EJ, the sum of the fossil energy increase amounted to 4.37
EJ, which is 5.3 times higher than the increase in renewable energy.
Germany is the third largest producer of renewable energy (2.28 EJ). In 2021 it consumed of the renewable energy with a decrease equivalent to 0.16 EJ. This year saw a net increase in fossil energy consumption of 0.39 EJ -oil fell by 0.04 EJ, but natural gas increased by 0.12 EJ and coal by 0.31 EJ-.
India is the fourth largest producer of renewable energy, with a world production of (1.79 EJ). In 2021, the consumption of renewable energy increased by only 0.21 EJ. However, it increased oil consumption by 0.33 EJ, natural gas by 0.06 EJ, and coal by 2.69, which makes a total of 3.08 EJ, which is 14.6 times higher than the increase in renewable energy.
Large energy consumers and GHG producers are certainly drivers of renewable energy and the development of clean energy sources. However, some countries, more than others, develop renewable energies specially to cover up appearances. Large fossil energy consumers have not slowed the growth consumption of fossil energy. This explains why the concentration of continues to increase in the atmosphere.
VII. CONCLUSIONS
It is clear the degree of responsibility, by country, in the release of emissions into the atmosphere. The COPs have sought through diplomacy to commit states to reduce their emissions; 147 countries signed the Paris agreement. However, the facts show that fossil fuel consumption continues to increase without break (David, 2017). This indicates that governments have no power or will to induce reductions in both fossil fuel consumption and GHG emissions.
In 2018, the worldwide electricity production increased , a figure much higher than the growth observed in the previous decade (2007-2017). The atypical growth, was explained by arguing that electricity demand increased due to the extreme weather. Certainly, this year, both the number of hot days and the number of freezing days were exceptional. However, the fact that the weather is increasingly extreme due to increasing energy consumption and emission was omitted.
Additionally, it was not true that the increase in electricity consumption was due to increased demand for heating and air conditioning. Electricity production in Europe, Japan, and Canada in 2018 was similar to that produced in 2017. The great increases in electricity production corresponded to the three largest electricity producers in the world: China (7.7%), India (6.3%), and the United States (7.7%), and undoubtedly the sector that most forced the electricity demand was the industrial sector, and the mobile was the dispute over world economic supremacy.
It can be argued that population expansion is the engine of the increase in the demand for energy and the need for goods and services. But the world population grows with a rate of , while world energy consumption with a rate of . If the growth in world energy consumption corresponded to the growth of the population, the consumption of energy, and raw materials could be much lower.
The underlying problem lies in the market economy. The fundamental precept of the market economy is continuous economic growth. For this to be, it is necessary to guarantee a production of excess merchandise and rapid circulation in the market. The market has accelerated through the diversification of financial instruments, the bombardment of publicity, and the increasing obsolescence of goods. The diversification of financial instruments has the purpose of promoting production capacity and, at the same time, providing consumers with a purchasing capacity much more significant than their purchasing power, making them dynamic agents of the economy. Publicity campaigns feed the desire to buy, while reducing the obsolescence times of goods induces the need to buy. Consumers in general, have become unreflective, uncritical, and insatiable, and we are undoubtedly responsible for producing much more than is needed. Consequently, energy and raw materials are consumed in excess and GHG and wastes are released in excess. The market economy is essentially predatory and is responsible for the deterioration of the planet. But consumers are not exempt from liability.
In fact, there are currently insurmountable obstacles to addressing climate change: First, there is reticence to the recognition of the responsibility for the release of GHG by the countries and companies with the highest emissions -whose power and economic growth depend on the exploitation of fossil energy sources-. Second, there is an enormous passivity in the absolute majority of the more than 7800 million inhabitants in the world, to reduce the energy consumption. Third, there are technological and financial constraints. And fourth, there are a relatively small number of people in action; and a political class that, in the absolute majority of cases, remains only on the declaratory plane.
Facing the problem, no longer concerns only the atmospheric sciences; it gradually involves other disciplines that can evolve to be viable. The economy and international law will be obsolete in the face of a climate catastrophe. They will have to keep up, either to reorganize a different economy or for a different world.
Meanwhile, the only true thing is that the only gases that do not produce the greenhouse effect are those that are not released into the atmosphere. Therefore, it is still imperative to reduce energy consumption as much as possible.
ACKNOWLEDGMENT
We acknowledge the availability of data from THE NOAA ANNUAL GREENHOUSE GAS INDEX (AGGI) NOAA Earth System Research Laboratory, R/GMD, updated annually at https://www.esrl.noaa.gov/gmd/aggi/aggi.html.