
I. INTRODUCTION
Exchange Traded Funds (ETFs) are similar to mutual funds but unlike mutual funds, they are listed on an exchange and traded throughout the day, similar to stocks. ETFs generally have lower expense ratios and certain tax advantages compared to traditional mutual funds, and they allow investors to buy and sell shares at intra-day market prices. Moreover, investors can sell ETF shares short, write options on them, and set the market, limit, or stop-loss orders. The shares of ETFs often trade at market prices close to the net asset value (NAV) of the shares, rather than at discounts or premiums. ETFs are one of the most innovative and successful products introduced on exchanges and have grown tremendously over the years. The original ETFs were simple, providing diversification benefits at a low cost and allowing intra-day trading.
II. OBJECTIVES OF THE STYDY
ETFs have grown tremendously during the last decade and have become a significant part of the equity market activity; ETFs are one of the most successful products introduced on exchanges in recent years. This study aims at studying the growth and development of Exchange Traded Funds (ETFs) in India during the last ten years. The growth of ETFs is studied by analysing the increase in the Assets Under Management (AUM) of ETFs and number folios in the gold and non-gold ETF funds in India.
III. RESEARCH DESIGN AND METHODOLOGY OF THE STUDY
This study is descriptive in nature. Secondary data relating to the number of folios and Asset Under Management (AUM) of Exchange Traded Funds have been compiled from Association of Mutual Funds in India (AMFI) official website for a period from financial year 2010 to financial year 2017. Proportionate share of gold ETFs and non-gold ETFs in the total AUM of ETFs also studies for the above reference period. Similarly growth indicators like average annual growth rate and compound annual growth rate were computed and reported for qualifying the growth rate of exchange traded funds in the total mutual funds turnover.
IV. SIGNIFICANCE OF THE STUDY
V. DATA ANALYSIS AND INTERPRETATIONS
Institutions, such as some pension funds, that have restrictions on investing in derivatives can invest in ETFs. Other institutions find them to be an alternative to futures that have margin requirements and expiration dates. Hedge funds can use them to take long or short positions. They are also used to temporarily park cash during transitions in investment strategy or change in management. ETFs are increasingly being used by institutional investors for both strategic and tactical purposes; they are also popular among retail investors. These products are often bought on a commission basis and investors pay brokerage commissions when they buy or sell. Similar to stocks that trade on an exchange, ETFs can be bought on margin. In comparison to mutual funds, the tax efficiency of ETFs arises because mutual funds need to sell shares for investors' redemption, and this can result in capital gains. These capital gains have to be distributed to investors, hence investors may incur taxes. ETFs don't have to sell shares to meet redemptions. The ETF itself and also the underlying stocks are lendable. They are being used for active and passive strategies. Liquidity, expense ratios and tracking error are important factors for investors investing in ETFs. ETF shares are purchased and redeemed directly from the fund sponsor, in large blocks called creation units.
In the U.S., aggregate ETF ownership is estimated to be 50 percent retail and 50 percent institutional investors, however, institutions account for more than 80 percent of the trading activity. New ETFs are typically held entirely by institutional investors and retail ownership builds up over time as investors become familiar with the product. In many emerging markets, ETFs are mostly owned by retail investors.
ETFs have grown tremendously during the last decade and have become a significant part of the equity market activity; ETFs are one of the most successful products introduced on exchanges in recent years. The growth of Assets Under Management of ETF funds across the globe are shown in Figure 1
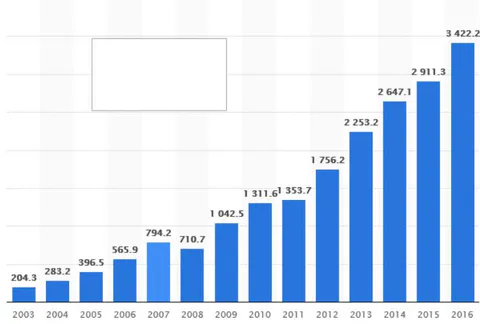
The bar diagram shows the development of assets of Exchange Traded Funds worldwide from 2003 to 2016. The assets under management of ETF funds world wide was approximately 0.20 trillion U.S dollar in the year 2003. It has grown to approximately 3.42 trillion U.S dollars in 2016. The total ETF assets has reported a decrease from previous year's figure only in the year 2008. It may be due to the global financial crisis which broke out in 2008. The increasing trend of ETF assets is a positive of stable development of capital market across the world.
VI. THE GROWTH OF ETFS ASSETS IN INDIA
ETFs provide an alternative to derivatives and stocks when investors are looking to increase or decrease exposure. They can be used for a buy and hold strategy or for market timing purposes. Exchange
Traded Funds or ETFs have revolutionized the Investment Industry in recent times due to their simplicity, low costs and ease of use. The first Exchange Traded Fund in India was Nifty Bees launched by Benchmark mutual fund. Indian ETFs can be broadly divided into two categories namely Gold ETFs and ETFs other than gold. A comparative analysis of the growth of ETFs assets and number folios under both categories of funds are being made for a period from 2010 to 2017. The summary of analysis is given in the table 1.
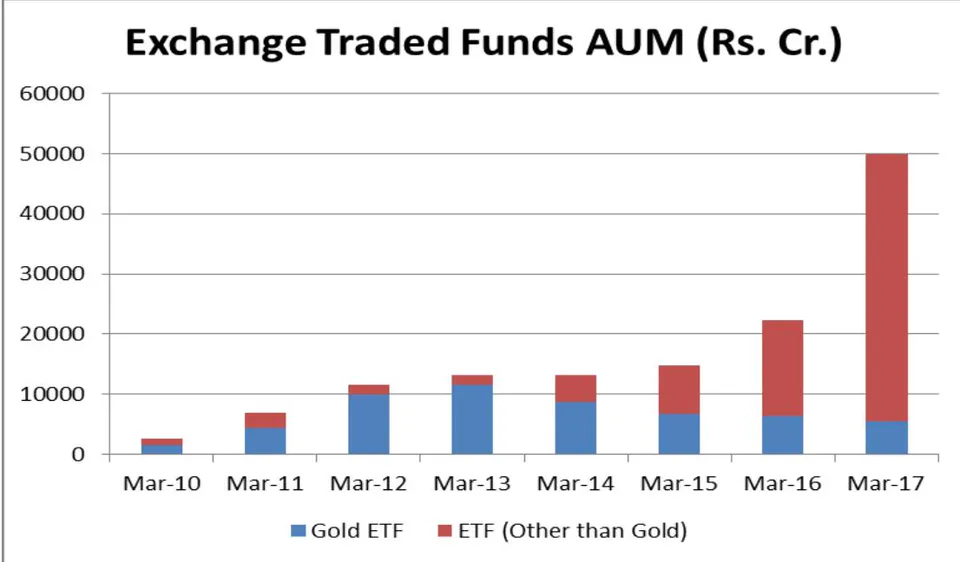
Figure 2: Assets under Management of Gold ETF and ETF (Other than Gold) in India
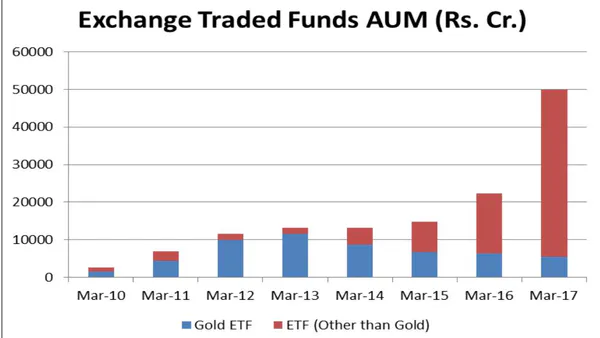
Figure 2 show that ETFs total assets have shown a continuous increase during the period 2010-2017. However, its composition has almost reversed from the year 2010 to the year 2017. Gold ETFs were in dominance up to Mar 2015 but thereafter ETFs other than Gold accounted for a major share in the total ETFs assets under management.
| Year | Types of Schemes | AUM (Rs. Cr) | Percentage | No of Folios | Percentage |
| Mar-10 | Gold ETF | 1590.64 | 62.45% | 147047 | 79.94% |
| ETF (Other than Gold) | 956.59 | 37.55% | 36898 | 20.06% | |
| Total | 2547.23 | 100.00% | 183945 | 100.00% | |
| Mar-11 | Gold ETF | 4400.2 | 63.62% | 319679 | 75.61% |
| ETF (Other than Gold) | 2516.43 | 36.38% | 103122 | 24.39% | |
| Total | 6916.63 | 100.00% | 422801 | 100.00% | |
| Mar-12 | Gold ETF | 9886.06 | 86.02% | 475314 | 76.20% |
| ETF (Other than Gold) | 1606.53 | 13.98% | 148443 | 23.80% | |
| Total | 11492.59 | 100.00% | 623757 | 100.00% | |
| Mar-13 | Gold ETF | 11647.82 | 88.75% | 569169 | 76.95% |
| ETF (Other than Gold) | 1476.67 | 11.25% | 170445 | 23.05% | |
| Total | 13124.49 | 100.00% | 739614 | 100.00% | |
| Mar-14 | Gold ETF | 8676.32 | 65.71% | 502613 | 71.31% |
| ETF (Other than Gold) | 4528.47 | 34.29% | 202228 | 28.69% | |
| Total | 13204.79 | 100.00% | 704841 | 100.00% | |
| Mar-15 | Gold ETF | 6654.87 | 45.23% | 465765 | 66.56% |
| ETF (Other than Gold) | 8059.93 | 54.77% | 233961 | 33.44% | |
| Total | 14714.8 | 100.00% | 699726 | 100.00% | |
| Mar-16 | Gold ETF | 6345.55 | 28.32% | 425914 | 61.05% |
| ETF (Other than Gold) | 16062.63 | 71.68% | 271700 | 38.95% | |
| Total | 22408.18 | 100.00% | 697614 | 100.00% | |
| Mar-17 | Gold ETF | 5479.81 | 10.98% | 364110 | 39.79% |
| ETF (Other than Gold) | 44435.64 | 89.02% | 551017 | 60.21% | |
| Total | 49915.45 | 100.00% | 915127 | 100.00% | |
| CAGR | Gold ETF | 19.33% | 13.83% | ||
| ETF (Other than Gold) | 73.04% | 47.14% | |||
| Total | 52.97% | 25.76% | |||
Table 1 presents the growth of Asset Under Management (AUM) of ETFs in India from the year 2010 to 2017. ETFs are broadly grouped into Gold ETFs and ETFs other than gold. It can be observed from the table that total AUM of ETFs has increased continuously from Rupees 2547.21 crores at the end of Mar 2010 to Rupees 49915.45 crores by the end of March 2017, which translates into a compound annual growth rate of 52.97 per cent for the same period. During this period Gold ETFs and ETFs other than gold have reported a CAGR of 19.33 per cent and 73.04 per cent respectively. It indicates that ETFs other than Gold has grown much faster than Gold ETFs. Index based ETFs comes under ETFs other than Gold category.
From Table 1 it can also be observed that the number of folios in ETFs has grown from 1,83,945 at the end Mar 2010 to 9,15,127 by the end of Mar 2017, which translates into a compound annual growth rate of 25.76 percent for a period of 7 years from 2010 to 2017. During this period number of folios in Gold ETFs and ETFs other than Gold has reported a CAGR of 13.83 per cent and 47.14 per cent respectively. This fact also supports the view that ETFs other than Gold has a faster growth rate compared to Gold ETFs in India.
The proportion of Gold ETFs and ETFs other than Gold in the total Asset Under Management (AUM) of ETFs in India by the end of Mar 2010 was 62.45 per cent and 37.55 per cent respectively. This proportion has been reversed over the years to reach 10.98 per cent and 89.02 per cent respectively for Gold ETFs and ETFs other than Gold. This figure also confirms the fact that non-Gold ETFs has outpaced its counterpart in growth over the years. The higher growth rate of non-gold ETFs can be attributed to the introduction of new funds and higher return history of non-gold ETFs including index-based ETFs.
VII. PERCENTAGE SHARE OF ETFS IN THE TOTAL ASSETS OF MUTUAL FUNDS
Exchange Traded Funds were an innovative product in the mutual fund's industry. It attracted new investments and new investors over the years. In developed markets like the US, ETFs occupy a significant share in the mutual fund assets. In order to understand the contribution of ETFs to the total AUM of mutual funds, a percentage analysis of ETFs share in the total mutual fund assets and total mutual fund folios have been undertaken. The results of the analysis have been presented in Table 2.
| Year | AUM (Rs. Cr) | No. of Folios | ||||||||
| ETFs | AGR | All Schemes | AGR | % | ETFs | AGR | All Schemes | AGR | % | |
| Mar-10 | 2547 | 614546 | 0.41 | 183945 | 47964062 | 0.38 | ||||
| Mar-11 | 6917 | 171.5 | 596977 | -2.9 | 1.16 | 422801 | 129.9 | 47234833 | -1.5 | 0.90 |
| Mar-12 | 11493 | 66.2 | 587659 | -1.6 | 1.96 | 623757 | 47.5 | 46452499 | -1.7 | 1.34 |
| Mar-13 | 13125 | 14.2 | 702494 | 19.5 | 1.87 | 739614 | 18.6 | 42828315 | -7.8 | 1.73 |
| Mar-14 | 13205 | 0.6 | 825243 | 17.5 | 1.60 | 704841 | -4.7 | 39548410 | -7.7 | 1.78 |
| Mar-15 | 14715 | 11.4 | 1082757 | 31.2 | 1.36 | 699726 | -0.7 | 41740203 | 5.5 | 1.68 |
| Mar-16 | 22408 | 52.3 | 1232824 | 13.9 | 1.82 | 697614 | -0.3 | 47663024 | 14.2 | 1.46 |
| Mar-17 | 49916 | 122.8 | 1754619 | 42.3 | 2.84 | 915127 | 31.2 | 55399631 | 16.2 | 1.65 |
| CAGR | 52.97 | 16.17 | 25.76 | 2.08 | ||||||
| AAGR | 62.71 | 17.14 | 31.63 | 2.48 | ||||||
It can be observed from Table 2 that the percentage share of ETFs in the total Assets Under Management of mutual funds has increased from 0.41 per cent at the end of Mar 2010 to 2.84 percent by the end of Mar 2017. Similarly, the percentage share of ETFs in the total mutual fund folios also has increased from 0.38 percent in March 2010 to 1.65 percent in March 2017. So it can be concluded that investments in ETFs are increasing both in terms of numberthe of investors and amount of investment. However, a share of less than 3 percent of the total AUM of mutual funds is very low for ETFs when compared to the developed nations like the U.S, where ETFs form nearly half of the mutual fund assets.
The compounded annual growth rate of ETFs funds from Mar 2010 to Mar 2017 is 52.97 percent against 16.17 percent CAGR for mutual funds' assets of all schemes during the same period. It indicates that ETF funds have grown three times bigger than assets under management of all mutual funds schemes during 2010 to 2017 period. The average annual growth rate of ETF assets and All schemes assets are respectively
62.71 and 17.14 for the study period. Regarding the number of folios, ETF folios have reported a CAGR of 25.76 percent from Mar 2010 to Mar 2017 period as against a CAGR of 2.08 percent for all schemes mutual fund folios during the same period. Similarly the average annual growth rate of ETF folios and All schemes folios are respectively 31.63 per cent and 2.48 percent. It further shows that the addition in theentry of new investors in ETFs is at a much faster rate when compared to the growth rate of all schemes of mutual fund folios.
VIII. FINDINGS AND CONCLUSION
Recently SEBI has taken certain initiatives to discourage speculative retail investors from the risky derivatives market with a motive of protecting interests of retail investors. Exchange Traded Funds were a major innovation in India in the year 2001. ETFs are broadly grouped into Gold ETFs and ETFs other than gold. It is found that total AUM of ETFs has increased continuously from Rupees 2547.21 crores at the end of Mar 2010 to Rupees 49915.45 crores by the end of March 2017, which translates into a compound annual growth rate of 52.97 per cent for the same period. During this period Gold ETFs and ETFs other than gold have reported a CAGR of 19.33 per cent and 73.04 per cent respectively. It can also be observed that the number of folios in ETFs has grown from 1,83,945 at the end Mar 2010 to 9,15,127 by the end of Mar 2017, which translates into a compound annual growth rate of 25.76 percent for a period of 7 years from 2010 to 2017. In short ETFs have reported decent growth over the years both in terms of assets and number of investors. However, the share of ETFs in the total assets of mutual funds remains as low as 2.85 percent in the Financial year 2016-17 which is significantly lower than that of developed markets like the US.