
I. INTRODUCTION
Among african mahogany species, Khaya senegalensis has greater rusticity and relative advantage for cultivation in areas under adverse conditions, especially in regions with high concentration of salts in the soil solution and low rainfall (RIBEIRO; FILHO; SCOLFORO, 2017). Salinity is a term related to the excessive accumulation of salts, especially NaCl, in soil or water, which negatively affects the growth and development of many living organisms (PEDROTTI et al., 2015). It has been one of the environmental factors that can limit plant growth and productivity, especially in arid and semi-arid regions, due to the great environmental contrasts (AKÇA et al., 2020).
The harmful effect of salinity on plants can vary, depending on climatic conditions, light intensity, species and soil conditions (TANG et al., 2015). Due to the addition of salts to water, their osmotic potential is reduced, decreasing the availability of water in the roots and, therefore, exposes plants to secondary osmotic stress (MITTAL; KUMARI; SHARMA, 2012).
The salts absorbed by plants do not directly control growth, but influence the turgor, photosynthesis and activity of specific enzymes (ACOSTA-MOTOS et al., 2015). Saline stress is initially perceived by the root system and impairs plant growth by decreasing hydraulic conductivity, both in the short term, inducing osmotic stress caused by less water availability, and in the long term, by ionic toxicity, due to the imbalance of nutrients in the cytosol (TANG et al., 2015).
High concentrations of and ions in soil or water reduce water potential, which leads to an initial reduction in growth and low productivity (PETROPOULOS, 2012). Plant growth is inhibited by salinity through osmotic stress and by a decrease in cell turgor (SEMIDA et al., 2016).
The reduction in plant growth, due to salinity, is mainly determined by the following factors, which contribute to the decline in photosynthetic activity: i) increase in the osmotic pressure of the medium, which reduces the plant's ability to absorb water (similar to stress) water); ii) ionic excess (for example, and ) to a toxic level for plant cells; iii) ionic imbalance, which affects the nutritional status of the plant and acts on biochemical and metabolic components, related to plant growth (BOARI et al., 2019).
The high salinity alters the ionic relationship in the vacuoles of plants, which, directly or indirectly, result in changes in the nutrient removal processes (SUN et al., 2017). In this condition, the photosynthetic rate is lower, but the respiration rate increases, associated with reduced growth (SANDOVAL-GIL; MARÍN-GUIRAO; RUIZ, 2012). Thus, the increase in salinity alters the absorption of nutrients in different uptake pathways in the plant (SUN et al., 2017). Under saline conditions, the absorption and translocation of and induced by salinity compete with nutrient elements, such as , N, P and , which generally develop a nutritional imbalance resulting in reduced yield (GIRSOVA et al., 1999).
In view of the potential expansion of the crop in regions of saline soils, this study aimed to evaluate the relative and absolute growth rate of young african mahogany plants, Khaya senegalensis, under environmental stress, maintained with a nutritive solution, allowing for this adequate investigation. culture in saline conditions, showing the adaptability of the species to semiarid regions.
II. MATERIAL AND METHODS
a) Characterization of the experimental área
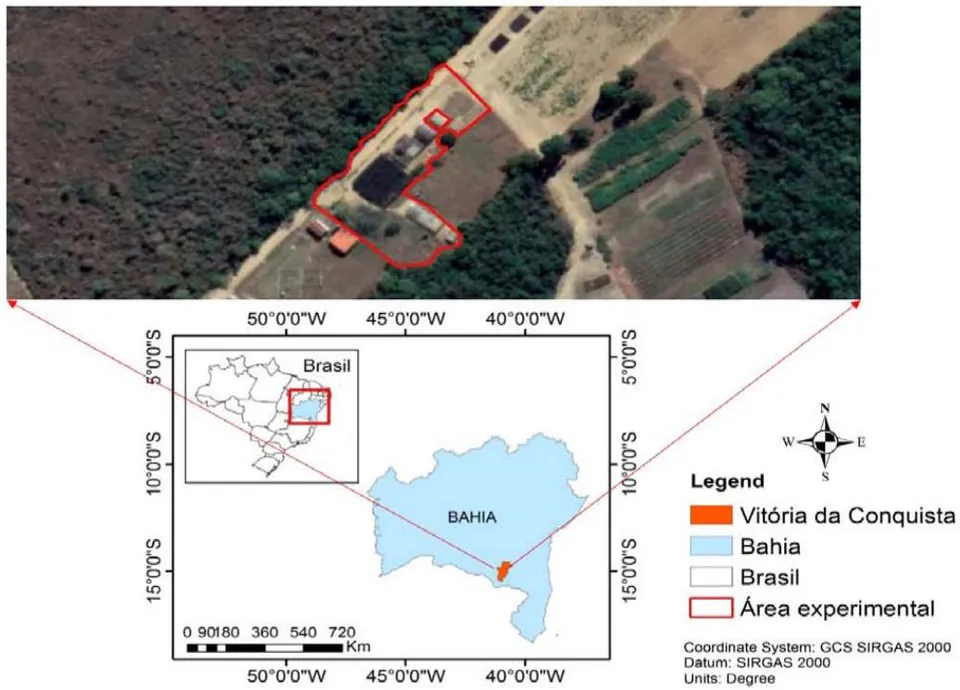
The experiment was conducted in a greenhouse, at the State University of Southwest Bahia (UESB), Vitória da Conquista campus (Figure 01), whose geographical coordinates are 53 '08" south latitude and from west longitude of Greenwich, with an altitude of 881 m. The treatments were administered during the phase of the first four months of plant growth (June 2018), time counted at the time of planting.
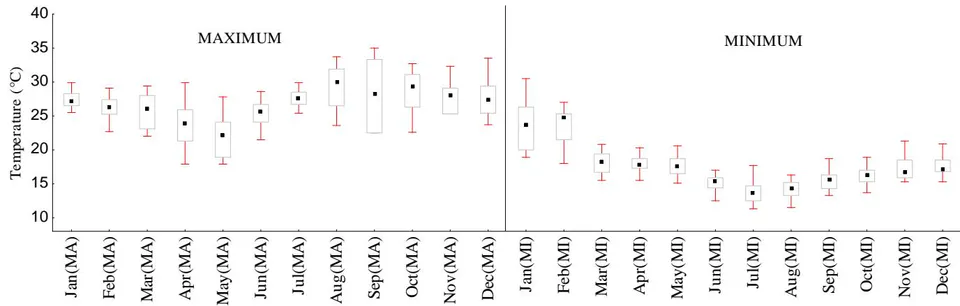
The rainy season in the region runs from November to March. The total annual rainfall is around 700 mm, and the thermal averages show a maximum of 26.4 °C and a minimum of 16.1 °C, with an annual average of 20.2 °C (Figure 02).
b) Experimental design, transplantation and cultivation conditions
In an entirely random experiment, young African mahogany plants were grown in pots containing washed sand and nutrient solution (Table 01) with NaCl in varying concentrations - 0, 20, 145, 270, 395 and 520 mM NaCl, whose concentrations equivalent to the following levels of electrical conductivity: 1.0 • 3.38 • 15.14 • 29.90 • 42.61 • 53.60 dS m with four repetitions, totaling 24 plots (Figure 03).
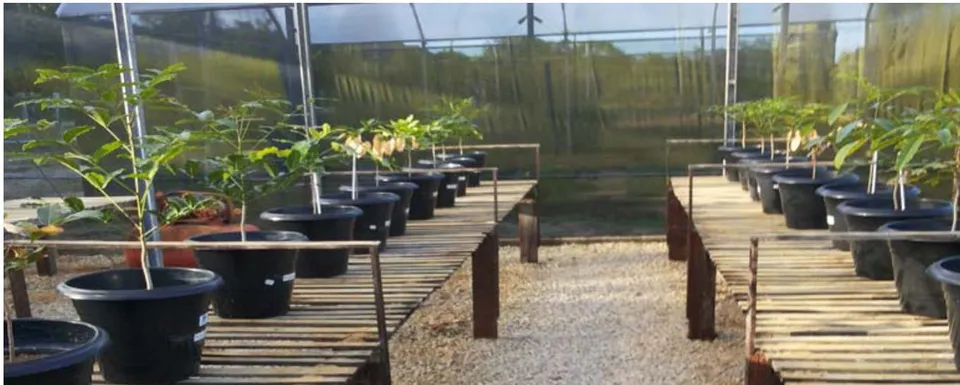
The seedlings were produced by the Instituto Brasileiro de Florestas, in conical model tubes, being acquired at 180 days of age. Seedlings were transplanted in pots with a volume of 15 L, previously filled with sand passed through a 0.005 mm mesh sieve. Small perforations at the base of the vessels allowed the collection of drainage water for further analysis of its chemical characteristics.
The amount of water applied was determined by the vessel capacity method, in which the water content of the sand was kept close to the field capacity.
The monitoring of the soil water content was based on the daily verification of the weight of the pots.
The addition of NaCl to the nutrient solution, in varying concentrations, was done every 15 days. The electrical conductivity (dS m ) was monitored using a portable conductivity meter. In the treatment without addition of NaCl, the electrical conductivity was 1 dS m . In the other treatments, there was an increase in electrical conductivity, due to the addition of NaCl to the nutrient solution, in varying concentrations.
| Hoagland and Arnon (1950) | ||
| Nutrient | Atomic mass | mg L-1 |
| N-NO3- | 14,00 | 196,0 |
| N-NH4+ | 14,00 | 14,00 |
| P | 31,00 | 31,00 |
| K | 39,10 | 234,0 |
| Ca | 40,00 | 160,0 |
| Mg | 24,30 | 48,00 |
| S | 32,00 | 64,00 |
| B | 10,8 | 0,50 |
| Cu | 63,5 | 0,02 |
| Fe | 55,8 | 1,00 |
| Mn | 54,9 | 0,50 |
| Mo | 95,9 | 0,01 |
| Zn | 65,4 | 0,05 |
c) Plant height
Every 5 days, the height of the plants, in cm, was measured with the aid of a graduated ruler, placed parallel to the stem, measuring the height from the neck to the insertion of the last leaf (apical bud of the stem).
d) Relative growth rate
With the height results in mind, the relative growth rate (RGR) was evaluated using the following equation:
Where: Fh, represents the final height; Sh, the starting height; and t, the period considered.
e) Absolute growth rate
With the height results, a growth analysis was performed, in which the absolute growth rate (AGR) was determined.
Where: AGR represents the absolute growth rate; Fh, the final height; Sh, the starting height; and t, the length of the period considered.
f) Statistical analysis
The results were subjected to analysis of variance (ANOVA), Table 02, using the F test to compare the means, and regression analysis for the quantitative study of the characteristics evaluated, using the statistical program SISVAR 5.6 with subsequent regression analysis in the study. between each treatment without including the control, and analysis of main components in the absolute growth rate, and the control treatment was compared with the others by the Dunnet test (p < 0.05).
| Causes of Variation | Degrees of freedom | Sum of Squares | Medium Squares | Calculated F |
| Treatments | I-1 | SQTrat | QMTrat | QMTrat/ QMRes |
| Residue | I(J-1) | SQRes | QMRes | |
| Total | IJ-1 | SQTotal |
Where:
Measures the overall variation of all observations.
Sum of squares of groups (treatments), associated exclusively with an effect of groups (salinity levels).
The sum of squares of the residues was obtained by difference:
Sum of squares of residues, due exclusively to random error, measured within the groups (salinity levels).
Being the square mean of the groups (treatment).
Being the square average of the residues (parameter attributed to effects not dimensioned in the treatments).
To find a significant difference between treatments (absolute/relative growth rate for the different levels of salinity), the F test was used, considering that if F calculated > F tabulated, the null hypothesis is rejected, that is, there is evidence of a significant difference between at least a pair of treatment averages, at the level of signifi cance chosen, with a 5% probability. Otherwise, the null hypothesis is not rejected, that is, there is no evidence of a significant difference between the treatments, at the level of significance chosen.
To generate the regression equations, the least squares method was used, being a mathematical optimization technique that seeks to find the best fit for a data set, trying to minimize the sum of the squares of the differences between the estimated value (regression equation) and the observed data of growth rate of the African mahogany culture, such differences being called residues and expressed mathematically by:
Where: n = represents the number of observations, with the number of data sampled from the growth rate of the crop; e = difference between the real value of the growth rate data observed during the time period of the experiment (four months) and those estimated by the equation.
To measure the model's quality in relation to its ability to correctly estimate the values of the growth rate response variable (dependent variable) as a function of the tested salinity levels, independent variable (Growth rate x Electrical Conductivity) and as a function of the number of days after transplant - DAT (growth rate x DAT) the correlation coefficient was generated, determined by:
Where: SQRes = sum of square of the residue; SQTot = total square sum.
The value of can take values from 0 to 1, and the higher the value of the correlation coefficient, the closer to real data are the data estimated by the regression equation model generated.
III. RESULTS AND DISCUSSION
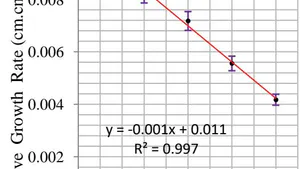
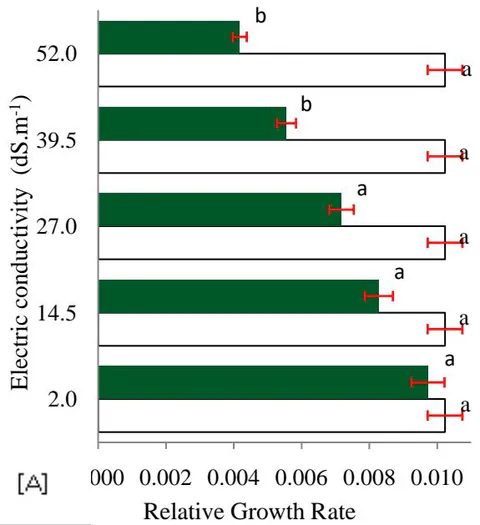
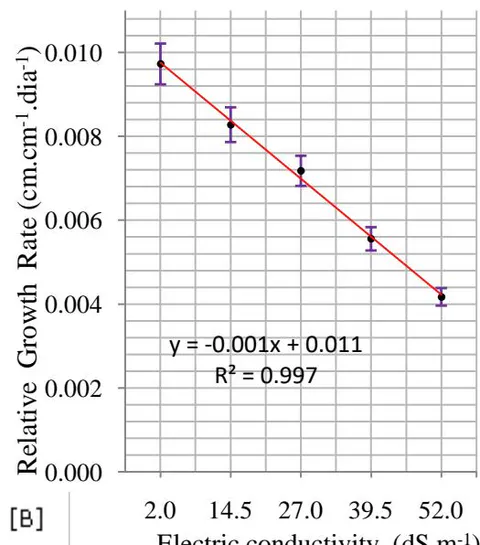
The F test at 5% probability (p < 0.05), in the ANOVA analysis table (Table 03), shows the significance of the evaluated characteristics, relative growth rate (RGR) and absolute growth rate. (AGR) of Khaya senegalensis plants, with statistical difference in RGR and similarity between treatments for AGR. The existing correlation for RGR in the different treatments generated linear regression: RGR = -0.0014 E.C + 0.00111 (Figure 04. B), where the estimated data represent 99.74% of the observed data, demonstrating that young African mahogany plants show sensitivity in their daily growth when subjected to different concentrations of NaCl.
As can be seen in Figure 05.B, the plants subjected to electrical conductivity of showed a daily growth of 0.01 cm whereas with the increase in the concentration of NaCl it registered one in the relative growth rate in around 0.004 cm per day for the treatment of of E.C (Electrical Conductivity), generating a growth about 2.5 times less than the treatments of 2 and respectively.
This behavior occurs due to the saline growth medium, which causes many adverse effects on plant development, due to the low osmotic potential of the soil solution (osmotic stress), effects of specific ions (salt stress), nutritional imbalances or a combination of these factors (SHRIVASTAVA; KUMAR, 2015).
| Variation sources | GL | SQ | QM (RGR) | F |
| Electric conductivity (E.C) | 5 | 0,000112 | 0,000022 | 8,670* |
| Residue | 18 | 0.000046 | 0.000003 | |
| Total | 23 | 0.000158 | ||
| CV (%) | 21.34 | |||
| Variation sources | GL | SQ | QM (AGR) | F |
| Electric conductivity (E.C) | 5 | 0,000112 | 0,000022 | |
| Residue | 18 | 1,684343 | 0,201358 | |
| Total | 23 | 2.018610 | ||
| CV (%) | 21.34 |
| Variation sources | GL | SQ | QM | F |
| DAT (Trat. 01,00 dS.m-1) | 7 | 905.804688 | 129.400670 | 7.664* |
| Residue | 24 | 405.207500 | 16.883646 | |
| DAT (Trat. 03,38 dS.m-1) | 7 | 933.973672 | 133.424810 | 3.701* |
| Residue | 24 | 865.261875 | 36.052578 | |
| DAT (Trat. 15,14 dS.m-1) | 7 | 680.375000 | 97.196429 | 12.150* |
| Residue | 24 | 192.000000 | 8.000000 | |
| DAT (Trat. 29,90 dS.m-1) | 7 | 757.913750 | 108.273393 | 14.690* |
| Residue | 24 | 176.895000 | 7.370625 | |
| DAT (Trat.42,61 dS.m-1) | 7 | 578.078750 | 82.582679 | 1.505* |
| Residue | 24 | 1316.520000 | 54.855000 | |
| DAT (Trat. 53,60 dS.m-1) | 7 | 507.595000 | 72.513571 | 2.087* |
| Residue | 24 | 834.065000 | 34.752708 |
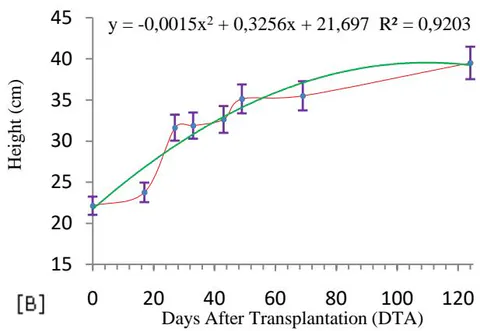
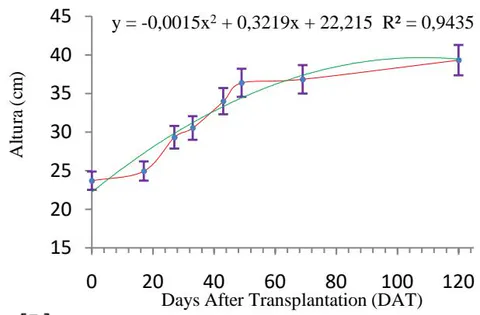
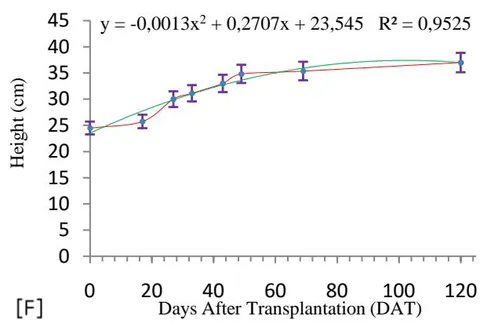
The decrease in the growth rate between treatments (Figure 04) is due first to a decrease in the water potential of the soil (osmotic phase) (LIMA et al., 2020), since the presence of salt in the sand substrate changes the kinetic energy of the water, reducing it. Later, a specific effect appears as a rapid increase in salt in the walls of the cell or cytoplasm, when the vacuoles can no longer sequester incoming salts (ionic phase), and decreases in the leaf and stem cause a reduction in all sizes of the aerial parts and at plant height (BERNSTEIN, 2019) (MUNNS; TESTER, 2008).
[A]
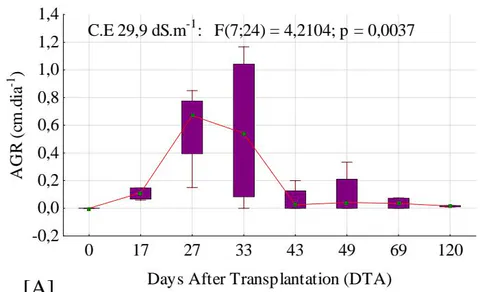
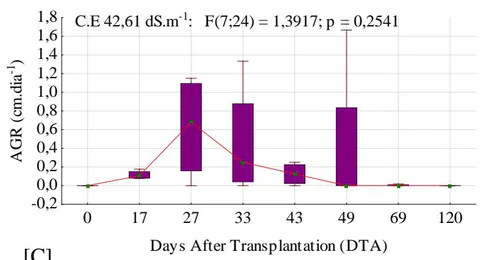
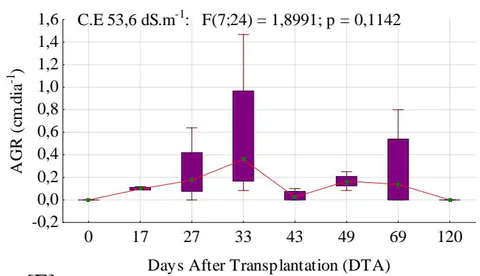
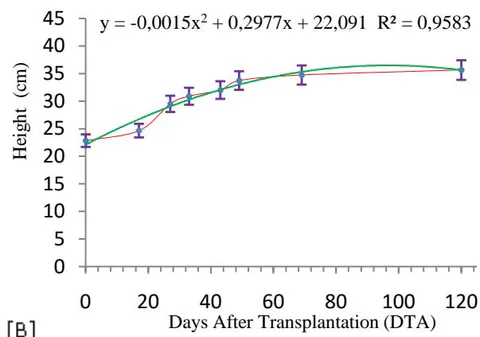
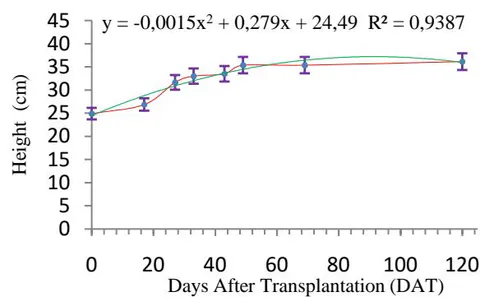
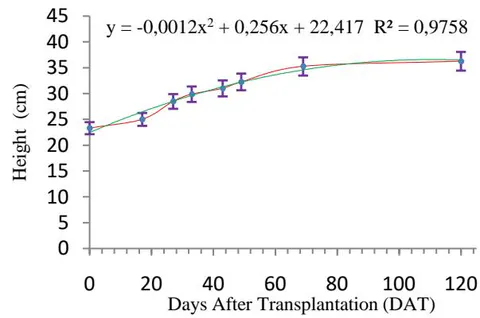
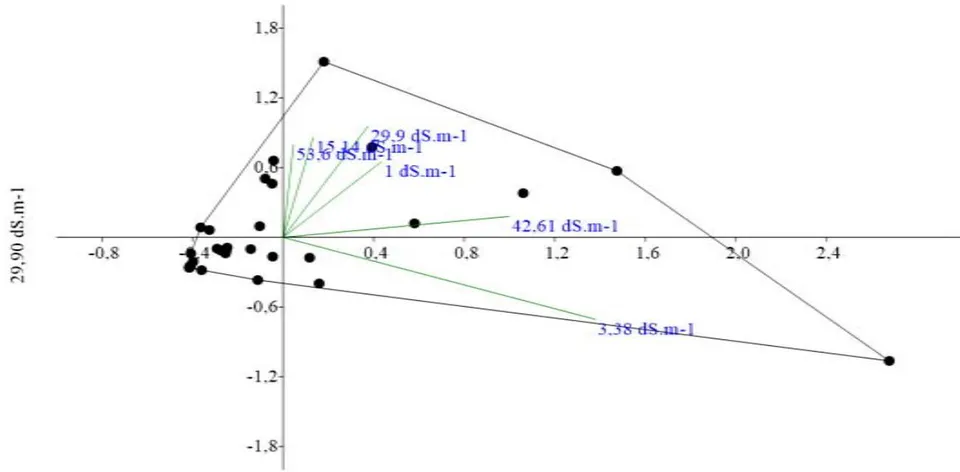
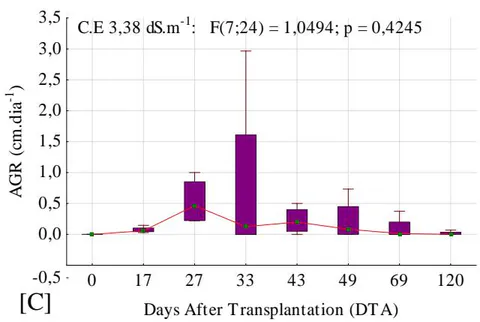
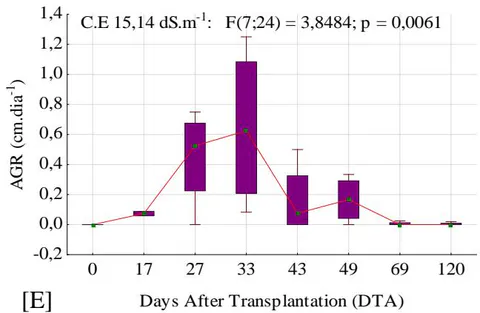
It is verified if the grouping of the points representing the absolute growth rate (Figure 05), through the analysis of the electrical conductivities of 3.38 dS.m-1 and 29.9 dS.m , explaining 70% of the behavior, which indicates close values in the plotted points (Figure 05) showing that there was no difference for the absolute growth rate in the different electrical conductivities, a condition evidenced by the analysis of variance using the F test at 5% probability, which considered the hypothesis statistically valid. of nullity (Table 03).
In a study on the growth and physiological responses of tree species in salinized soil treated with correctives, (SOUSA et al., 2012) observed that young ironwood plants grown in saline-sodium soil, without correction, had their growth practically paralyzed, unlike the behavior shown by the mahogany plants, which showed no reduction in their absolute growth rate with the increase in salinity, causing growth to be maintained (Figures 05 and 06, B; D; F), probably due to the application of the nutrient solution for all treatments.
In the different E.C treatments, there was no difference in plant height (Table 05), results also corroborated in the research by (SOUZA et al., 2017), who working with the concentration of macronutrients and sodium in mahogany seedlings submitted to salt stress, observed that there was no difference in growth in height for the different electrical conductivities.
In the E.Cs of 2; 14.5 and 27 dS.m there was no significant difference for the relative growth rate when compared to the treatment without the addition of sodium chloride (Figure 4.A), this behavior shows that mahogany plants have a tendency to tolerate salinity for the characteristic relative growth rate, since the change in RGR remains the same with the control treatment until an electrical conductivity of 27 dS.m , representing a NaCl concentration about three times higher than most cultures tolerate in natural environments (TANG et al., 2015).
The fact that mahogany tolerates concentrations of up to 270 mM NaCl in the characteristic relative growth rate represents an osmotic adjustment carried out by plants that contribute to the maintenance of water balance and the preservation of the integrity of proteins, enzymes and cell membranes (RODRÍGUEZ et al., 2005). However, the plants were unable to maintain this adjustment for salt concentrations between 39.5 and 52 mM NaCl, which may have occurred due to the very high absorption of salts by the plant cells, leading to ionic toxicity, causing cell death and consequently, the reduction in the relative growth rate for conductivities above 39.5 dS.m .
Souza (2017) researching the species Swietenia macrophylla found that the increase in the level of salinity up to the electrical conductivity of 6.49 dS m did not impair growth in height, however for the species of Khaya senegalensis, object of this study, the tolerance level is higher, as this only showed a difference between treatments and control for electrical conductivity from 39.5 dS.m (Figure 04.A), demonstrating that, in fact, for the characteristic growth rate relative, the effect of salts is not significant to the point of paralyzing growth (Figures 05 and 06, B; D; F).
Contrary to what is expected in plants subjected to salt stress, in which one of the most observed effects is the reduction of growth (PARIDA; DAS, 2005), in all treatments the plants of Khaya senegalensis did not show growth drop over 120 days of the trial period. In all NaCl concentrations it developed a statistically difference in height for the eight periods of time analyzed after 120 days, with a significant difference as seen in Table 04, reinforcing the fact that the species Khaya senegalensis adapted to the conditions of changes in conductivity electricity, provided by the different NaCl concentrations.
| Variation sources | GL | SQ | QM (RGR) | F |
| Electric conductivity (E.C) | 5 | 73.157083 | 14.631417 | |
| Residue | 18 | 519.552500 | 28.864028 | |
| Total | 23 | 592.709583 | ||
| CV (%) | 37.04 |
In a study on the physiological mechanisms of ornamental plants of Eugenia myrtifolia L in saline conditions, (ACOSTA-MOTOS et al., 2015) explain that the ability of plants to control the concentration of salt in their aerial parts, either by the accumulation of salt in the roots, by the reduction in the rates of salt uptake and/or by the controlled translocation to the leaves, constitutes an important survival mechanism of plants under saline conditions. These mechanisms may be present in african mahogany plants, since they showed little significant difference in growth for different concentrations of salts.
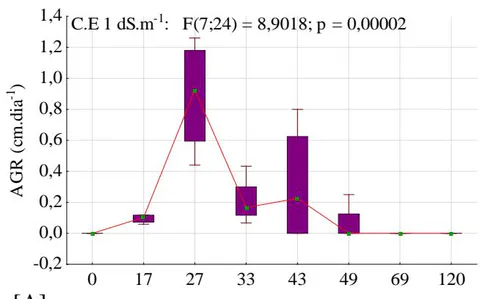
In the absolute growth rate over the experimental period, a growth of about 0.1 cm per day was observed for all treatments until the seventeenth day after the implantation of the seedlings in the substrate (Figures 05 and 06, A; C; E), growth rate is measured from the height difference between the first and the last leaf insertion branch. With 17 days of plant implantation in the experiment, there was a significant increase in the growth rate from 0.1 to about 0.4 cm per day in all treatments, occurring due to the application of the first nutrient solution that provided the plants, among other nutrients, , supplementation that under salt stress has been reported to improve the stability of cell membranes through their interaction with phosphates and proteins in the membranes, thus strengthening their stability (HONG-BO; LI-YE; MING-AN, 2008).
The application of the nutrient solution caused the growth rate to fluctuate throughout the experimental period, so that, whenever there was an application, the growth rate increased and decreased again over the period of time until the application of the next solution (Figures 05 and 06, A; C; E). Pitann et al. (2011) state that the lower growth rate in grain legumes under saline stress is attributed to the lack of acidification of the cell wall, which plays a key role in stimulating growth by activating dependent cell wall loosening enzymes pH, involved in the growth and increase of cells (RAYLE; CLELAND, 1992).
Although there is no statistical difference between the treatments in the AGR (Table 03), the effect of an increase in the absolute growth rate after the application of the nutrient solution was more expressive for the treatments with lower NaCl contents, which can be observed for the control treatment that presented 0.8 cm per day in growth, while plants submitted to an electrical conductivity of 52 dS.m showed a growth of 0.35 cm per day.
IV. CONCLUSIONS
The absolute growth rate in the different electrical conductivities are statistically equal, a condition evidenced by the analysis of variance, using the F test at 5% probability, which considered statistically valid the null hypothesis and by grouping the representative points the absolute growth rate, through the analysis of the electrical conductivities of 3.38 dS.m and 29.9 dS.m , explaining 70% of the behavior, indicating close values in the plotted points;
Throughout the experimental period, the absolute growth rate was implemented around 0.1 cm per day for all treatments until the seventeenth day after the installation of the seedlings on the sand substrate;
The existing correlation for RGR in the different treatments generated linear regression:
Where the estimated data represent 99.74% of the observed data, demonstrating that young african mahogany plants show sensitivity in their daily growth, when subjected to different concentrations of NaCl.
All NaCl concentrations developed a statistically difference in height as a function of the time periods analyzed after 120 days, however, in the different treatments of E.C there was no difference in plant height, reinforcing the fact that the species Khaya senegalensis adapted to conditions of changes in electrical conductivity, provided by different concentrations of NaCl, due in part to the use of nutrient solution;
The application of the nutrient solution caused the growth rate to fluctuate throughout the experimental period, so that, whenever there was an application, the growth rate increased again decreasing over the period of time until the application of the next solution.