

Introduction
Housing shortages remain a persistent development challenge across Sub-Saharan Africa (SSA) despite sustained policy efforts to deepen housing finance (Gardner et al., 2021; World Bank, 2015). Standard housing theories predict that financial deepening should stimulate housing stock accumulation by relaxing affordability constraints and improving developers’ access to long-term capital (Jud and Winkler, 2003; McQuinn and O’Reilly, 2008; World Bank, 2015). However, growing empirical evidence indicates that credit expansion often fuels asset price inflation without generating proportional increases in residential housing stock (Agnello et al., 2020; Barone et al., 2021; Kohl, 2021). Much of this evidence originates from advanced economies, where mortgage markets and land institutions are relatively well developed (DiPasquale and Wheaton, 1994; Green et al., 2005; Mian and Sufi, 2009). In contrast, evidence from African economies suggests weaker and uneven transmission from credit growth to physical housing stock accumulation (Bah et al., 2018; UN-Habitat, 2016; World Bank, 2015; Collier and Venables, 2013; Makhandi et al., 2024).
The disconnect between housing finance and housing stock accumulation has also promoted a growing literature to question the assumption of a linear relationship between these two issues (Agnello et al., 2020; Barone et al., 2021; Kohl, 2021). Studies that analyzed these two issues have relied on linear modelling frameworks which impose symmetry and homogeneous effects of housing finance across sectors and over time (Malpezzi and Mayo, 1997; Hofmann, 2004). While these approaches offer tractability, they may mask important nonlinearities and asymmetries in credit transmission, particularly in developing countries which are usually characterized by segmented financial markets, informalities and institutional rigidities. Recently, studies have shown that negative and positive credit shocks, together with short- and long-run effects, may differ substantially in magnitude and direction, especially where housing finance is constrained by land markets and regulatory frictions (Shin et al., 2014; Bahadir and Gumus, 2016; Akinci and Olmstead-Rumsey, 2018).
We examine the housing finance-stock relationship using Kenya as a case study. Over five decades, the country has implemented multiple housing finance reforms and developed relatively advanced housing finance institutions compared to many African economies (World Bank, 2011; Makhandi et al., 2024). Despite this financial deepening, housing stock accumulation has consistently lagged demand, resulting in a large and persistent housing deficit (World Bank, 2017; Feather and Meme, 2019). This divergence makes Kenya a useful case for examining whether housing finance reforms have translated into additions to residential housing stock. Empirically, we employ a nonlinear autoregressive distributed lag (NARDL) framework to test for both the short-run and long-run dynamic effects while distinguishing between residential and non-residential housing stock. This study makes three main contributions. First, we provide new empirical evidence on Kenya’s housing sector using a long time series (1970-2024), extending existing work that has largely focused on housing prices or mortgage markets development in isolation (De Rezende, 2025; Idrovo-Aguirre and Lozano, 2025; Kishor, 2023). Second, by applying NARDL bounds testing, we identify asymmetric effects of housing finance shocks on housing stock accumulation, allowing positive and negative credit movements to exert differential impacts over time. Finally, by separating residential from non-residential housing stock, the analysis directly tests for sectoral bias in housing finance allocation, which is a dimension that is largely overlooked in the existing literature.
The rest of the paper is structured as follows. [kenyas-housing-finance-and-policy-landscape] gives an outline of Kenya’s housing finance and housing stock history to illuminate the general structure of the two aspects in the country. [literature-review] reviews the theoretical and empirical literature on housing stock accumulation, finance and affordability. [methodology] presents the methodology while [results] highlights the main results of the study. [discussion-and-conclusion] concludes by giving a general discussion and policy implications of the study.
Kenya’s housing finance and policy landscape
Kenya’s housing finance market has expanded in absolute terms but remains very shallow relative to the size of the economy. By the end of 2023, Kenya had approximately 30,015 outstanding mortgage loans valued at Ksh 281.5 billion, equivalent to about 1.86% of GDP (Cheruiyot and Makhandi, 2024). This mortgage penetration remains low, even by regional standards, with nominal interest rates averaging about 14.3% and fewer than 10% of the households holding a home loan (Makhandi et al., 2024). Further, only about 11% of Kenyans can meet the income and collateral requirements for conventional credit lending, which results in heavy reliance on non-bank financing mechanism. Savings and Credit Cooperative Organizations (SACCOs) account for the majority of housing finance in Kenya (Makhandi et al. 2024; Feather and Meme, 2019), accounting for the majority of housing-related credit outside commercial credit, particularly for low- and middle-income households (Makhandi et al., 2024). Kenya faces a persistent housing shortage, with annual demand estimated at about 250,000 units compared to formal housing stock of roughly 50,000 units per year, resulting in a cumulative housing deficit exceeding two million units (World Bank, 2017; Kilonzo et al., 2025). The shortage is concentrated in urban areas, particularly in Nairobi, where informality remains the dominant mode of housing provision (Habitat for Humanity, 2024). Further, affordability pressures are severe in the country, with housing costs absorbing a substantial share of household income and formal homeownership largely limited to upper-income groups (Makhandi et al., 2024; Ogada et al., 2025). Overall, Kenya combines relatively developed banking and credit institutions with persistently low levels of housing finance penetration, homeownership and formal housing stock accumulation.
Housing policy in Kenya has evolved through distinct regimes. In the post-independence period, housing provision was dominated by the state, with public institutions financing and supplying housing as a social good (Republic of Kenya, 1966). This model weakened during the 1980s following fiscal crises and Structural Adjustment Programs (SAPs), which curtailed public investment and led to a collapse in state-led housing stock accumulation (Swamy and DEC, 1994; Rono, 2002). The withdrawal of the state was not offset by private sector expansion, resulting in the rapid growth of informal settlements and the concentration of formal housing provision among higher-income groups (DezynBild, 2025; Rono, 2002). From the early 2000s, housing re-emerged as a policy priority through strategies like the Economic Recovery Strategy (ERS) and Vision 2030, alongside constitutional recognition of the right to adequate housing in 2010 (Mwenzwa et al., 2008; Republic of Kenya, 2016). Subsequent reforms increasingly emphasized market-based and financial instruments. Some of the initiatives included the development of the Real Estate Investment Trusts (REITs), the Kenya Mortgage Refinance Company (KMRC), and the affordable housing program (Cytonn, 2025; KMRC, 2023; Omagwa, 2021). Despite increased reliance on financial instruments such as REITs and the establishment of the KMRC, the extent to which these initiatives have translated into sustained residential housing stock accumulation remains an open empirical question. Kenya therefore presents a setting in which financial deepening coexists with persistent housing deficits, providing a useful case for examining the finance-stock relationship.
Literature review
Standard housing economics predicts that expanded access to housing finance should support housing investment by easing affordability constraints and reducing financing frictions faced by developers. The argument is that credit deepening raises effective demand lowers user costs, thereby accelerating the accumulation of housing stock over time (Jud and Winkler, 2003; McQuinn and O’Reilly, 2008). However, this prediction relies on institutional conditions that are often weak in African housing systems. Kenya presents a salient case where the relationship between housing finance and housing stock accumulation is plausibly nonlinear and uneven in terms of sectors. Over time, the country has expanded formal housing finance institutions and mechanism, yet mortgage penetration remains low and residential housing deficits persist (World Bank, 2017; Feather and Meme, 2019; Cheruiyot and Makhandi, 2024). A growing body of Kenya-focused evidence suggests that credit availability interacts with land markets, and regulatory constraints in ways that weaken the pass-through from finance to physical residential construction. Urban land dynamics are central to this process. Empirical and policy studies document how land values in Nairobi and its peri-urban corridors respond strongly to anticipated infrastructure investments and planning decisions, encouraging speculative holding rather than immediate construction (Kenya Institute for Public Policy Research and Analysis [KIPPRA], 2016). In such settings, expansions in housing finance are absorbed through land acquisition and asset trading, raising prices without generating proportional additions to residential housing stock. Kenya’s housing delivery system is also highly segmented. Formal housing finance products and developer finance are designed for titled, standardized housing, while a substantial share of urban housing demand is met through incremental building financed by savings, cooperative lending, and informal arrangements (Feather and Meme, 2019). This segmentation implied that aggregate measures of bank credit to construction and real estate may not map cleanly onto the financing constraints that govern residential housing stock accumulation.
Beyond Kenya, a broader literature questions the assumption. Studies from advanced economies show that credit supply shocks often transmit more strongly into house prices and asset valuations than onto construction activities, particularly where the constraints are binding (Favara and Imbs, 2015; Agnello et al., 2020; Kohl, 2021). Political economy perspectives complement this view by emphasizing that housing finance may privilege rent-bearing and commercially viable assets over mass residential delivery, generating sectoral bias in built-environment outcomes (Aalbers, 2017; Fernandez and Aalbers, 2016). These insights are especially relevant for developing economies, where land governance challenges, construction bottlenecks, and income constraints limit the responsiveness of residential housing stock to credit expansion. In such contexts, positive shocks may be absorbed through higher land values and non-residential investment, while negative shocks can disproportionately constrain residential construction by tightening already binding financing conditions.
Empirical evidence from African countries supports this asymmetric and segmented view of housing finance. In Ghana, studies highlight how macroeconomic instability, collateral constraints, and underwriting standards restrict the reach of housing finance markets and limit their contribution to broad-based housing development (Boamah, 2011). Micro-level evidence further shows that access to credit for housing construction often depends on landed property arrangements that do not scale easily into formal housing finance, this reinforces reliance on incremental building (Edwin, 2023). In Rwanda, analysis of Kigali’s housing market indicates that housing finance interacts strongly with income constraints and housing costs, with limited evidence that credit expansion alone resolves affordability or quantity shortfalls (Iyandemye, 2018). Similarly, work from Tanzania by Mushi (2020) suggests that housing finance dynamics are shaped by broader macro-financial conditions and cross-sector linkages rather than a simple finance-to-construction mechanism. Developer-focused evidence from Ghana further shows reliance on buyer deposits hybrid financing arrangements (Kavaarpuo et al., 2024), similarly in Nigeria, housing finance only explains a small share of variation in housing stock accumulation (Ofori, 2024; Nwachukwu et al., 2025). Generally, these Africa studies highlight the limited role of conventional bank credit in driving residential housing stock growth.
Against this backdrop, two gaps motivate the present study. First, much of the existing literature, both globally and in Africa, focuses on house prices, mortgage uptake, or housing market indicators, rather than on housing stock accumulation, which is central to policy debates on housing shortages. Second, few empirical studies explicitly distinguish between residential and non-residential housing stock, despite strong theoretical and institutional reasons to expect sectoral bias in credit allocation. By applying an asymmetric modelling framework and disaggregating housing stock by sector, this study provides new evidence on how housing finance interacts with Kenya’s housing system and whether credit deepening supports residential housing delivery or is absorbed into commercially oriented real estate activities.
Methodology
Empirical strategy
This study examines the long-run relationship between housing finance and housing stock in Kenya using annual time-series data (1970-2024). Given the documented institutional rigidities, segmented credit markets, and potential sectoral bias in credit allocation in developing and African housing systems (World Bank, 2015; Aalbers, 2017; Bah et al., 2018), the empirical strategy departs from standard linear specifications. Instead, the study adopts a NARDL framework to explicitly capture asymmetric long-run and short-run effects of housing finance on housing stock accumulation. The choice of nonlinear approach is motivated by both theory and prior empirical evidence. As discussed in [literature-review], housing finance expansions and contractions may have unequal effects on construction activity. In particular, positive credit shocks may be absorbed through asset revaluation or non-residential investment, while negative shocks disproportionately constrain residential supply (Favara and Imbs, 2015; Aalbers, 2017; Archer and Cole, 2021). Linear models impose symmetry and risk masking these dynamics. The NARDL framework proposed by Shin, Yu, and Greenwood-Nimmo (2014) allows for decomposing housing finance into positive and negative partial sums, thereby permitting asymmetric adjustment paths in both the short and long run. Importantly, the NARDL approach is well suited to the Kenyan context for three additional reasons. First, it accommodates variables integrated of order I(0) and I(1). Second, it performs well in small samples (Shin et al., 2014), which is appropriate given the available time series. Third, it permits simultaneous estimation of short-run dynamics and long-run relationships within a unified framework, subject to bounds testing for cointegration.
Model specification
To examine the asymmetric effects of housing finance on housing stock accumulation, the following long-run relationship is specified:
Where denotes housing stock, represents housing finance, and is a vector of control variables capturing macroeconomic and cost-side determinants of construction activity. Following Shin et al. (2014), housing finance is decomposed into positive and negative partial sum processes:
The corresponding NARDL error-correction specification is expressed as:
Where captures the speed of adjustment toward the long-run equilibrium, while and measure the long-run effects of positive and negative changes in housing finance respectively. Asymmetry is formally tested using Wald tests on the equality of these coefficients. The vector of control variables includes real income per capita, construction costs and real interest rates. Income captures the effective demand for housing, while construction costs proxy the supply-side constraints related to materials and labor. Real interest rates reflect the broader cost of capital facing developers and households beyond housing finance-specific channels. Prior to estimation, unit root tests are conducted to confirm that none of the variables are integrated of order I(2), a necessary condition for NARDL estimation. Bounds testing is then used to assess the existence of a long-run relationship among the variables. Following estimation, standard diagnostic tests are applied to assess serial correlation, heteroskedasticity, parameter stability and functional form. Finally, dynamic multiplier functions are also computed to trace the adjustment paths of housing stock accumulation following positive and negative shocks to housing finance. These multipliers provide intuitive insights into the speed and persistence of asymmetric responses across residential and non-residential sectors.
A key contribution of this study is the explicit distinction between residential and non-residential housing stock accumulation. The baseline model is therefore estimated separately for residential housing stock and non-residential building stock. This distinction is prompted by strong theoretical and empirical evidence that housing finance in developing economies is disproportionately allocated toward commercial and high-return real estate projects. Estimating separate equations allows the analysis to identify whether housing finance expansion translate into physical residential construction or are instead absorbed by non-residential investment. This sectoral disaggregation avoids aggregation bias present in much of the existing literature and directly speaks to policy debates on the effectiveness of housing finance interventions.
Data
The study uses annual time-series data for Kenya covering the period 1970-2024. Variable selection follows standard stock-adjustment models linking income, construction costs, and credit conditions to long-run housing stock dynamics. All variables are expressed in natural logarithms to allow elasticity interpretation and reduce heteroskedasticity, except interest rates, which are maintained in percentage form. Housing stock is the dependent variable and is measured as the logarithm of total physical housing stock accumulation, computed as the aggregate of residential and non-residential housing stock. These data are obtained from the Kenya National Bureau of Statistics (KNBS) statistical abstracts. To examine sectoral heterogeneity, residential and non-residential housing stock are also analyzed separately. Housing finance is measured as the logarithm of total commercial bank credit to the building, construction and real estate sectors, and therefore encompasses, but is not limited to formal mortgage lending, the data is sourced from KNBS economic surveys. Following a sectoral reclassification in 2010 that separated real estate from general construction finance, post-2010 housing finance is computed as the aggregate of credit to both categories to ensure consistency over time. This variable serves as a proxy for credit availability to households and developers. Economic conditions are captured by real GDP per capita (log), sourced from the World Development Indicators (WDI), which proxies household income and effective demand. Construction costs are measured as the logarithm of a composite index combining residential and non-residential construction costs in constant Kenyan shillings, obtained from KNBS. The cost of capital is proxied by the real lending interest rate (percentage), sourced from WDI, capturing borrowing costs faced by both households and developers. Table 1 presents the summary statistics for these variables.
| Mean | SD | Min | Max | |
|---|---|---|---|---|
| Total Stock | 7.73 | 1.05 | 6.40 | 10.00 |
| Residential | 7.64 | 1.02 | 6.15 | 9.80 |
| Non-Residential | 4.95 | 1.60 | 2.40 | 8.30 |
| Housing Finance | 9.12 | 2.85 | 4.12 | 13.31 |
| Per capita income | 11.81 | 0.15 | 11.37 | 12.17 |
| Interest rates | 16.15 | 6.44 | 8.50 | 36.24 |
| Construction costs | 8.07 | 2.20 | 5.27 | 12.10 |
| Observations (N) | 55 |
Descriptive Statistics
NB: SD is the standard deviation, while min and max are the minimum and maximum values respectively
The summary statistics highlight the relatively slow growth of residential housing stock compared to income and construction costs, foreshadowing the weak housing finance-stock linkage explored in the econometric analysis. Figure 1 plots the evolution of housing stock and housing finance over the sample period and provides a preliminary visual assessment of their long-run co-movements. While both series exhibit upward trends, their trajectories differ across sub-periods, suggesting the possibility of nonlinear and asymmetric adjustment dynamics. These features motivate the empirical strategy adopted in subsequent analysis.
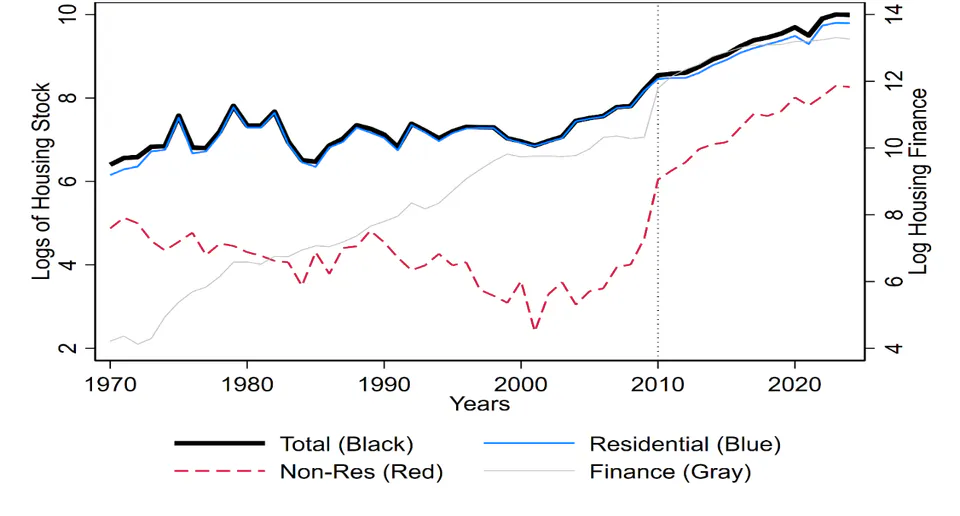
Trends in housing stock and housing finance in Kenya
Results
The results provide evidence on structural transmission mechanisms of housing finance within the Kenyan housing market, rather than on the effects of specific credit policies. Consistent with this literature, the results show that housing finance expansion in Kenya primarily affects non-residential construction, with no proportional increases in residential housing stock.
Unit root and cointegration tests
The Zivot-Andrews test (ZA) unit root test is employed in place of standard ADF tests which often mistake a structural shift from a unit root (Lanne et al., 2002). ZA allows the break date to be determined endogenously within the data and thus allowing for endogenous identification of structural breaks relevant to the Kenyan housing market. The results are shown in [tab:zivot-andrews-unit-root].
| t-statistic | Break Year | Lag (AIC) | Decision | |
|---|---|---|---|---|
| Ln HS | -4.897* | 1999 | 0 | Stationary at 10%, |
| Ln HF | -4.761 | 2010 | 1 | Non-Stationary, |
| Ln Y | -4.116 | 2000 | 1 | Non-Stationary, |
| R | -3.529 | 1999 | 0 | Non-Stationary, |
| Ln C | -5.637*** | 2007 | 0 | Stationary at 1%, |
Zivot-Andrews unit root test results
Note: Critical values for Model C (Intercept and Trend) are -5.57 (1%), -5.08 (5%), and -4.82 (10%). *** and * denote significance at 1% and 10% levels respectively. I (0) means the variable is integrated of order zero (stationary in raw form), while I (1) imply they are integrated of order one (the variables are non-stationary in their raw form but become stationary after first difference).
In terms of structural breaks, the test identifies a significant structural break in 1999, 2000, 2007 and 2010. The break in 1999 affected housing stock and interest rates while the shock in 2000 was observed in economic growth. The 1999/2000 coincides with the turn of the millennium where the country faced one of the difficult periods in economic history (KNBS, 2000). For example, real GDP plummeted to 1.4% in 1999 and reached a near-stagnation point of 0.2% in 2000. This period coincided with a severe drought and extensive power rationing, which disrupted industrial production and construction activities (Reliefweb, 2000). Finally, the financial sector also faced high levels of non-performing loans (Central Bank of Kenya, 1999). The structural break in 2007 is observed on construction costs coincides with the peak economic performance (6.3% growth) of the country before the post-election violence of 2008 (KIPPRA, 2013). In 2007, there was a massive global spike in commodity prices like oil, steel and cement (Hamilton, 2009). In Kenya, this was exacerbated by an aggressive push in infrastructure and private real estate development just before the 2008 crisis (Hope, 2010; Nyaosi, 2011) and thus fundamentally shifting the cost floor for the construction industry. The structural break in housing finance identified in 2010 corresponds to the structural shift from the generic ‘building and construction sector’ to the inclusion of a dedicated ‘real estate’ segment (KNBS, 2010, 2011). Further, in 2010, the country adopted a new constitution which explicitly made adequate housing a fundamental right (Republic of Kenya, 2016), signaling a long-term shift in how housing is financed and governed.
Short-run analysis
The NARDL short-run estimates in [tab:comparative-nardl] capture the immediate shocks and the subsequent speed of adjustment to equilibrium. The Error Correction Terms (ECT) for housing stock and for residential housing stock are negative and statistically significant (-0.571 and -0.642 respectively), while for Non-residential housing stock it is negative (-0.185) but not statistically significant. The significant results imply that approximately 57% and 64% of any supply-side disequilibrium is corrected within a single year. The statistically insignificant coefficient of NHS suggest that commercial housing stock appears less strongly anchored to macroeconomic fundamentals. Housing finance shocks show no statistically significance effects on housing stock except for NHS. The positive and significant coefficient on the positive shocks of HF (0.498) provides econometric evidence consistent with a ‘commercial bias’, where in the short-run, credit expansion is associated with increased non-residential construction activities but has no statistically significant effect on residential housing accumulation. The lagged income term for RHS (2.030) and the lagged construction cost (0.224) are both significant which shows that the residential developers in the country do not just react to current conditions but are heavily influenced by the previous year’s economic growth and the price signals when making supply decisions. Finally, the constant term for the RHS model is significant and negative (-20.301) which suggests the presence of persistent structural constraints in the Kenyan residential housing market, where in the absence of income growth or financial stimulation, the residential housing stock faces a systemic baseline contraction.
| HS | RHS | NHS | |
|---|---|---|---|
| -0.571*** | |||
| (0.137) | |||
| 0.205 | 0.204 | 0.498* | |
| (0.192) | (0.201) | (0.285) | |
| -0.058 | -0.064 | 0.055 | |
| (0.089) | (0.093) | (0.135) | |
| 0.052 | 0.069 | -0.092 | |
| (1.212) | (1.266) | (1.852) | |
| -0.277 | -0.469 | 1.094 | |
| (1.014) | (1.057) | (1.596) | |
| 1.644 | 1.575 | -1.502 | |
| (1.545) | (1.601) | (2.533) | |
| 1.825* | 2.030* | -0.505 | |
| (1.024) | (1.060) | (1.462) | |
| 0.246** | 0.236* | 0.464** | |
| (0.119) | (0.125) | (0.175) | |
| 0.223** | 0.224** | 0.202 | |
| (0.107) | (0.108) | (0.189) | |
| -0.008 | -0.007 | 0.029 | |
| (0.015) | (0.015) | (0.022) | |
| -0.011 | -0.012 | -0.016 | |
| (0.007) | (0.008) | (0.011) | |
| -0.642*** | |||
| (0.139) | |||
| -0.185 | |||
| (0.112) | |||
| Constant | -18.590 | -20.580* | 5.659 |
| (11.594) | (12.011) | (16.863) | |
| N | 53 | 53 | 53 |
Comparative NARDL Results
NB: Standard errors are in parentheses with * p < 0.10, ** p < 0.05, *** p < 0.01.
Long run analysis
In terms of the long run relationship, [tab:comparative-long-run] shows the steady-state relationship between the housing stock and its fundamental drivers after all the short-term volatilities have dissipated. A central observation in this study is the dominance of economic growth as the engine of residential housing stock accumulation. For RHS, the long-run income elasticity is estimated at 3.161* (p<0.10). This suggests that a 1% increase in real GDP per capita triggers a more than 3% expansion in the physical residential stock over the long term. This finding provides strong empirical support for the Affordability principle in the Kenyan market, where residential developers are primarily sensitive to the effective demand that is generated by rising household incomes. The long-run elasticity of housing finance for the residential sector is not statistically significant. This is consistent with a housing finance-stock paradox in the Kenyan context; despite the post-2010 financial deepening and the institutionalization of credit liquidity facilities, formal credit has failed to act as a long-term catalyst for the physical expansion of homes in the country. This neutrality suggest that credit expansion is likely being absorbed by price inflation and land speculation (Favara and Imbs, 2015; Kohl, 2021; Norris and Lawson, 2023), rather than the production of new residential units. In contrast, the elasticity of non-residential housing sector though not significant, it is slightly higher, suggesting that the few gains from credit deepening are structurally skewed towards the commercial real estate.
For construction costs, contrary to the traditional cost-push theories, the variable show a positive and significant long-run effects on both the HS and RHS. This shows that in periods of rising construction costs, developers may perceive rising costs as an indicator of asset value appreciation which encourages them to increase supply to capture future capital gains (Ngugi and Wamugo, 2016; Njaramba et al., 2018). In contrast, for NHS, the coefficient is not statistically significant, suggesting that commercial developers are less sensitive to fundamental cost signals and may be driven by other exogenous factors. Generally, comparing the three models shows that the residential sector is a fundamental real economy market, where it responds predictably to income and costs. However, the non-residential sector shows no significant long run relationship with these fundamentals. This is an indication that the financial system is increasingly fueling a commercial sector that lacks a long run equilibrium with macro-fundamentals, while the residential sector that is fundamentally stable seems not to get the financial boost it needs to close the housing stock deficit.
| HS | RHS | NHS | |
|---|---|---|---|
| LR. Income | 3.194 | 3.161* | -2.734 |
| (1.699) | (1.580) | (8.479) | |
| LR. Construction costs | 0.390* | 0.348* | 1.095 |
| (0.162) | (0.150) | (0.737) | |
| LR. Finance | -0.102 | -0.100 | 0.296 |
| (0.158) | (0.147) | (0.791) | |
| Observations | 53 | 53 | 53 |
Comparative Long-Run (LR) Elasticities
Comparative Bounds Test of cointegration
The Pesaran et al. (2001) Bounds test provides the formal verification of the long-run structural stability of the three models as seen in [tab:bounds-test]. The results indicate a significant sectoral decoupling in the Kenyan built environment. The residential model (RHS) yields an F-statistic of 3.858 which exceeds the 10% upper bound critical value. This confirms that the residential housing market is robustly cointegrated with macroeconomic fundamentals. As such, despite the volatility of the Kenyan economy, residential housing stock accumulation remains anchored to a predictable long-run path that is determined by income and costs. In contrast, the non-residential sector yields and F-statistic of 2.245, which is below the lower bound I (0) critical value. This suggests that the NHS market is not cointegrated with the macro-economy. This lack of a stable long run relationship implies that the commercial boom (malls and offices) is driven by erratic speculative capital or external investment shocks that do not follow the country’s fundamental income and cost cycles.
| I (0) | I (1) | |
|---|---|---|
| 10% critical value | 2.393 | 3.583 |
| 5% critical value | 2.848 | 4.16 |
| 1% critical value | 3.928 | 5.408 |
| F Statistic | ||
| Housing Stock | 3.228 | |
| Residential Housing stock | 3.928 | |
| Non-Residential Housing Stock | 2.245 | |
NB: Number of observations for each model is 52, No regressors (k) are 5 for each and the cases are 3
[fig:comparative-dynamic-multipliers] provides a visual simulation of how a 10% positive shock to housing finance propagates through the different sectors over a 20-year horizon. The figure confirms the disparate sensitivities identified in the econometric tables. Panel B that represents RHS, shows that the impulse response function is remarkably flat. This demonstrates that following an initial credit shock, the multiplier fails to maintain a significant upward trajectory and quickly reverts to the origin. This validates the marginality of credit in the residential sector, specifically, even a significant expansion in finance, does not trigger a persistent or meaningful shift in the supply of homes. In sharp contrast, panel C for NHS exhibits a persistent and significant upward shift. [fig:comparative-dynamic-multipliers] illustrates the sectoral bias of financial deepening in Kenya, where credit expansion disproportionately supports commercial real estate while residential housing stock accumulation remains largely unresponsive. As such, the post-2010 financial surge has mainly fueled the commercial landscape of malls and offices while the residential gap continues to widen.
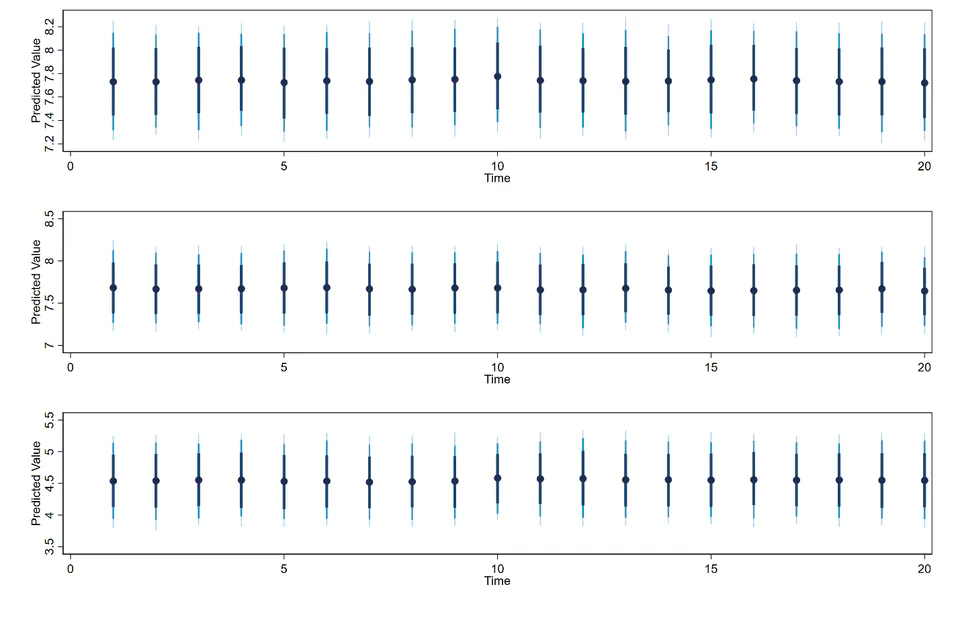
Comparative Dynamic Multipliers (10% Finance Shock)
Discussion and conclusion
The findings indicate that expansion of housing finance in Kenya does not automatically translate into sustained residential housing stock accumulation. While housing finance shocks are associated with short-run adjustments in non-residential housing stock, the long-run effect on residential housing stock is statistically insignificant. This asymmetric pattern is consistent with structural features of Kenya’s housing system discussed in literature. First, the limited responsiveness of residential housing stock to housing finance aligns with evidence on land market rigidities and regulatory constraints. Where land speculation and planning delays are prevalent, like in Kenya (KIPPRA, 2016; Kinuthia, 2021), credit expansion may be absorbed through asset revaluation rather than immediate construction activity. Second, the results reinforce the segmentation argument highlighted in both Kenyan and broader Africa research. Formal housing finance remains concentrated among higher-income households and formally titled properties, while a substantial share of housing provision occurs through incremental building supported by savings, cooperative finance and informal mechanisms (Feather and Meme, 2019; Makhandi et al., 2024). Under these conditions, aggregate credit expansion may not effectively relax the financing constraints that govern mass residential housing production. The stronger short-run response of non-residential housing stock is consistent with political economy perspectives on housing financialization, which emphasize the preferential allocation of capital toward commercially viable real estate assets (Aalbers, 2017; Fernandez and Aalbers, 2016). The absence of cointegration in the non-residential model further suggests that commercial real estate dynamics may be influenced by cyclical or speculative factors rather than stable macroeconomic fundamentals. More broadly, the findings echo evidence from other African countries where credit expansion has not resolved housing quantity shortages. Research from Ghana, Rwanda, Tanzania and Nigeria highlights how collateral constraints, macroeconomic volatility and developer financing structures limit the capacity of formal housing finance to generate broad-based housing stock growth (Boamah, 2011; Iyandemye, 2018; Mushi, 2020; Ofori, 2024). The positive long-run association between construction costs and residential housing stock should be interpreted cautiously. Rather than implying that higher costs mechanically stimulate supply, the result may reflect periods in which rising costs coincide with expectations of asset appreciation and sustained demand.
In conclusion, the results point to a structural decoupling within Kenya’s built environment. Residential housing stock accumulation remains anchored to income growth and construction costs dynamics, while non-residential stock exhibits weaker long-run ties to macroeconomic fundamentals. Housing finance deepening, although institutionally significant, appears insufficient on its own to close Kenya’s residential housing deficit. From a policy perspective, these findings suggest that housing finance-led strategies alone may be insufficient to generate sustained residential housing stock expansion. While initiatives like KMRC may improve liquidity within formal markets, complementary reforms addressing land governance, planning efficiency and construction costs are likely necessary to strengthen the transmission from housing finance to residential housing stock accumulation.