
I. INTRODUCTION
West Africa is reputed to be the epicenter of HIV-2 infection [1]. This HIV profile was also endemic in the same geographic area [2]. In Mali, the first AIDS case was identified in 1985 [3]. In this country, the early studies reported a dominance of HIV-2 on HIV-1 [4, 5, 6, 7]. However, an anterior study conducted in patients admitted in pneumophytisiology setting revealed HIV-1 more prevalent in the sub-study population of non-tuberculosis patients [8]. Unlike the prior studies, more or less recent works conducted in this country reported an opposite trend . However, in the country, a significant higher HIV-2 prevalence was observed in 2010 in older women than in young ones (in 2009), despite a high HIV-1 dominance in the both populations . This HIV-2 trend in older adults contrasting with the low trend in young ones, aroused our curiosity to analyze the dominance of the HIV-1 infectious profile that seems plausible in Mali.
II. METHODOLOGY
a) Procedure
This narrative review consisted of analyzing the data from preview studies concerning HIV infection in Mali. We have pursued a bibliographic search focused on HIV studies (subject or not to publication in scientific reviews) undertaken in Mali from 1985 to 2010. The FMPOS theses file, as well as papers related to HIV/AIDS topic, were consulted and exploited for data collection and analysis. We prioritized studies having documented the serotypes profiles (HIV-1, HIV-2, and HIV-1/2), by using a discriminatory or confirmatory test. We structured the argumentation around the following criteria: study period, publication date and reference; study population including hospital patients, prostitutes, pregnant women, blood donors, general population; study sample size; study population characteristics such as ages, average age, gender, underlying diseases, clinical symptoms, risk factors; stratification by age (<50-years-old and >50-years-old); testing for HIV serotypes profiles discrimination using immunochromatography, Western Blot or Line Immunoassay principle; typology of the publication such as abstracts or full text from international journals, meetings or conferences presentations, theses and reports.
b) Statistical Analysis
Results are presented as mean SD (range) for continuous variables and frequencies (%) for categorical variables. Categorical variables were compared between the groups using a chi-square test. Results were significant at the 5% level (p<0.05). Linear Regression model was used to analyze the HIV profiles trends. Calculations were done using Excel Software.
c) Human Subjects
This proposed study uses an anonymous secondary data set, and does not qualify as human subject research.
III. RESULTS
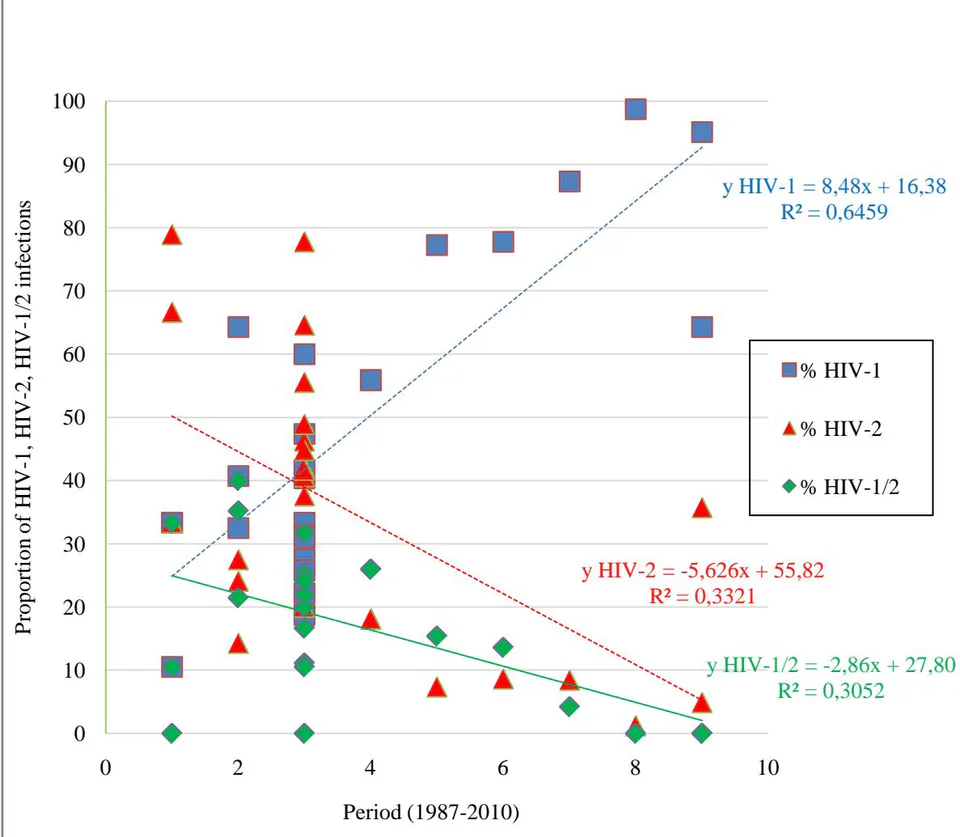
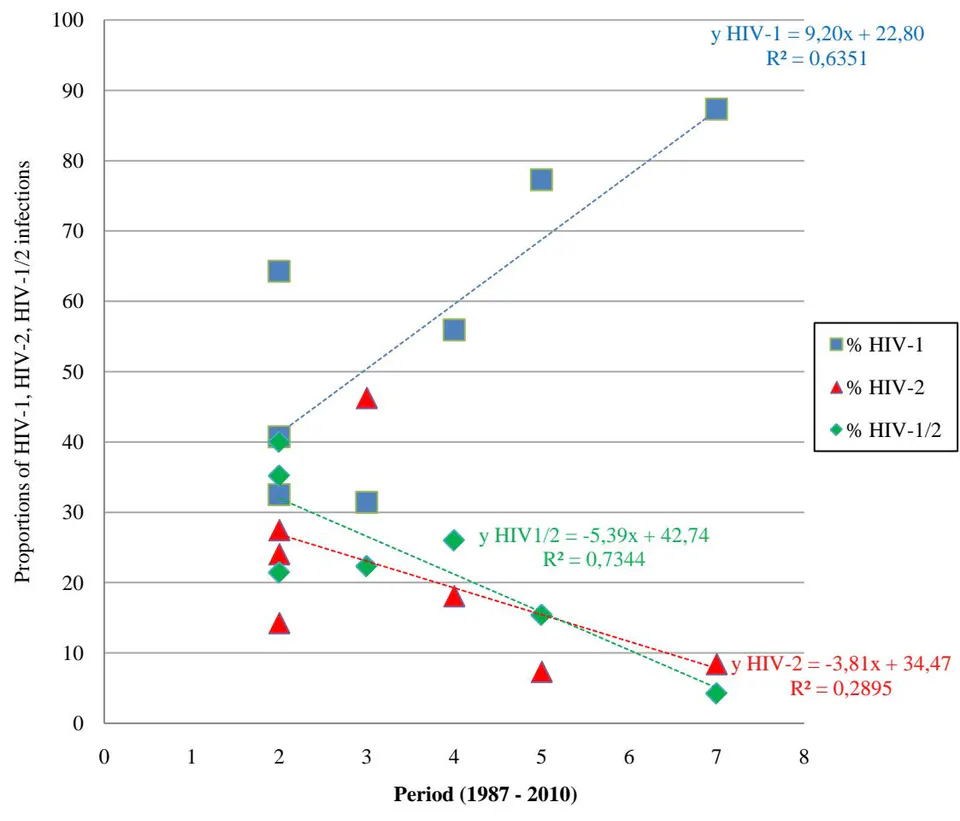
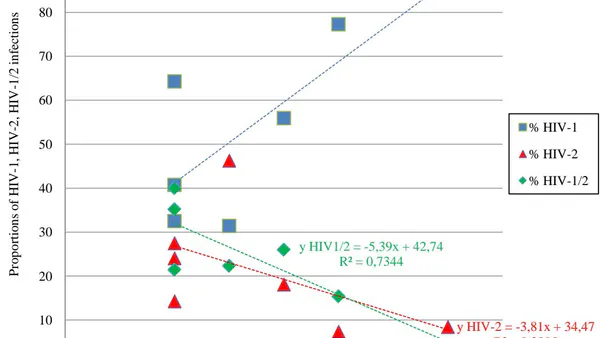
A total of 17 studies were exploited. They mainly concerned health care patients and prostitute women populations (Table 1), as they are likely to be more exposed to HIV infection than the general population. Samples size in these studies ranged from 23 to 3179 subjects (Table 2). Regarding the stratification of population by age (<50-years-old versus >50-years-old), a study revealed that despite HIV-1 prevalence was high in both strata, HIV-2 was significantly more prevalent in the older populations than in younger (2/1000 vs. 5/231) (p = 0.0003). Out of 17 studies reviewed nine only documented in full HIV serotype profiles from the abstract and/or full text (Table 2). This table also informs on HIV prevalence that ranges between 0.73% and 75.79%. The lowest prevalences were observed in blood donors and pregnant women. The prostitutes and health care patients were the most affected. When one considers only the prostitutes populations (Table 2), a significant regression of HIV-2 can be observed between 1987-1989 and 1995 (65/517 vs. 7/176) (p = 0.001). Conversely, HIV-1 increased significantly during the same period (36/517 vs. 63/176) (p<0.0001). As far as health care patients are only concerned, there was a significant increase in HIV-1 ( ) while HIV-2 significantly regressed ( ). Furthermore, when taking into account the overall population, a similar trend can be observed ( ) vs ( ). The chronology of events, as well in all the populations studied as in health care patients taken alone (Table 2 and 3; fig1 and 2), shows that both infectious profiles have pre-existed in Mali, but with an initial predominance of HIV-2 and change toward HIV-1 that occurred probably between 1990 and 1994.
IV. Discussion
A Malian study reported a higher HIV seroprevalence in prostitutes in 1991 (70%) [21]. In Mali, HIV prevalence of 4.1% (41/1000) was measured in 2009 in pregnant women (young women), with a higher dominance of HIV-1 (95%) [19, 22]. This seroprevalence measured in 2009 in the Bamako district was comparable to 3.5% (183/5224) reported in 2006 in pregnant women recruited from seven locations (including Bamako) across the country [23]. Likewise, in 2010, HIV seroprevalence 6.1% (14/231) measured in older women did not differ from 4.1% reported in young ones [19, 22]. By contrast, the proportion of HIV-2 was significantly higher in older women than in younger ones, 2.16% (5/231) vs. 0.2% (2/1000); p <0.001. The HIV epidemiological profile between 1985 and 2010 shows at the beginning of this observation period HIV-2 dominance; a trend that has been reversed later in favor of HIV-1, which is still dominant today. Indeed, several studies have revealed the dominance of HIV-1 between 1988 and 2010 [9-20], unlike the first studies undertaken in Mali between 1985 and 1989 [4, 5, 6, 7]. This new trend in favor of HIV-1 dominance contrasts a priori with evidence that West Africa is the epicenter of the epidemiology of HIV-2 [1]. Our work is limited by the lack of representativeness from some preliminary studies undertaken and reported in Mali. It suffered equally from the data insufficiency related to HIV infectious profiles in some documents consulted. Guinea-Bissau (a West African country) is described as the epicenter of the HIV-2 epidemic [24]. In the same country, HIV-1, HIV-2 and HIV-1/2 seroprevalence were respectively 1.1%, 8.4% and 0.1% for the period of 1992-1995 and 7.7%, 5.1% and 1.9% in 2005 [25]. Between February 1987 and May 1988, the Central Hospital of Dakar registered HIV-1 frequency comparable to that of HIV-2 46% (50/109) vs 40% (44/109); p > 0.05 [26]. In the same city, prevalence rates for HIV-1 (6%), HIV-2 (3.6%) and HIV-1/2 (0.4%) were reported, in 2000, among sex workers [27]. In Ivory Coast, a predominance of HIV-1 was reported in 1988 [28]. In Mali, a prior study carried out in patients enrolled in a specialized hospital reported in none tuberculosis patients a rate of 5.5% (9/164) for HIV-1 vs. 1.22% (2/164) and 1.83% (3/164) respectively for HIV-2 and HIV-1/2 [8]. However, considering the totality of patients with or without tuberculosis, the frequencies were 4.58% (22/480), 2.71% (13/480), and 3.96% (19/480), respectively for HIV-1, HIV-2, and HIV-1/2. In this country, a high frequency of HIV-1 was reported in 2009 among students [20]. Bouare et al. demonstrated that HIV-2 was significantly more common in older women than in younger ones [19]. Suggesting HIV-2 infection occurred earlier (probably 20 years or more) in these older adults infected. That may explain and confirm two hypotheses: HIV-2 infection oldness and HIV infectious profile change toward HIV-1 in Mali. Moreover, from 1988 to 1992, we observe a quantitative dominance of HIV-1 2.99% (71/2378) vs. 0.97% (23/2378) and 1.39% (33/2378) respectively for HIV-2 and HIV-1/2 [9]. A study conducted between 1990 and 1999 even reported a predominance of HIV-1 with a prevalence of 58.55% (462/789) vs. 5.58% (44/789) and 11.66% (92/789) respectively for HIV-2 and HIV -1/2 [10]. It also described the growing trend of emigration between 1993 and 1998 (4.18% to 8.11%), a sexual transmission rate of 98.10%, the first peak of HIV-1 in 1992, and persistent latency observed for HIV-2. This rate of 98.10% of sexual transmission is supported by Bouare et al. [22], who reported that HIV transmission might be essentially sexual in Mali. The data for the study between 1987 and 1989 [6, 7] attributed a significant proportion of HIV infection linked to staying (since 1980) in Central Africa, West Africa, and Europe. This could partially explain the foreign exposition and contamination of the people before they come back in Mali. Other studies in Mali focused on prostitution which can explain the spread of HIV infection [4, 5, 6, 13, 14, 21]. One of them reported that the highest prevalence was among registered prostitutes in 1991, and most regions of Mali had experienced higher HIV prevalence among sex workers in 1992 compared to 1988 [21]. Also, a bibliographical study of the period 1983 to 2003 reported in 2004 the dominance of HIV-1 since 1990 and HIV-2 dominance before that time [14]. It also pointed out limitations such as poor access to studies, especially that of NGOs (Non-Governmental Organizations), and insufficient data regarding some summaries in general. Through a study conducted in 1995 in Mali regarding prostitutes mainly composed of foreign (including Nigerian and Ghanaian), Peeters and coworkers reported a significant increase in HIV-1 against a decrease of HIV-2 [13]. They also reported the similarity of this trend with those observed in the neighboring countries of Mali. They hypothesized recent contamination among women who started sex work a year (or less than a year) before they conducted their study since HIV-1 subtype G was detected. As for our study, when we consider only the population of prostitute women, significant regression of HIV -2 is observed between the periods 1987 to 1989 and 1995 [12.57% (65/517) vs. (7/176)]; p = 0.001. Conversely, HIV-1 increased significantly during the same period [6.96% (36/517) vs. (63/176)]; p < 0.0001. This is further corroborated and confirmed by the linear regression analysis related HIV infectious profile change in the both patient population ( , ; , ) and all the combined populations ( , ; , ). From the above, we suggest that the reversal of the epidemiological profile of HIV for HIV-1 probably occurred in Mali between 1990 and 1994, while Antonio Biague et al. described the HIV-1 increase and HIV-2 decline between 1992-1995 and 2005 [25]. In HIV epidemiological study context, documenting of all serotypes profiles (HIV-1, HIV-2, and HIV-1/2) and genotypes in both abstract statement and full text (usually difficult to access) are needed to track their evolution in space and time and enable more precise dating of infectious profiles to change.
In conclusion, this present work surprisingly highlighted an HIV-1 profile predominance in Mali, whereas West Africa is reputed to be the HIV-2 epicenter. The HIV profile change seems to occur between 1990 and 1994. The transmission risks and routes such as sexual, trip duration, and emigration are a fortiori highlighted. The propagation of HIV infection seems essentially linked to the sexual route in this country.
- Fomo Boniface. Profil Épidémiologique et Clinique des Infections et Affections au cours du VIH/SIDA dans les Services de Médecine Interne et.
| Publication | Study Population Characteristics | ||
| Date | Population | Age (mean±SD) | Risk Factors and other informations |
| 1987 | Prostitutes, Prisoners, Patients, Pregnant women (PW) | 26 | Prostitution, homosexuality, transfusion |
| 1988 | Prostitutes | 35 | Prostitution |
| 1988 | Patients | 35 | Voyage (stay at foreign) |
| 1989/1993 | Prostitutes, Patients, Prisoners, Women, Men | 30.18 | Prostitution (stay at foreign), widowhood, divorce, residence, tattoo, not condom use |
| 1993 | Patients | Peasants, Traders, Big travelers | |
| 1998 | Prostitutes | 28.8 | Prostitution |
| 2000 | Patients (AIDS) | ||
| 2001 | Patients | 35.19±9.45 | Sex transmission, emigration; first peak HIV-1 (1992) and HIV-2 latency |
| 2001 | Blood donors (BD) | Absence of discriminant test in 93 and 99, HIV-1 predominant (94-98) | |
| 2001 | Patients, Prostitutes, PW, BD | Prostitution (HIV seroprevalence: 70%) | |
| 2004 | Bibliographic studies of theses | Groups at risk: prostitutes, ambulatory saleswomen, coaxers, truck drivers; lack studies access, data lack in some abstracts | |
| 2004 | Patients | 37.5 ±7.93 | Stay at foreign |
| 2006 | General population | ||
| 2006 | Patients (children) | 7 | |
| 2009 | Students | More HIV-1 than HIV-2 | |
| 2012/2013 | Pregnant women/Patients | 25.2±6.3/62.1±8.6 | Not condom use, divorce, voyage |
| 2013 | Patients | 35.2±9.4 | Patients (Predominantly rural, female and young); Stage III WHO (64.5%) |
| Sample size | Serotypes HIV (%)* | HIV Frequences | P | |||||
| Date | Period | Population | N | HIV-1 | HIV-2 | HIV-1/2 | n (n1; n2; n1/2) | (%) |
| 1987 | 1 | Prostitutes | 30 | 10,53 | 78,95 | 10,53 | 19 (2; 15; 2) | 63,33 |
| 1987 | 1 | Prisoners | 23 | 33,33 | 33,33 | 33,33 | 3 (1; 1; 1) | 13,04 |
| 1987 | 1 | Patients | 42 | 33,33 | 66,67 | 0 | 9 (3; 6; 0) | 21,43 |
| 1987-1988 | 2 | Patients | 480 | 40,74 | 24,07 | 35,19 | 54 (22; 13; 19) | 11,25 |
| 1987-1988 | 2 | Patients | 316 | 32,5 | 27,5 | 40 | 40 (13; 11; 16) | 12,66 |
| 1987-1988 | 2 | Patients | 164 | 64,29 | 14,29 | 21,43 | 14 (9; 2; 3) | 8,54 |
| 1987-1989 | 3 | Prostitutes | 487 | 27,64 | 40,65 | 31,71 | 123 (34; 50; 39) | 25,26 |
| 1987-1989 | 3 | Prisoners | 496 | 33,33 | 55,56 | 11,11 | 18 (6; 10; 2) | 3,63 |
| 1987-1989 | 3 | Patients | 866 | 31,4 | 46,28 | 22,31 | 121 (38; 56; 27) | 13,97 |
| 1987-1989 | 3 | Pregnant women | 588 | 22,22 | 77,78 | 0 | 9 (2; 7; 0) | 1,53 |
| 1987-1989 | 3 | Blood donors | 687 | 60 | 20 | 20 | 5 (3; 1; 1) | 0,73 |
| 1987-1989 | 3 | Travellers | 372 | 47,37 | 42,11 | 10,53 | 19 (9; 8; 2) | 5,11 |
| 1987-1989 | 3 | Women | 1578 | 25,81 | 48,92 | 25,27 | 186 (48; 91; 47) | 11,79 |
| 1987-1989 | 3 | Men | 1903 | 40,37 | 37,61 | 22,02 | 109 (44; 41; 24) | 5,73 |
| 1987-1989 | 3 | Housewives | 780 | 18,75 | 64,58 | 16,67 | 48 (9; 31; 8) | 6,15 |
| 1987-1989 | 3 | People <50 years old | 3179 | 31,05 | 44,77 | 24,19 | 277 (86; 124; 67) | 8,71 |
| 1987-1989 | 3 | People >50 years old | 264 | 41,67 | 41,67 | 16,67 | 12 (5; 5; 2) | 4,55 |
| 1988-1992 | 4 | Patients | 2378 | 55,91 | 18,11 | 25,98 | 127 (71; 23; 33) | 5,34 |
| 1988-1992 | 4 | Patients | 127 | 55,91 | 18,11 | 25,98 | 127 (71; 23; 33) | N/A |
| 1990-1999 | 5 | Patients | 789 | 77,26 | 7,36 | 15,38 | 598 (462; 44; 92) | 75,79 |
| 1995 | 6 | Prostitutes | 176 | 77,78 | 8,64 | 13,58 | 81 (63; 7; 11) | 46,02 |
| 2003 | 7 | Patients | 71 | 87,32 | 8,45 | 4,23 | 71 (62; 6; 3) | N/A |
| 2004-2005** | 8 | Patients | 81 | 98,77 | 1,23 | 0 | 81 (80; 1; 0) | N/A |
| 2009-2010** | 9 | Pregnant women | 1000 | 95,12 | 4,88 | 0 | 41 (39; 2; 0) | 4,1 |
| 2009-2010** | 9 | Patient women>5 0 years old | 231 | 64,29 | 35,71 | 0 | 14 (9; 5; 0) | 6,06 |
| Table 3: Proportion of HIV-1, HIV-2 and HIV-1/2 infections in health care patients according to the study period | ||||
| Date | Period | HIV-1 (%) | HIV-2 (%) | HIV-1/2 (%) |
| 1987-1988 | 2 | 40,74 | 24,07 | 35,19 |
| 1987-1988 | 2 | 32,50 | 27,50 | 40,00 |
| 1987-1988 | 2 | 64,29 | 14,29 | 21,43 |
| 1987-1989 | 3 | 31,40 | 46,28 | 22,31 |
| 1988-1992 | 4 | 55,91 | 18,11 | 25,98 |
| 1990-1999 | 5 | 77,26 | 7,36 | 15,38 |
| 2003 | 7 | 87,32 | 8,45 | 4,23 |