Business intelligence is a set of tools and techniques which are used to analyze and convert raw data into actionable and coherent insights. This study reveals how BI affects the business performance of banking sector and how banking sector utilized BI in their day-to-day operations. The deductive approach was used as research method and the stratified sampling method was used to determine the sample of this study. Data has been collected by covering twenty-eight state and non-state banks in Sri Lanka. The multiple regression and correlation were used as main analytical techniques to obtain the results. Based on the finding of this study, it has been concluded that there is positive relationship between business intelligence factors ((perception, product, process, team and technology)) and the Business performance and there is significant impact of Business intelligence on the business performance of banking sector in Sri Lanka.
## I. INTRODUCTION
Today, banks must undergo various challenges like increased customer expectations, competition, customer retention, compliance pressure, and acquisitions [1] If the banks make timely and efficient decisions, they can overcome these challenges. In the modern era, almost every bank makes decisions based on their collected databases. So, they must manage a huge set of databases which were collected through customer transactions, financial activities and from external markets. Additionally, it is very difficult for a human being to obtain useful insights by analyzing this data. This proves that information technology plays an enormous role in the decision-making process in banks.
Business intelligence (BI) is offering banks the necessary adaptability in both commercial and turbulent times. Globally, banks have a deeper understanding of their business, customers, and future through BI and software processes. It can also open the door for efficiency by lighting areas that are ready for cost reduction, new business prospects and more [2]. Banking implementation of business intelligence allows users to have access to multiple and distinct device sets to view responsive data visualization dashboards which usually cannot communicate across platforms [3].
Almost every bank in Sri Lanka uses BI in their operations. But the impact of business intelligence on these institutions' business performance does seem to be unknown. Many studies were conducted to measure the efficiency and productivity of the Sri Lankan banking sector. However, no study was carried out to measure the impact of business intelligence on the banking performance in Sri Lanka. The aim of this research is to scrutinize the impact of business intelligence in the business performance of the banking sector in Sri Lanka, and to study the influence of customer's perspective on the business performance of the banking sector in Sri Lanka.
### a) Research Objectives
The following are the research objectives that were addressed in this study.
#### General Objective:
- To determine the impact of the Business Intelligence on Business Performance of the banking sector in Sri Lanka.
#### Sub Objectives:
- To determine the relationships between BI Product, BI Technology, BI Process and BI Team, and BI perception and overall Business Performance.
- To identify the impact of BI Product, BI Technology, BI Process, BI Team and BI Perception on BP.
- To compare the impact of BI among state and non-state bank in Sri Lanka.
## II. LITERATURE REVIEW AND CONCEPTUAL FRAMEWORK
### a) Theoretical Review
Business Intelligence tools and techniques are using by the banks in order to ensure the completeness and accuracy of the operational and corporate business decisions [4]. However, it is difficult to give a definition for Business Intelligence since it subject to change with respective to the changes in the technological environment. The main issue with definitions is that they are more likely to change over time. The main reason for that are the factors which are used to create these definitions change with the time. With that [5] has define BI as a collection of processes which consist of architectures and technologies to convert raw data into meaningful information. According to [6] BI can be express as an umbrella term which defines as the gathering of applications, tools, methods, best approaches and processes to collect and analyse data of the organization which will be useful in the decision-making process.
When it comes to BI tools, they can be defined as the licensed software which give support to build different types of dashboards, reports and predictions by accessing multiple organizational data. Organizations use different types of analytical tools to analyse their organizational data. In 2021, research was conducted to identify the different types of business intelligence tools and techniques which are used in the analysis of information. Microsoft dynamics, Factorial HR, IBM Cognos Analytics, SAP business intelligence, Oracle business intelligence, Tableau, Sisense and clear analytics are the business intelligence tools used by organizations to meet different types of business needs. Many large companies use BI tools like SAP, Microsoft and Oracle to analyze and visualize their data [7].
# b) The
In order to stay competitive in today's complex business world, organizations need new tools and techniques to improve their income, and also to meet the expectations of their customers [8]. It is essential to use the BI tools to measure and interpret the business performance of the banks with the proper data mining. In addition to competitiveness, organizations face many issues when operating in this business world. Hence firms apply many tools and techniques to overcome these problems. Among them, Business Intelligence (BI) is one of the best solutions for many firms to overcome this problem and the benefits of applying BI are highly attracting the firms all over the world [9]. Hence it is important to investigate the relationship between the BI and the business performance of an organization. There are many research studies in the literature which seek this relationship in many contexts specially relating to the banking industry.
As examples, a case study of Saman Bank of Iran revealed that by using BI solutions it is easy to overcome the different problems of the banking industry such as severe competition, providing demanded services and customer willingness [10]. [11] in China did a review paper and found that when applying BI in the banking industry it many problems such as, the way of improving customer service, the way of controlling financial risks, the way of improving the operating performance of the banks and how to ensure the improvements of profits. Nevertheless, it is important put equal weightage for other functional activities such as marketing, customer care, communication etc. in implementing the BI tools like customer service management. A review study by [12] from Croatia has emphasized that in order to survive in this critical banking environment, BI tools such as on-line analytical processing and data mining do a major role in making possible intelligent business decisions [13].
Also, [14] using 23 retail banks of UK, carried an empirical study and the findings provided a considerable view of current status of competitive intelligence in the retail banks, and it showed BI should be considered effective and efficient operators in the competitive intelligence practice. The most important part is real time analysing the customers' data using the BI tools especially in the retail banking due to larger volume of transactions from the retail banking concept per day. [15] from Iran published a review paper and found that, using BI solution it is easy to solve the challenges of banking industry like severe competition between different banks, their provided demanded services, and the satisfaction of the customers.
In an another empirical study done by [16] in the Nigerian context, revealed that if a bank wants to increase its efficiency and continue competitiveness, that bank need to introduce smart and practical branded services especially self-services as well as should introduce an e-banking system that add entertainment or extra easiness to customers such as usage of digital wallet, real-time interaction, ATMs integrated with smart phones, website customization, biometric services, and digital currency. That means current cloud based BI tools can be integrated with other operational activities of the banks and consider the combined data analysis outcomes to take the business decisions of the bank.
[17]emphasized that many review papers from various countries revealed that Business Intelligence (BI) plays a major role in decision-making at every level within each department. BI assists banks in gaining a competitive advantage with their different products. It is proven that developing integrated BI systems within banks aids in making business decisions based on the overall performance of the bank. However, there are few studies on Business Intelligence Adoption (BIA) in banks; almost all studies highlight that BIA increases process efficiency and assists in achieving operational efficiency and customer satisfaction as a whole. Those articles have found that BI assists in decision-making, improves data quality, operational efficiency, competitive advantage, and customer satisfaction[15].
Another research emphasized that it is necessary to develop BI system that the management can investigate the future behaviour, customer behaviour as well as the quality and to increase the decision-making ability from the system [18]. BI supports firms to enhance the sales and profits, to identify buying patterns of the customers as well as improve their decision making and finally the business performance [17]. It is proven and recommended not to reply on the BI tools in the decisions making process of the banks and also should consider the experience of the human capital as well. [5] identified three main components to BI of an organization. They are, relationship intelligence which recognizes the way knowledge workers influence the organizational performance, competence intelligence which recognizes the way abilities of knowledge workers influence organizational performance, while structure intelligence recognizes the way organization's infrastructure environment influence organizational performance. Then it is clear that, BI influence business performance of an organization in many aspects.
One of studies revealed that if a firm use BI to collect, organize, and analyse the data which collect enormous amounts from numerous sources, it has the greater ability to add greater value to that firm [8]. Another research emphasized that in order to get the maximum benefit from the generated information, it is essential to have BI systems, the reason is that BI systems have the ability to anticipate future behaviour and their business indicators [19]. In overall perspective, BI tools of the banks help to take the most appropriate business decisions considering both present and historical data. Not only that BI helps to enhance business performance by uncovering latest business ideas, and surviving in this severe competition, getting maximum service from the suppliers, giving maximum service to the customers, solving financial issues, strategic issues, and developing better products and services [20]. This implies that BI perform a significant role in enhancing business performance of organizations, especially in banking sector.
In overall perspective, BI tools help to increase the efficiency of the business decisions making process of the banks and it will help to increase the financial and non-financial performance of the banks as well. According to [21] most of the Europe banks are implementing their operational and strategic plans using results and highlights of BI tools. However, in Sri Lanka context, there is no proper BI implementation has been executed by any bank. Further some banks in Sri Lanka have implemented the BI tools particularly with respect to the implementation of ERP systems. However, it is important to determine the operational plans and policies of the bank to compatible with the requirements of BI tools implementation process. The more information banks have on the client base, the easier it will be to attract new customers and service them better. Further, studying on client customer experiences, banks may discover weak places and collaborate with marketing, revenue, and IT to enhance their performance.
### c) Conceptual Framework
The conceptual framework has been developed in relational to the developed hypothesis based on the findings in past literature reviews. Figure 1 illustrates the relationship between research variables. Business Intelligence was used as an independent variable and
Business Performance was used as the dependent variable.
Following hypotheses were developed to fulfill the research objective.
#### Hypothesis 1
H10: There is no significant impact of BI perception on the business performance of banking sector.
H1a: There is a significant impact of BI perception on the business performance of banking sector.
#### Hypothesis 2
$H2_{0}$: There is no significant impact of BI process on the business performance of banking sector.
$H2_{a}$: There is a significant impact of BI process on the business performance of banking sector.
#### Hypothesis 3
$H3_{0}$: There is no significant impact of BI product on the business performance of banking sector.
$H3_{a}$: There is a significant impact of BI product on the business performance of banking sector.
#### Hypothesis 4
$H4_{0}$: There is no significant impact of BI team on the business performance of banking sector.
$H4_{a}$: There is a significant impact of BI team on the business performance of banking sector.
#### Hypothesis 5
$H5_{0}$: There is no significant impact of BI technology on the business performance of banking sector.
$H5_{a}$: There is a significant impact of BI technology on the business performance of banking sector.
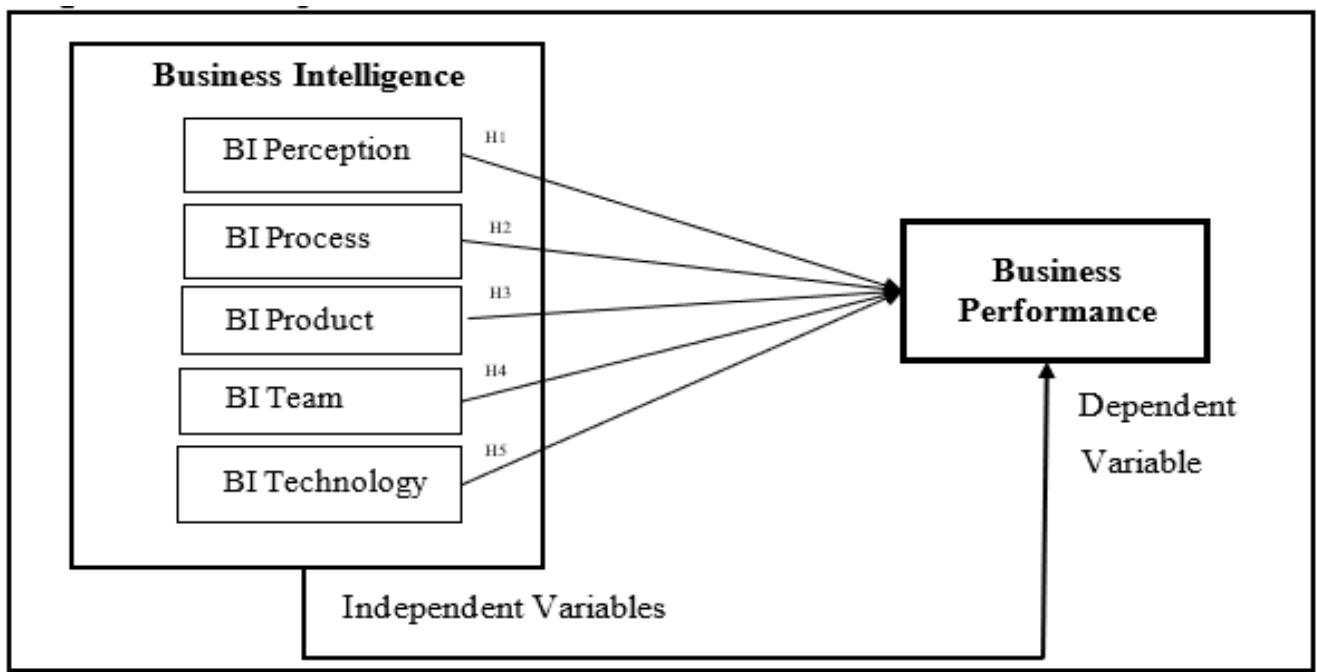 Figure 1: Conceptual Framework
## III. METHODOLOGY
This section consists of the research approach, population and sampling design, data collection methods, and methods of data analysis.
The deductive approach was used in this research study to develop the research model and strategy. In this study, the hypothesis was developed based on the past literature review and the developed hypothesis were tested by analyzing the collected data from the questionnaire and secondary sources.
The population considered for this study is the 30 licensed deposit taking banks operating in Sri Lanka and the sample size of this research study is 28 banks.
Quantitative methods are used to collect the data that are needed to accomplish the research objectives. A questionnaire was developed and given out to collect data and achieve the sub-objectives. After all the data has been collected, it was analyzed with SPSS, and hypotheses can be checked with statistical significance of variance, correlation, and regression. Quantitative analysis will be performed for this report, which includes descriptive statistics, correlation analysis, regression analysis and validity checking.
a) Variables
- Independent Variables
Business Intelligence was used as an independent and BI product, BI process, BI technology, and BI team are used as the fundamentals of BI. Business intelligence product is also called the business intelligence tool which is a type of software & tools used in the business intelligence process to collect, organize, analyse, and transform data into useful business insight. Business intelligence process is collecting data, creating models, analyzing data, creating visualizations, and making reports for decision-makers in an organization [13]. Business intelligence technology is data standards, and which could integrate the organization into its worth [4]. Business intelligence team is a combination of project and program roles that are engaged with the organization's BI activities. Business intelligence team includes management and technical skills in deployment and utilization of BI.
Dependent Variable
Business Performance was used as a dependent variable. Performance of banks can be defined as the evidence of the way banking industries use their resources which enables them to achieve their long-term goals. Banks' performance can be evaluated in two ways. They are financial performance and non-financial performances [21].
## IV. FINDINGS AND DISCUSSION
### a) Descriptive Statistics
The table 1 showed the descriptive statistics of the sample which consists of mean, median, mode and St. Deviation based on each variable. There are 200 responses and no missing value in the sample.
Table 1: Descriptive Statics of Variables
<table><tr><td></td><td></td><td>BI Perception</td><td>BI Process</td><td>BI Product</td><td>Business Performance</td><td>BI Team</td><td>BI Technology</td></tr><tr><td rowspan="2">N</td><td>Valid</td><td>200</td><td>200</td><td>200</td><td>200</td><td>200</td><td>200</td></tr><tr><td>Missing</td><td>0</td><td>0</td><td>0</td><td>0</td><td>0</td><td>0</td></tr><tr><td>Mean</td><td></td><td>2.18</td><td>2.35</td><td>2.59</td><td>2.68</td><td>2.35</td><td>3.09</td></tr><tr><td>Median</td><td></td><td>2.20</td><td>2.40</td><td>2.70</td><td>2.80</td><td>2.40</td><td>3.00</td></tr><tr><td>Mode</td><td></td><td>2.40</td><td>2.60</td><td>1.80</td><td>3.00</td><td>2.80</td><td>3.00</td></tr><tr><td>Std. Deviation</td><td></td><td>0.384</td><td>0.356</td><td>0.629</td><td>0.460</td><td>0.476</td><td>0.144</td></tr></table>
b) Relationship between BI Product, BI Technology, BI Process, BI Team, BI Perception, and overall Business Performance
Based on the results obtained for correlation analysis as depicted in the table there is a moderate positive relationship with the correlation of 0.689 between BI product and Business Performance at 0.01 level of significance and there is a moderate positive relationship with the correlation of 0.604 between BI Process and Business Performance at 0.01 level of significance. BI perception has a positive weak relationship with the correlation of 0.315 for Business Performance which is statistically significant at 0.01 level.
Moreover, it can be concluded that there is a moderate positive relationship with the correlation of 0.55 between BI Team and Business Performance at 0.01 level of significance and there is a very weak positive relationship with the correlation of 0.129 between BI Technology and Business Performance at 0.01 level of significance.
When coming to the second part of this analysis by considering the table 2, it shows that there is a moderate positive correlation between BI perception and BI process with the correlation of 0.675 and that value is significant at 0.01 level of significance. Then the correlation between BI perception and BI product is again significant at 0.01 level of significant with a value of 0.648 implying moderate correlation. BI Perception and BI Team have moderate correlation between them with a coefficient value of 0.642 and it is significant at 0.01 significance level. However, BI technology and BI perception have very weak negative correlation and that is not significant as well. Other than that BI process and BI Product has strong significant positive correlation at 0.01 level of significance. Further, BI process and BI team again show a strong correlation with a value of 0.722 and it is significant at 0.01 significance level.
However, correlation between BI process and BI technology is not significant at 0.01 level of significance. Then considering the correlation between BI product and BI team, it indicates a strong positive correlation between them with a coefficient of 0.708 and it is significant at 0.01 level of significance. However, the correlation between BI product and BI technology and BI team and BI technology are not significant at 0.01 level as shown in the above table.
Table 2: Correlations of Variables
<table><tr><td></td><td>BI Perception</td><td>BI Process</td><td>BI Product</td><td>BI Team</td><td>BI Technology</td><td>Business Performance</td></tr><tr><td>BI Perception</td><td>1.000</td><td>0.675</td><td>0.648</td><td>0.642</td><td>-0.064</td><td>0.315</td></tr><tr><td>Sig. (2 tailed)</td><td>-</td><td>0.000</td><td>0.000</td><td>0.000</td><td>0.364</td><td>0.000</td></tr><tr><td>BI Process</td><td>-</td><td>1.000</td><td>0.774</td><td>0.722</td><td>-0.045</td><td>0.604</td></tr><tr><td>Sig. (2 tailed)</td><td>-</td><td>-</td><td>0.000</td><td>0.000</td><td>0.526</td><td>0.000</td></tr><tr><td>BI Product</td><td>-</td><td>-</td><td>1.000</td><td>0.708</td><td>-0.046</td><td>0.689</td></tr><tr><td>Sig. (2 tailed)</td><td>-</td><td>-</td><td>-</td><td>0.000</td><td>0.519</td><td>0.000</td></tr><tr><td>BI Team</td><td>-</td><td>-</td><td>-</td><td>1.000</td><td>-0.288</td><td>0.550</td></tr><tr><td>Sig. (2 tailed)</td><td>-</td><td>-</td><td>-</td><td>-</td><td>0.000</td><td>0.000</td></tr><tr><td>BI Technology</td><td>-</td><td>-</td><td>-</td><td>-</td><td>1.000</td><td>0.129</td></tr><tr><td>Sig. (2 tailed)</td><td>-</td><td>-</td><td>-</td><td>-</td><td>-</td><td>0.068</td></tr><tr><td>Business Performance</td><td>-</td><td>-</td><td>-</td><td>-</td><td>-</td><td>1.000</td></tr></table>
c) Impact of BI Product, BI Technology, Process, BI Team, and BI perception on BP
The second sub objective of the research study is to determine the impact of BI on the BP of the banking sector in Sri Lanka. Equation 1 which is a multiple linear regression model that was used to identify the impact between the BI variable and BP of the banking sector in Sri Lanka.
Where, $Y =$ business performance is dependent variable, $a =$ Intercept, $B_{(1,\dots,n)} =$ coefficient of independent variable and $X_1 =$ BI perception, $X_2 =$ BI process, $X_{3} = \text{BI}$ product, $X_{4} = \text{BI}$ team and $X_{5} = \text{BI}$ technology is the independent variable of the model which are the factors of Business intelligence.
Equation 1: Regression equation
$$
Y = a + \beta_ {1} X _ {1} + \beta_ {2} X _ {2} + \beta_ {3} X _ {3} + \beta_ {4} X _ {4} + \beta_ {5} X _ {5}
$$
Table 2: Results of Multiple Regression - Overall Banking Sector
<table><tr><td rowspan="2">Model</td><td colspan="2">Unstandardized Coefficients</td><td>Standardized Coefficients</td><td rowspan="2">t</td><td rowspan="2">Sig.</td><td></td><td></td></tr><tr><td>B</td><td>Std. Error</td><td>Beta</td><td></td><td></td></tr><tr><td>(Constant)</td><td>-.999</td><td>.524</td><td></td><td>-1.906</td><td>.048</td><td>R</td><td>=0.771</td></tr><tr><td>BI Perception</td><td>-.447</td><td>.079</td><td>-.373</td><td>-5.635</td><td>.000</td><td>R-square</td><td>=0.595</td></tr><tr><td>BI Process</td><td>.270</td><td>.106</td><td>.209</td><td>2.549</td><td>.012</td><td>Adj.R-square</td><td>=0.584</td></tr><tr><td>BI Product</td><td>.413</td><td>.058</td><td>.564</td><td>7.165</td><td>.000</td><td>F-value</td><td>=56.925</td></tr><tr><td>BI Team</td><td>.296</td><td>.076</td><td>.306</td><td>3.900</td><td>.000</td><td>Sig.F</td><td>=0.000</td></tr><tr><td>BI Technology</td><td>.730</td><td>.159</td><td>.229</td><td>4.599</td><td>.000</td><td></td><td></td></tr></table>
According to table 2, the $R^2$ and adjusted $R^2$ of the estimated model was found to be 0.595 and 0.584 which indicated that almost $59.5\%$ of the variance in BP is explained by the independent variables of BI product, BI technology, process, BI team, and BI perception. It is important note that $R^2$ and adjusted $R^2$ values in this model are very much closer. Since it concludes that the fitness of this model is at very high level. The significance value of the model, it is 0.000 and where $P < 0.05$, it could be concluded that there is significant relationship between independent variables of BI product, BI technology, BI process, BI team, BI perception, and dependent variable of BP.
The $R^2$ and adjusted $R^2$ of the estimated model was found to be 0.595 and 0.584 which indicated that almost $59.5\%$ of the variance in BP is explained by the independent variables of BI product, BI technology, process, BI team, and BI perception. It is important note that $R^2$ and adjusted $R^2$ values in this model are very much closer. Since it concludes that the fitness of this model is at very high level. The significance value of the model, it is 0.000 and where $P < 0.05$, it could be concluded that there is significant relationship between independent variables of BI product, BI technology, BI process, BI team, BI perception, and dependent variable of BP.
Equation 2: Regression equation
$$
Y = - 0. 9 9 9 - 0. 4 4 7 X _ {1} + 0. 2 7 0 X _ {2} + 0. 4 1 3 X _ {3} + 0. 2 9 6 X _ {4} + 0. 7 3 0 X _ {5}
$$
Table 2 demonstrates the coefficients of variables of BI Product, BI Technology, Process, BI Team and BI perception. Thus, the 2 equation was estimated.
Where, Y = Business Performance, X1 = BI Perception, X2 = BI Process, X3 = BI Product, X4 = BI Team and X5 = BI Technology Considering the coefficient values of BI process, BI product,
BI team, and BI technology, they have positive values. It can be concluded that increasement of BI process, BI product, BI team, and BI technology will lead to an increasement of BP. While BI perception has a negative coefficient value. It indicates that increasement of BI perception will lead to a fall in BP.
Table 3: Hypothesis Testing Results
<table><tr><td>Hypothesis Statement</td><td>Sig. Value</td><td>Result</td></tr><tr><td>H10: There is no significant impact of BI perception on the business performance of banking sector</td><td rowspan="2">0.000</td><td>Rejected</td></tr><tr><td>H1a: There is a significant impact of BI perception on the business performance of banking sector</td><td>Accepted</td></tr><tr><td>H20: There is no significant impact of BI process on the business performance of banking sector</td><td rowspan="2">0.012</td><td>Rejected</td></tr><tr><td>H2a: There is a significant impact of BI process on the business performance of banking sector</td><td>Accepted</td></tr><tr><td>H30: There is no significant impact of BI product on the business performance of banking sector</td><td rowspan="2">0.000</td><td>Rejected</td></tr><tr><td>H3a: There is a significant impact of BI product on the business performance of banking sector</td><td>Accepted</td></tr><tr><td>H40: There is no significant impact of BI team on the business performance of banking sector</td><td rowspan="2">0.000</td><td>Rejected</td></tr><tr><td>H4a: There is a significant impact of BI team on the business performance of banking sector</td><td>Accepted</td></tr><tr><td>H50: There is no significant impact of BI technology on the business performance of banking sector</td><td rowspan="2">0.000</td><td>Rejected</td></tr><tr><td>H5a: There is a significant impact of BI technology on the business performance of banking sector</td><td>Accepted</td></tr></table>
As discussed in the literature review, there are 10 hypotheses that have been established with the intention of testing them through the data analysis of this study. Table 4.8 explained the results of that hypothesis testing with the conclusion of whether pre-established hypotheses are accepted or not according to multiple linear regression analyses. Based on the rule of, if the significance value(p-value) of the independent variable is less than 0.05, then reject the null hypothesis and accept the alternative hypothesis or the significance value(p-value) of the independent variable is more than 0.05, then accept the null hypothesis and reject the alternative hypothesis.
### d) Impact of BI on of State Bank
- BI perception does have a significance impact on the business performance of banking sector in SL.
- BI process does have a significance impact on the business performance of banking sector in SL.
- BI product does have a significance impact on the business performance of banking sector in SL.
- BI team does have a significance impact on the business performance of banking sector in SL.
- BI technology does have a significance impact on the business performance of banking sector in SL.
Table 4: Results of Multiple Regression – State Bank
<table><tr><td rowspan="2">Model</td><td colspan="2">Unstandardized Coefficients</td><td>Standardized Coefficients</td><td rowspan="2">t</td><td rowspan="2">Sig.</td><td></td><td></td></tr><tr><td>B</td><td>Std. Error</td><td>Beta</td><td></td><td></td></tr><tr><td>(Constant)</td><td>-0.054</td><td>0.622</td><td></td><td>-0.087</td><td>0.931</td><td>R</td><td>=0.589</td></tr><tr><td>BI Perception</td><td>-0.413</td><td>0.152</td><td>-0.395</td><td>-2.725</td><td>0.008</td><td>R-square</td><td>=0.347</td></tr><tr><td>BI Process</td><td>-0.230</td><td>0.178</td><td>-0.166</td><td>-1.293</td><td>0.200</td><td>Adj.R-square</td><td>=0.303</td></tr><tr><td>BI Product</td><td>0.362</td><td>0.194</td><td>0.322</td><td>1.865</td><td>0.066</td><td>F-value</td><td>=7.868</td></tr><tr><td>BI Team</td><td>0.451</td><td>0.113</td><td>0.493</td><td>3.991</td><td>0.000</td><td>Sig.F</td><td>=0.000</td></tr><tr><td>BI Technology</td><td>0.647</td><td>0.229</td><td>0.359</td><td>2.826</td><td>0.006</td><td></td><td></td></tr></table>
According to table 4, the $R^2$ and adjusted $R^2$ of the estimated model was found to be 0.347 and 0.303 which indicated that the almost $34\%$ of the variance in BP is explained by the independent variable of BI product, BI technology, process, BI team, and BI perception. The significance value of the model, it is 0.000 and where $P < 0.1$.
Since the following conclusions can be derived based on the summary obtained from the results of the above table.
It could be concluded that there is significant relationship between independent variables of BI Product, BI Technology, Process, BI Team, BI perception, and dependent variable of BP.
Table 4 demonstrates the coefficients of BI Product, BI Technology, Process, BI team and BI perception of state bank. Thus, the equation 3 was estimated.
Where, Y = Business performance, $X_{1} =$ BI perception, $X_{2} =$ BI process, $X_{3} =$ BI product, $X_{4} =$ BI team and $X_{5} =$ BI technology
Considering the coefficient values of BI product, BI team, and BI technology, they have positive values. It can be concluded that increasement of BI process, BI product, BI team, and BI technology will lead to an
### e) Impact of BI on BP of Non-State Bank
increase of BP. In contrast, BI perception and BI process have negative coefficient values. It indicates that increasement of BI perception and BI process will lead to a fall in BP.
Considering the significance value of the variables, out of five independent variables, BI perception, BI product, BI team, and BI technology where $p < 0.1$, it can be concluded that these variables have a significant impact on business performance of state banks except BI process where $p > 0.1$.
Table 5: Results of Multiple Regression – Non-State Bank
<table><tr><td rowspan="2">Model</td><td colspan="2">Unstandardized Coefficients</td><td>Standardized Coefficients</td><td rowspan="2">t</td><td rowspan="2">Sig.</td><td></td><td></td></tr><tr><td>B</td><td>Std. Error</td><td>Beta</td><td></td><td></td></tr><tr><td>(Constant)</td><td>3.325</td><td>1.166</td><td></td><td>2.851</td><td>0.005</td><td>R</td><td>=0.657</td></tr><tr><td>BI Perception</td><td>-0.236</td><td>0.092</td><td>-0.208</td><td>-2.547</td><td>0.012</td><td>R-square</td><td>=0.431</td></tr><tr><td>BI Process</td><td>-0.426</td><td>0.186</td><td>-0.189</td><td>-2.297</td><td>0.023</td><td>Adj.R-square</td><td>=0.406</td></tr><tr><td>BI Product</td><td>-0.039</td><td>0.079</td><td>-0.039</td><td>-0.486</td><td>0.628</td><td>F-value</td><td>=17.270</td></tr><tr><td>BI Team</td><td>-0.394</td><td>0.122</td><td>-0.300</td><td>-3.237</td><td>0.002</td><td>Sig.F</td><td>=0.000</td></tr><tr><td>BI Technology</td><td>0.803</td><td>0.216</td><td>0.306</td><td>3.709</td><td>0.000</td><td></td><td></td></tr></table>
According to the above table 4, the R2 and adjusted R2 of the estimated model was found to be 0.431 and 0.406 which indicated that the almost $43\%$ of the variance in BP is explained by the independent variable of BI product, BI technology, process, BI team and BI perception.
The significance value of the model, it is 0.000 and where $P < 0.1$, it could be concluded that there is significant relationship between independent variables of BI product, BI technology, process, BI team, BI perception, and dependent variable of BP.
Considering the significance value of the variables, out of five independent variables, BI perception, BI process, BI team, and BI technology where $p < 0.1$, it can be concluded that these variables have a significant impact on business performance of non-state banks except BI products where $p > 0.1$.
Equation 4: Regression equation
$$
Y = - 0. 0 5 4 - 0. 2 3 6 X _ {1} - 0. 4 2 6 X _ {2} - 0. 0 3 9 X _ {3} - 0. 3 9 4 X _ {4} + 0. 8 0 3 X _ {5}
$$
The equation 4 was estimated as above. Where, $Y =$ Business performance, $X_1 =$ BI perception, $X_2 =$ BI process, $X_3 =$ BI product, $X_4 =$ BI team and $X_5 =$ BI technology.
## V. CONCLUSION
Research objectives were defined after considering the research concerns and gaps. As a result, empirical data was collected and analyzed. The general objective of this study is to determine the impact of business intelligence on the business performance of the banking sector in Sri Lanka. Other than that, there are another three specific objectives that have been set for the same. This study adds to the body of knowledge by introducing new evidence that is specific to the Sri Lankan setting.
After doing an extensive literature review, there are five independent variables that were identified under Business Intelligence, those can be named as BI product, BI technology, BI process, BI team, and BI perception. Then business performance has been considered as the dependent variable for this current study.
For the first sub objective, correlation analysis was conducted and all the correlations values among independent variables are positive except for the ones relating to BI technology.
Next, to check the second specific objective of this study, multiple regression analysis has been conducted; all the independent variables of BI perception, BI product, BI process, BI team, and BI technology have significant impact on Business Performance of the banking sector in Sri Lanka based on the results obtained from multiple linear regression analysis.
Considering the coefficient value of BI technology, it has a positive value. It can be concluded that increasement of BI technology will lead to have an increasement of BP. In contrast, BI perception, BI process, BI product, and BI team have negative coefficient values. It indicates that the increasement of those variables will leads to have a fall in BP.
Further to the above, to test the contribution from the study to the third objective of this study, multiple linear regression analysis was carried out. Based on the findings of the multiple linear regression analysis done for both non-state and state banks separately, different BI factors affect in a distinct manner to the Business Performance of both non-state and state banks. The BI perception, BI product, BI Team, and BI technology have significant impact on BP in state banks except BI process. In non-state banks, BI perception, BI process, BI Team, and BI technology have significant impact on BP except BI products.
Accordingly, as a summary to the findings of this study, BI factors of BI perception, BI product, BI process, BI team, and BI technology have significant impact on Business Performance in the banking sector in Sri Lanka. Other than that, in overall there is a similar impact of business intelligence on business performance of both state and non-state banks in the Sri Lanka banking industry.
Generating HTML Viewer...
References
13 Cites in Article
N Nithya,R Kiruthika (2021). Impact of Business Intelligence Adoption on Performance of Banks: A Conceptual Framework.
T Vaidya,S Ahirrao,K Kadam,K Lugade (2014). Business Intelligence System for banking and Finance.
Kundan (2015). Reimaging BI in bank with a smarter 'Platform Oriented' strategy.
O Isik,M Jones,A Sidorova (2012). Business intelligence success, the role of BI capabilities and decision environments.
Fatima,C Linnes (2019). The Current Status of Business Intelligence: A Systematic Literature Review.
P Marjamaki (2017). Evolution and Trends of Business Intelligence Systems: A Systematic Mapping Study.
G Velosa,Pabon (2021). Business Intelligence and Its Big Evolution.
Steve Williams,Nancy Williams (2007). Business-centric business intelligence development with the BI pathway method.
B Evelson,N Norman (2008). Business Intelligence, Forrester Research Cambridge.
M Maryam,M Seyyed (2012). Business Intelligence System in Banking Industry Case Study of Samam Bank of Iran.
H Zhou,Tao,W Tao (2008). Analysis of Business Intelligence and its derivative -Financial intelligence.
Kristian Dokic,Mirjana Radman Funarić,Katarina Potnik Galić (2015). The Relationship between the Cryptocurrency Value (Bitcoin) and Interest for It in the Region.
W Sheila,R Elsayed,S Craig (2009). Empirical Study of Competitive Intelligence Practice.
No ethics committee approval was required for this article type.
Data Availability
Not applicable for this article.
How to Cite This Article
Isuri Namalka Rajapaksha. 2026. \u201cImpact of Business Intelligence on the Business Performance of the Banking Sector in Sri Lanka\u201d. Global Journal of Management and Business Research - A: Administration & Management GJMBR-A Volume 22 (GJMBR Volume 22 Issue A5).
Explore published articles in an immersive Augmented Reality environment. Our platform converts research papers into interactive 3D books, allowing readers to view and interact with content using AR and VR compatible devices.
Your published article is automatically converted into a realistic 3D book. Flip through pages and read research papers in a more engaging and interactive format.
Our website is actively being updated, and changes may occur frequently. Please clear your browser cache if needed. For feedback or error reporting, please email [email protected]
Thank you for connecting with us. We will respond to you shortly.