This research is to investigate and analyze the reasons behind cost overruns in infrastructure projects compared to the planned costs. It also delves into establishing procedures for effectively monitoring and controlling project costs and measuring cost performance indicators throughout the project lifecycle. To achieve these goals, the research addresses three key questions that provide clarity on the research objectives. The research questions primarily focus on the estimation of risk costs for construction and infrastructure projects as an integral part of project knowledge areas. Additionally, the study analyzes the actual cost estimation methods employed by construction organizations and seeks to develop project cost management as an integrated part of all project knowledge areas, thereby enhancing the procedures for monitoring and controlling costs.
## I. INTRODUCTION
Project cost management is the backbone of project completion within the scope of the contract, which the project costs aim at estimating the financial resources required for the project, aggregating those cost estimates, and working on monitoring and controlling the budget of the project so that the project is completed within the specified budget to control the variables that would affect the cost at different stages of the project. Infrastructure and construction projects evolve rapidly regarding their diversity, size, and financial budget, and to keep up with that development need to adapt to contemporary changes, e.g. (dynamic project performance, flexibility to change, quality assurance, and human resource performance). The impact of this development is illustrated in project processes from initiation to close. Therefore it should be used dynamic project management tools to analyse the cost elements for these projects.
The importance of this research is to study and analyse the radical reasons for exceeding the actual cost of construction and infrastructure projects compared with the planned cost, and then find adequate procedures capable of controlling the costs of projects within the specified framework and without cost overrun, and measure the performance of these costs throughout the project lifecycle, and to reveal gaps and deviations from the planned cost. According to Vrijling & Redeker (1993), there are many projects where actual costs exceed planned costs, especially infrastructure projects.
Based on the foregoing, where the infrastructure projects are the core of all construction projects, so it is should be to shed light closely on the infrastructure projects that have been affected, either by suspensions or by failures as a result of cost overruns for these projects.
## II. STUDY BACKGROUND
Completing the project on time and within budget is a primary goal for all projects. The purpose of project cost management is to provide management team better and more effectively estimate, monitor, and control project costs.
The research has two main types of variables, as following:
1. The dependent variable, which is (Infrastructure Projects Failures).
2. The independent variable, which is (Cost Overrun).
The independent variables are related to three dimensions, which are and according to The Project Management Book of Knowledge (PMBOK).
- The First dimension: Project costs
- The Second dimension: Managing the project risk plan paragraphs.
- The Third dimension: Earned value management (EVM) paragraphs.
The dependent variables are related to Infrastructure Projects Fail.
## III. THE PRIMARY OBJECTIVES OF THE RESEARCH
The research aims to study the root causes for increasing the planned cost compare with the actual costs for construction and infrastructure projects. As well as recommendations for procedures that are recommended to be followed in order not to fall into cost overruns. The status quo of cost estimation methods for several infrastructure projects will be analyzed and develop the best practice manner by achieving integration and incorporating cost management tools in a way that contributes to achieving effective control on cost overruns and rational decision-making. Consequently, the primary objectives of the research will address that:
1. Analyzing the actual cost estimation methods in construction organization and developing project cost management as an integrated part of all project knowledge areas, e.g. (Schedule, Resource, Risk, Procurement) thus contributing to the achievement of effective control and monitoring over cost elements and making rational decisions.
2. Cost estimation of risk for construction and infrastructure project where is an embedded of project knowledge areas, which aims at estimating the total cost of construction projects and according to project scope, time, quality, which is usually close to the actual cost.
3. Monitoring and measuring projects performance with an effective tool and develop a proposed procedure to improve the process of monitoring the
performance of project costs and make some recommendations and proposals.
## IV. THE RESEARCH QUESTIONS
The research aims to study the causes for increasing the planned cost compare with the actual costs for construction and infrastructure projects. The research will discuss and answer three main questions, and that will be through subsidiaries questions will be exposed in detail by questionnaire, so the three main questions are:
A. What is the effect of cost estimating a rough order of magnitude (ROM) during the roll-out phase on final project budget cost?
B. What is the effect of estimated costs of risk on project budget cost and their relation to a cost overrun?
C. Is the Earned Value Management (EVM) method used to monitor and measure the performance of project costs and detect cost overruns early during all project processes?
## V. RESEARCH HYPOTHESIS (ASSUMPTION)
a) Development of Main-Hypothesis (HO)
- There is no Statistical relation between the Cost Overruns (Project costs, managing the project risk plan, Earned value management (EVM)) and Infrastructure Projects Failures).
b) Development of Sub-Hypothesis (H1)
H1: Study of project costs accurately during the roll-out phase will contribute positively to controlling cost overruns.
c) Development of Sub-Hypothesis (H2)
- H2: Managing the project risk plan, e.g., (identify, analysis, and control risks) of each project will contribute positively to controlling cost overruns.
d) Development of Sub-Hypothesis (H3)
- H3: Using Earned value management (EVM) method during the project lifecycle will provide strong indicators that contributed to monitor and control project cost overruns.
## VI. RESEARCH METHODOLOGY (RESEARCH DESIGN AND APPROACH)
Based on the nature of the study and the objectives it seeks to achieve, the researcher has used the descriptive statistical analytical approach, which depends on the study of the phenomenon as it exists in reality, is interested as an accurate description, and expresses it qualitatively and quantitatively. This approach is not satisfied with collecting information related to the phenomenon in order to investigate its various manifestations and relationships, but goes beyond it to analysis, linking and interpretation to reach conclusions on which the proposed perception was built and the field study method has been relied upon to achieve the study objectives. A quantitative approach is based on statistical and estimate processes. Therefore, it is concerned with the variables that include the measurement of the characteristics. A quantitative approach aims to test and validate hypotheses; this is performed by defining the hypotheses that already exist in the previous literature, where the relations between the variables are assumed, and the data are collected and analysed statistically, and based on the results obtained, the hypotheses are accepted or rejected. According to Kothari, C. R. (2004) who indicated that the quantitative approach seeks to obtain the causes and facts and the relationships between variables so that these variables can explain cause-and-effect relationships, and it becomes possible to arrive at accurate predictions about phenomena under study. The data will be presented by using statistical programs such as (SPSS, Excel Sheets, Smart-PLS).
## VII. THE LITERATURE REVIEW
Estimating project costs requires proper planning which contributes to estimating the cost of each activity in the project accurately, specifying the control thresholds for the variables that occur in the project cost management and the permitted flexibility limits associated with the variables e.g. (construction risk, cost reserve) that take place in the project during the different stages of the work. Based on that, the poor planning, and the inability to meet the needs of projects on time within the project budget cost will lead to cost overrun.
Accordingly, the researchers have studied the impact of independent and dependent factors and diversity variables on the project cost management; The research review a number of the literature of these researchers and studies among years (1996-2023) as shown in summary in table No. 1 as shown below:
Table No. (1): Summary of Literature Review
<table><tr><td>Year</td><td>Author's</td><td>Research Title</td><td>Approach</td><td>Research Dimension</td><td>Results</td><td>Critical Analysis the Studies</td></tr><tr><td>1996</td><td>Fleming & Koppelman</td><td>Forecasting the final cost and schedule results</td><td>Statistical Analysis</td><td>Cost Performance Measure</td><td>The result of the research was that two tools could be used to measure the project's performance time and cost critical path method (CPM), despite the limited use of the Earned Value.</td><td>Due to the ever-changing nature of the industry, these techniques may not accurately predict the final outcomes.</td></tr><tr><td>2002</td><td>Flyvbjerg et al.,</td><td>Cost Underestimation in Public Works Projects</td><td>Statistical Analysis</td><td>Technical, economic, psychological, and political</td><td>Decision making, tender, and the contract should be accurately studied during the planning process</td><td>Love et al., (2002) criticized Flyvbjerg's research, where they indicated that the cons of the research approach which did not include different management cultures, inflation, and market volatility factors were not considered, as well the pros were an Experimental study of the theory, which ensures confirmation of the hypotheses.</td></tr><tr><td>2004</td><td>Reilly & Brown</td><td>Management and Control of Cost and Risk for Tunnelling and Infrastructure Projects</td><td>Method for estimating project risks</td><td>Cost Estimate Validation Process</td><td>There is potential to realize cost savings and reduce risks</td><td>Although this approach noted the critical role of risks costs in infrastructure projects, this approach did not illustrate how to use risk analysis and assessment in other construction projects.</td></tr><tr><td>2007</td><td>L Bergkvist and B Johansson's</td><td>Evaluating Motivational Factors Involved at Different Stages in an IS Outsourcing Decision Process</td><td>Qualitative method</td><td>Decision Making, tendering, contract</td><td>Decision making is a key factor in ensuring that projects reach their goals and objectives</td><td>The research did not recommend a clear structure of decision-making powers, which is considered the only way to influence the success of the project in a positive way.</td></tr><tr><td>2007</td><td>Zwikael & Sadeh</td><td>Risk Management</td><td>Constructionist epistemology</td><td>Risk</td><td>Risk has direct impact can have a crucial effect on the productivity of work</td><td>Therefore, one of the research weaknesses is that did not address how to estimate risk costs.</td></tr><tr><td>2010</td><td>Love et al.,</td><td>Rework in Civil Infrastructure Projects</td><td>Questionnaire survey</td><td>Rework</td><td>§ Lack of defined working procedure. § Changes made at the request of the customer. § The inefficient use of information technology. § Lack of transparent contractor procedures to improve quality. § Effective Participation of stakeholders in the project</td><td>No recommendation about how to budget cost control should be considered in the early stages of project planning in order to ensure that the project is completed on time and within the allocated budget.</td></tr><tr><td>2010</td><td>Olawale & Sun</td><td>Cost and Time Control of Construction Projects</td><td>Quantitative and qualitative methods</td><td>Design, time, resources</td><td>Explore the relationship between project budget and schedule, as well as their impact upon results</td><td>The research did not indicate what type of skills are necessary to control project budget.</td></tr><tr><td>2010</td><td>Ahsan K and I Gunawan</td><td>Analysis of Cost and Schedule Performance of International Development Projects</td><td>Qualitative method</td><td>Cost, Schedule</td><td>Cost and Schedule should be managed effectively to achieve successful project results</td><td>The research did not elucidate what an effective method of cost management means.</td></tr><tr><td>2011</td><td>Doloi H.</td><td>Cost Overruns and Failure in Project Management</td><td>Qualitative</td><td>Project Document</td><td>Tender and contract processes are also critical</td><td>The research does not highlight the appropriate tools and procedures for studying and analyzing bids that ensure cost control</td></tr><tr><td>2011</td><td>Zwikael & M. Ahn,</td><td>Risk management process</td><td>Quantitative</td><td>Risk</td><td>Risk has direct impact and can have a crucial effect on the productivity of work</td><td>The research does not provide guidance into calculating and estimating the cost of risk, as well as the types of risk to be taken into consideration</td></tr><tr><td>2012</td><td>Chen and Zhang</td><td>Accuracy of cost and schedule forecasting in construction projects.</td><td>Quantitative</td><td>Schedule</td><td>§ Complexity of construction § Unpredictability of external factors</td><td>The research does not indicate that this is what means the risks of the project can be controlled if they are studied more deeply during the planning process.</td></tr><tr><td>2012</td><td>Doloi H.</td><td>Cost Overruns and Failure in Project Management</td><td>Survey and case study</td><td>Cost Baseline</td><td>Communication between the project management team and key stakeholders should be activated to reduce cost Overruns</td><td>The research lacks a vision of the effective structure for managing communication between stakeholders, as well elucidate communication channels and levels of powers and responsibilities.</td></tr><tr><td>2012</td><td>Lopez et al.</td><td>Design Error Costs in Construction Projects</td><td>Survey</td><td>Design</td><td>Significant relationship between the design error costs and the types of procurement methods</td><td>The research did not indicate any effective methods necessary to manage project planning within the specified budget</td></tr><tr><td>2014</td><td>Gul Polat et al.,</td><td>Factors Affecting Cost Overruns in Micro-scaled Construction Companies</td><td>Qualitative methods</td><td>Design important factors that may cause cost overruns in construction projects</td><td>Design problems and delays in design approvals.</td><td>The design cannot represent the essential element for cost overrun. The cost had to be taken into consideration as the design changed after another, which is the effective management and risks</td></tr><tr><td>2016</td><td>Swapnil P. Wanjari and Gaurav Dobariya</td><td>Identifying factors causing cost overrun of the construction projects in India</td><td>Survey</td><td>The impact of raw material prices on cost overruns</td><td>Raw material prices have a direct impact on cost overruns</td><td>The research doesn't refer to the inflation expected for raw materials as a negative risk, so it should be considered as an embedded essential knowledge area from the cost baseline</td></tr><tr><td>2017</td><td>Flyvbjerg</td><td>The Iron Law of Megaproject Management</td><td>Qualitative methods</td><td>External Factors</td><td>Cultural, inflationary, and volatile market factors</td><td>The research does not address the necessary procedures to control such factors.</td></tr><tr><td>2017</td><td>Nabil Al Hazem et al.,</td><td>Delay and cost overrun in infrastructure projects in Jordan</td><td>Quantitative</td><td>External Factors</td><td>Terrain conditions, weather conditions, variation orders, and unavailability of laborer's</td><td>But the research has limited the place in which the causes of cost overruns have been studied, and the research has not concluded what are the effective method to address cost overruns in similar projects, even if they are similar in nature of the location.</td></tr><tr><td>2018</td><td>Flyvbjerg et al.,</td><td>Planning Fallacy or Hiding Hand: Which is the Better Explanation</td><td>Quantitative</td><td>Risks</td><td>Unaccounted factors could lead to increased costs and delays</td><td>The research did not consider different management cultures, inflation, and market volatility factors, and thus overlooked potential cons. As well the research does not provide comprehensive insight into project performance and its analysis may be missing important factors. Therefore, research should include a wide range of factors to provide a more thorough understanding of the implications of major projects.</td></tr><tr><td>2020</td><td>Marey-Perez et al</td><td>Delays and cost Overrun Causes in Construction Projects of Oman</td><td>Quantitative</td><td>Change Scope, Decision Making</td><td>Change Scope, delay in decision Making</td><td>Project delays are a frequent occurrence in the world of project management; Therefore, the research did not address what are the root causes that delayed the project, and it is expected that costs will be exceeded due to them.</td></tr><tr><td>2023</td><td>Osama A. et al.,</td><td>Investigation of critical factors affecting cost overruns and delays in Egyptian mega construction projects</td><td>Survey</td><td>Suspension of works, Low experience of design firm, delay between procurement phase and design phase, variation order, force majeure, and lack of supervision</td><td>It was found that 24 refined main factors are responsible for cost overrun and delays</td><td>The dataset may not cover the entire spectrum of construction projects in Egypt, which could limit the generalizability of the findings.</td></tr></table>
### a) Cost Baseline and Cost Control
The process of aggregating the estimated costs of individual activities or work packages to establish an authorized cost baseline. Cost control is the process of monitoring the status of project expenses, updating project budgets, and managing budget-based changes. Budget updates include a monthly record of actual costs incurred to date and tracking of approved but not yet realized costs (accrued and deferred). Adjustments to the baseline budget to address overspending should only be made through an integrated change control process. Inputs to cost management include project management plans, project funding requirements, performance information, and organizational process resources.
## VIII. IMPORTANCE OF WATER AND WASTEWATER PROJECTS
In the 20th century, water and wastewater infrastructure projects became more standardized and regulated. Governments and international organizations started taking a more active role in providing clean water and improved sanitation to their citizens. As shown in Fig. 1.1 the impact of lack of water and wastewater on citizens.
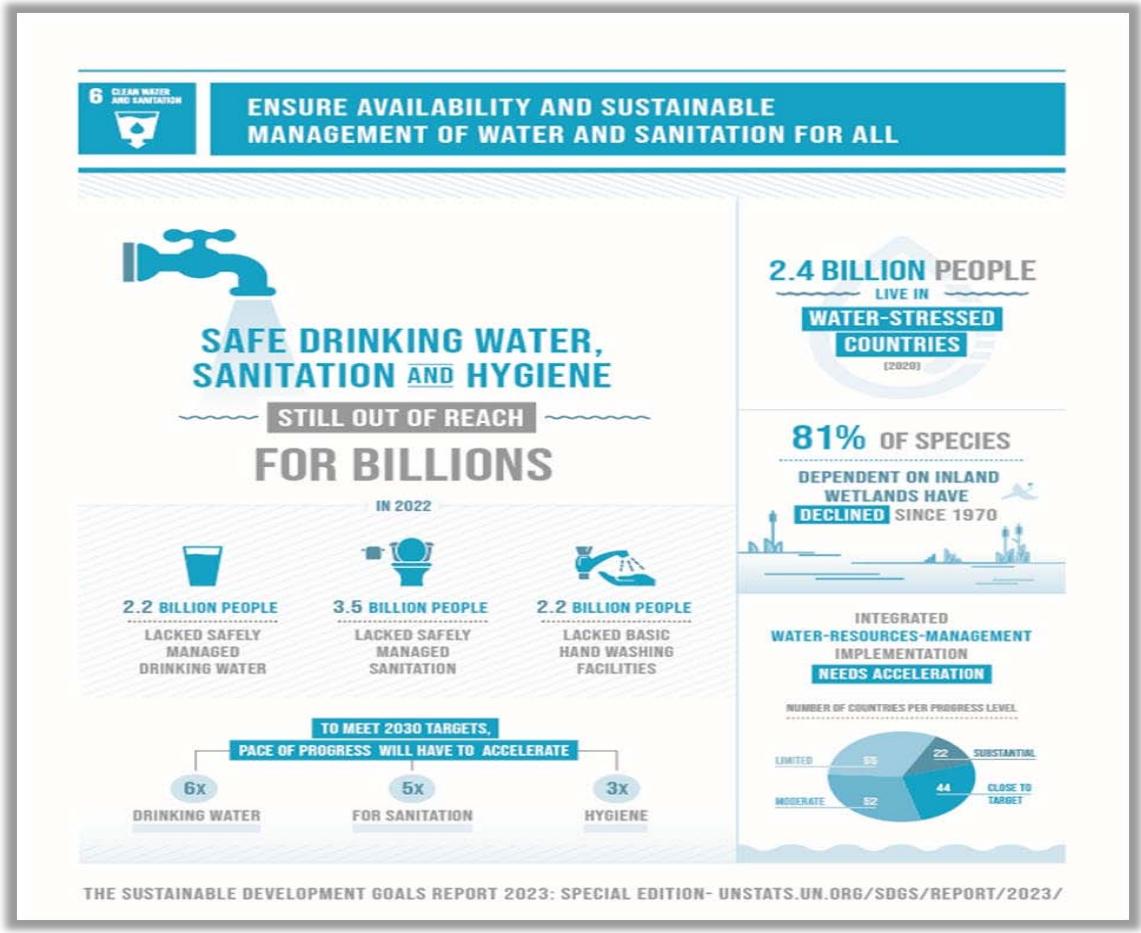
Figure 1.1: Impact of Lack of Water and Wastewater Projects
United Nation-Report 2023 In today's world, water and wastewater projects play a crucial role in sustaining thriving communities and ensuring the well-being of its residents. However, these projects often face significant challenges, with cost overruns being a recurring issue that hinders their success. This research aims to delve into the complexities of faulted water and wastewater projects, specifically focusing on the detrimental effects of cost overruns. Through a comprehensive analysis, it becomes evident that faulty planning and execution are the primary factors contributing to these financial setbacks. With a determined purpose to convince, this research seeks to shed light on the root causes of cost overruns in infrastructure projects, emphasizing the utmost importance of effective project management in mitigating such issues. By exploring these critical aspects, we can pave the way for the successful completion of future endeavors in the water and wastewater industry.
## IX. PERFORMANCE ANALYSIS FOR WATER AND WASTEWATER PROJECTS
To ensure the successful implementation of these ambitious goals, it was imperative to thoroughly analysis the performance indicators of these projects and develop urgent and radical solutions. The performance indicators of water and wastewater projects serve as valuable tools for evaluating the effectiveness and efficiency of these initiatives. By closely monitoring and analyzing these indicators, it becomes possible to identify areas of improvement, address challenges, and optimize resource allocation. Such a comprehensive assessment enables the development and implementation of innovative solutions that can contribute to the realization of the United Nations' coverage targets. The analysis of these projects encompasses various aspects, including infrastructure development, technological advancements, environmental impact, and financial considerations. Therefore, it was necessary to analyze the performance indicators of several projects and come up with urgent and radical solutions to implement those goals, The
indicators of these projects can also be measured through the criteria shown in Table 2.1 below.
Table 2.1: National Water Company Projects Performance Criteria
<table><tr><td>Project Criteria</td><td>Performance</td></tr><tr><td>Regular</td><td>0 > (EV-PV) ≥-10%</td></tr><tr><td>Delayed</td><td>-10%> (EV-PV) ≥-25%</td></tr><tr><td>Faulted</td><td>(EV-PV) < -25%</td></tr><tr><td>Ahead of Schedule</td><td>EV > PV</td></tr></table>
Referring to Figure 1.2, which illustrates the total of project from 2018 to 2023. This dynamic chart not only reveals the total number of projects each year but also highlights the intriguing percentages of troubled projects, those currently under implementation, and those successfully handed over.
Delving into the data, we find that 2018 stands out as a remarkable year, boasting a staggering 1,010 projects with budget 38.8 billion SAR. Fast forward to 2021, a year that faced significant challenges, as it recorded the highest percentage of troubled projects at a concerning $27.2\%$. However, by 2023, and by innovative recovery strategies and proactive measures, the rate of troubled projects dramatically dropped to just $4.9\%$, marking it as the best year yet.
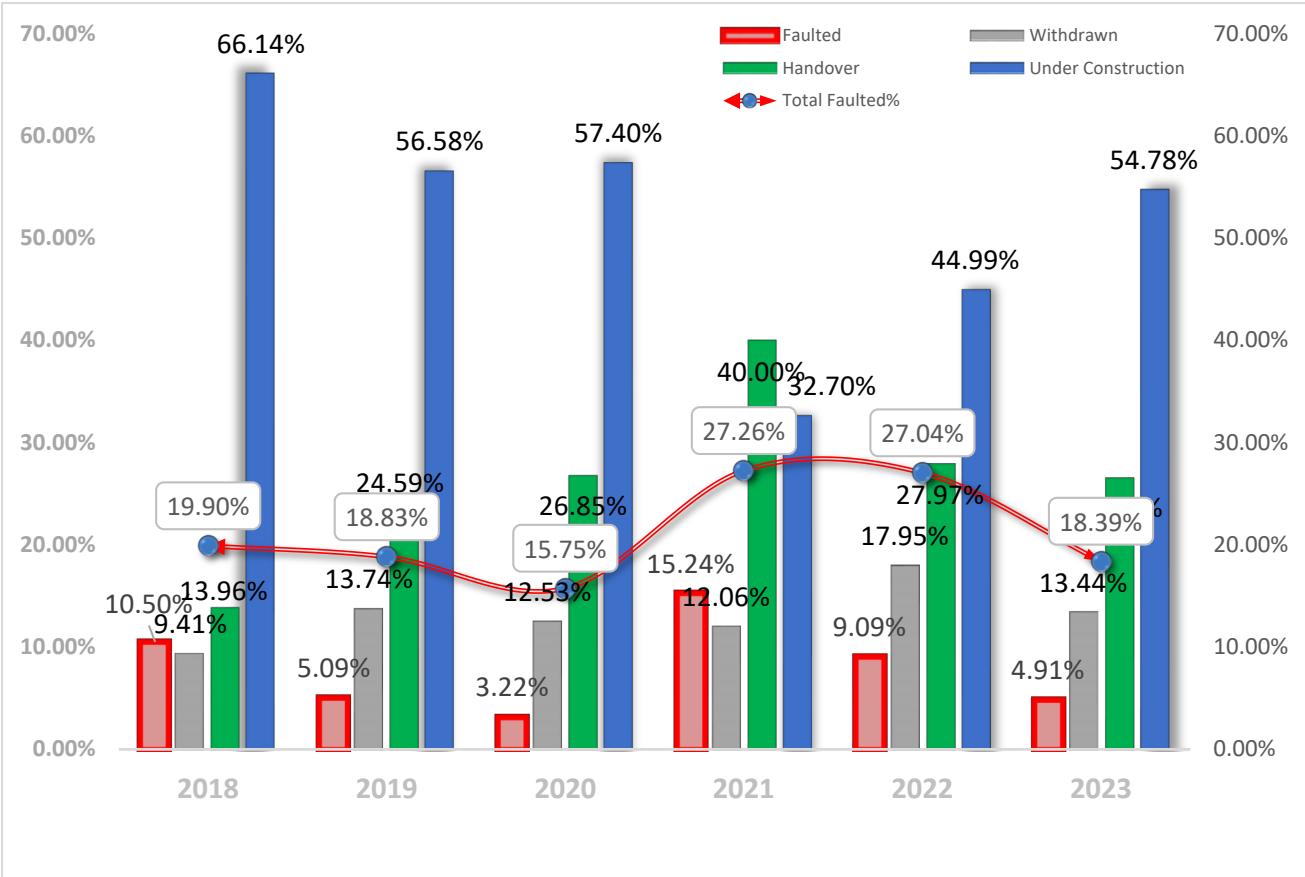
Figure 1.2: Projects portfolio status - Year (2018-2023)
Table (2.2): Projects Portfolio and KPI (2018-2023)
<table><tr><td>Year</td><td>Total No. of Projects</td><td>Budget Billion</td><td>No. of troubled Projects</td><td>No. of Withdrawn Projects</td><td>Total No. of Handover Projects</td><td>Total No. of troubled Projects (withdrawn + troubled)</td></tr><tr><td>2018</td><td>1010</td><td>38.8</td><td>106</td><td>95</td><td>141</td><td>201</td></tr><tr><td>2019</td><td>1041</td><td>51.2</td><td>53</td><td>143</td><td>256</td><td>196</td></tr><tr><td>2020</td><td>838</td><td>40.3</td><td>27</td><td>105</td><td>225</td><td>132</td></tr><tr><td>2021</td><td>631</td><td>33.5</td><td>96</td><td>76</td><td>252</td><td>172</td></tr><tr><td>2022</td><td>429</td><td>27.6</td><td>39</td><td>77</td><td>120</td><td>116</td></tr><tr><td>2023</td><td>386</td><td>25.8</td><td>19</td><td>52</td><td>103</td><td>71</td></tr></table>
### a) Covid-19 Negative Impact
As the relentless march of Covid-19 continued unabated into 2021, its grip on projects tightened, reaching its peak in the early months of the year. Our recovery plan valiantly battled to stem the tide of setbacks, adapting, and refining itself with newfound expertise. However, the halt in logistics and travel proved to be an insurmountable hurdle. Delays in supplies became the norm, causing material prices to skyrocket and inflation to soar. The burden of processing, already a formidable challenge, intensified twofold, (shown in Fig. 1.3), which vividly portrays the impact of Covid-19 on defaulted projects, Where according to NWC-PMO Report, December 2021, 2022, Saudi Arabia, shows that the number of troubled projects reached its peak in mid-2020 with a number of 91 and $10.8\%$ of the project portfolio during the year 2020, which represents a large percentage of the total project portfolio. Then it reaches its peak at the beginning of the year 2021, becoming 143 projects, representing $22.6\%$ of the total project portfolio for that year. Embarking on a mission to revive struggling projects, the plan for 2022 and 2023 is unwavering in its determination to overcome various global challenges, particularly in the wake of the disruptive Covid-19 pandemic. As the year 2022 unfolds, the number of defaulted projects reaches its climax, standing at 98, accounting for a substantial $22.84\%$ of the entire project portfolio. However, armed with the implementation of the aforementioned treatment plan, a glimmer of hope emerges. Extensive research indicates that by year-end, the number of faltering projects is expected to dwindle to 39, representing a noteworthy $9.1\%$ of the total portfolio.
Fast forward to the onset of 2023, and the count of faltering projects stands at 25, with a faltering percentage of $10.6\%$. Yet, through unwavering dedication and collaborative efforts, the
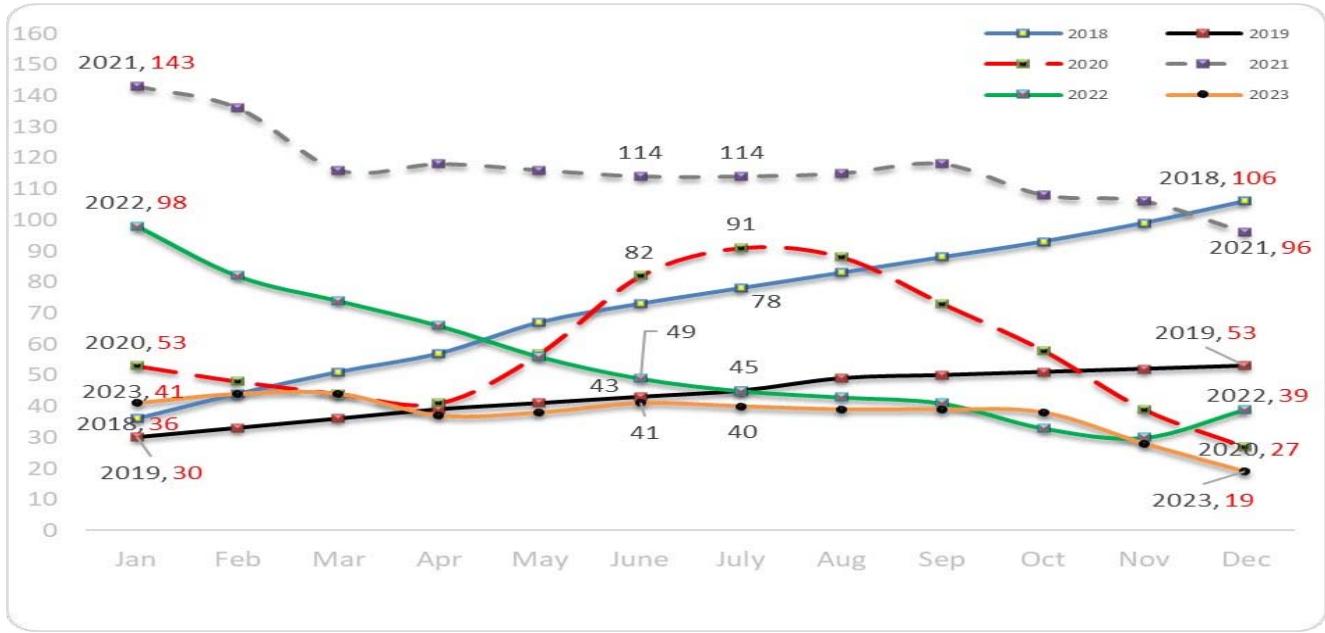
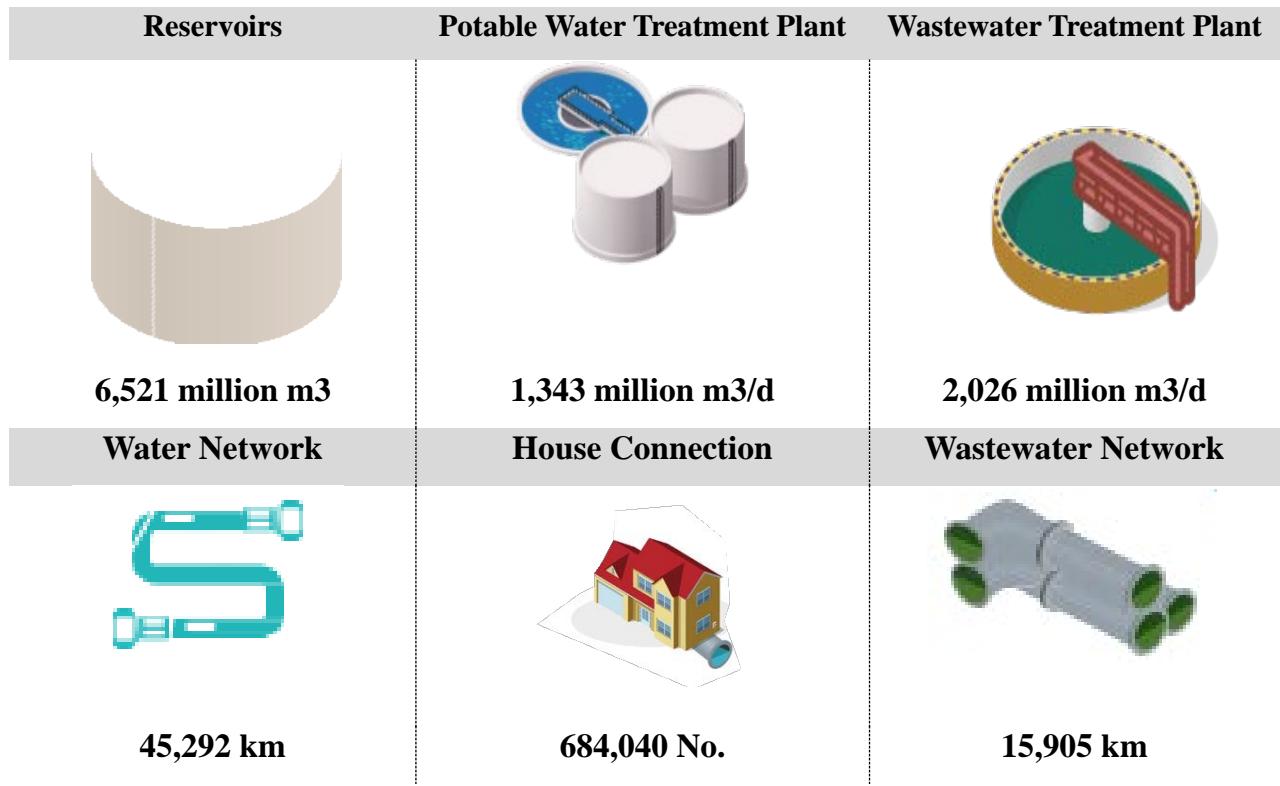
Figure 1.3: Troubled Projects during years (2018 to 2023) As a result, the projects a remarkable turnaround, generating impressive gains as shown in Fig. 1.4 where each project now plays a pivotal role in community service by spearheading the construction of strategic reservoirs, water purification plants, sewage
treatment plants, and operational tanks. Furthermore, millions of lengths of water and sewage networks have been added to enhance citizen services and improve water efficiency.

Figure 1.4: Projects Deliverables during years (2018 to 2023)
## X. STATISTICS RESULTS, ANALYSIS AND EVALUATION OF FINDINGS
The research data collection methods consist of two parts: a survey questionnaire based on the quantitative approach.
### a) Questionnaire Questions
The research questionnaire contained an independent variable (Cost Overruns) which consists of
3 dimensions of the number of total (16) paragraphs, and dependent variable (Infrastructure Projects Failures) consists of (5) paragraphs, all that evaluated by 5-point Likert Scale which illustrated below:
Table No. 9.1: Likert Scale Pentameter
<table><tr><td>Response</td><td>Strongly agree</td><td>Agree</td><td>Uncertain</td><td>Disagree</td><td>Strongly disagree</td></tr><tr><td>Score</td><td>5</td><td>4</td><td>3</td><td>2</td><td>1</td></tr></table>
The Independent variable (Cost Overruns) consists of 3 dimensions as follows:
- The First dimension: Project costs which contain (4) paragraphs.
- The Second dimension: Managing the project risk plan which contains (6) paragraphs.
- The Third dimension: Earned value management (EVM) which contains (6) paragraphs.
The Dependent Variable (Infrastructure Projects Failures) contain (5) paragraphs.
Descriptive Analysis:
Descriptive Analysis of demographic data
Job Position:
Table No. 9.2: Frequency and relative percent distributed for (Job Position)
<table><tr><td>Job Position</td><td>Frequency</td><td>Percent</td></tr><tr><td>Project Manager</td><td>172</td><td>37.23%</td></tr><tr><td>Project Engineer</td><td>109</td><td>23.59%</td></tr><tr><td>Project Control Manager</td><td>25</td><td>5.41%</td></tr><tr><td>Construction Manager</td><td>24</td><td>5.19%</td></tr><tr><td>Planning Manager</td><td>23</td><td>4.98%</td></tr><tr><td>Planning Engineer</td><td>22</td><td>4.76%</td></tr><tr><td>Director</td><td>18</td><td>3.90%</td></tr><tr><td>Engineering Manager</td><td>17</td><td>3.68%</td></tr><tr><td>Procurement Manager</td><td>14</td><td>3.03%</td></tr><tr><td>Cost Manager</td><td>13</td><td>2.81%</td></tr><tr><td>Contract Manager</td><td>11</td><td>2.38%</td></tr><tr><td>Risk Manager</td><td>8</td><td>1.73%</td></tr><tr><td>Quality Manager</td><td>6</td><td>1.30%</td></tr><tr><td>Total</td><td>462</td><td>100</td></tr></table>
The table No. 9.2 shows the Frequency and relative percent distributed according to (Job Position), it has been shown that the first set (Project Manager) with percent $37.23\%$, and the second set (Project Engineer) with percent $23.59\%$, and third set (Project Control
Manager) with percent $5.41\%$, Construction Manager with percent $5.19\%$, and Planning Manager with $4.98\%$.
Resident Country:
Table No. 9.3: Frequency and relative percentage distributed for (Resident Country)
<table><tr><td>Resident Country</td><td>Frequency</td><td>Percent</td></tr><tr><td>Saudi</td><td>310</td><td>67.10%</td></tr><tr><td>Egypt</td><td>135</td><td>29.22%</td></tr><tr><td>Emirates</td><td>8</td><td>1.73%</td></tr><tr><td>Canada</td><td>6</td><td>1.30%</td></tr><tr><td>Oman</td><td>1</td><td>0.22%</td></tr><tr><td>Kuwait</td><td>1</td><td>0.22%</td></tr><tr><td>Qatar</td><td>1</td><td>0.22%</td></tr><tr><td>Total</td><td>462</td><td>100</td></tr></table>
The table No. 9.3 show the Frequency and relative percent distributed according to (Resident Country), it has been shown that the first set (Saudi) with percent $64.1\%$, the second set (Egypt) with percent $29.22\%$ and third set (Emirates) with percent $1.73\%$.
Job Description
Table No. 9.4: Frequency and relative percentage distributed for (Job Description)
<table><tr><td>Experiences Years</td><td>Frequency</td><td>Percent</td></tr><tr><td>More Than 20</td><td>357</td><td>77.27%</td></tr><tr><td>(10-20)</td><td>98</td><td>21.21%</td></tr><tr><td>(5-10)</td><td>6</td><td>1.30%</td></tr><tr><td>Less Than 5</td><td>1</td><td>0.22%</td></tr><tr><td>Total</td><td>462</td><td>100</td></tr></table>
Table No. 9.4 show the Frequency and relative percent distributed according to (Experiences Years), it has been shown that the first set (More Than 20) with percent $77.27\%$, the second set (10-20) with percent $21.21\%$, third set (5-10) with percent $1.3\%$, and (Less Than 5) set with percent $0.22\%$.
### b) Hypothesis Test
The research Confidence Interval of the Difference is $95\%$, which mean $\alpha = 0.05$ If (P-Value $> \alpha = 0.05$ ), that means the research will approve H0, and Reject the H1, and Vice-Versa.
## i. Main Hypothesis H0
There is no Statistical relation between the Cost Overruns (Project costs, managing the project risk plan,
Earned value management (EVM)) and Infrastructure Projects Failures).
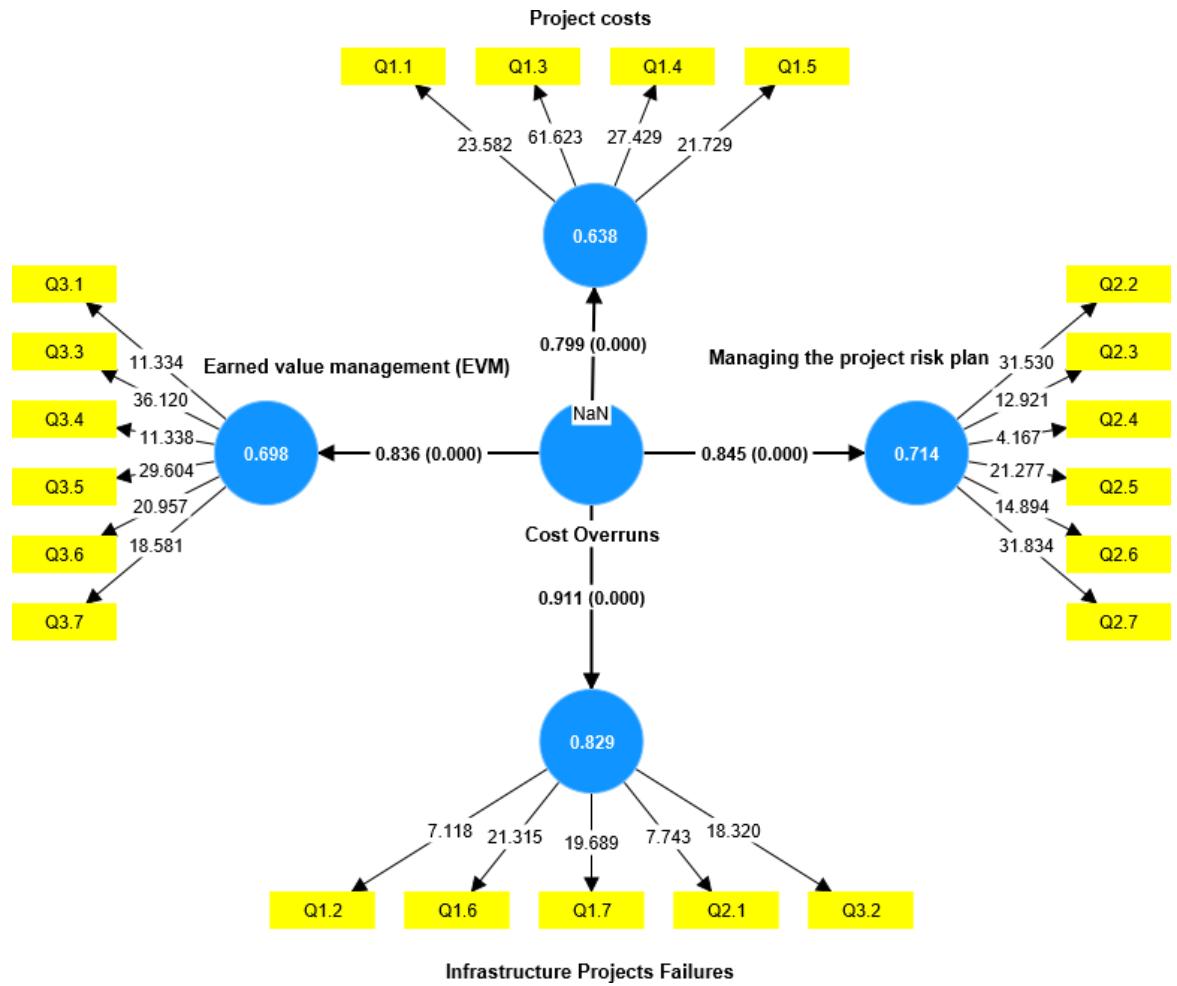
Figure (9.1): Modeling the structural equations of the main hypothesis
It is clear from the previous figure (9.1) that:
- There is a statistically significant effect from Cost Overruns on Infrastructure Projects Failures at a
R-square level of confidence of $95\%$, as the significance of the path reached 0.000, which is less than the error level of $5\%$ with a coefficient of 0.911.
Table No. 9.5: The coefficient of determination for main hypothesis
<table><tr><td></td><td>f-square</td><td>R-square</td><td>R-square adjusted</td><td>Path coefficients</td></tr><tr><td>Cost Overruns -> Infrastructure Projects Failures</td><td>4.850</td><td>0.829</td><td>0.827</td><td>0.911</td></tr><tr><td>Cost Overruns -> Project costs</td><td>1.763</td><td>0.638</td><td>0.634</td><td>0.799</td></tr><tr><td>Cost Overruns -> Managing the project risk plan</td><td>2.494</td><td>0.714</td><td>0.711</td><td>0.845</td></tr><tr><td>Cost Overruns -> Earned value management (EVM)</td><td>2.316</td><td>0.698</td><td>0.695</td><td>0.836</td></tr></table>
The table shows that the coefficient of determination for (Cost Overruns -> Infrastructure Projects Failures) equal 0.829, this means that Cost
Overruns explain $82.9\%$ from any change occur in Infrastructure Projects Failures, the unexplained percentage may be due to other factors that were not considered.
## ii. Sub-Hypothesis H1
There is no Statistical relation between the Project costs and Infrastructure Projects Failures.
H0: No significance, where the project budget is accurate estimate.
$$
\mu 1 = \mu 2
$$
H1: There is a level of significance where the project budget doesn't accurately estimate.
$$
\mu 1 \neq \mu 2
$$
Table No. 9.6: Goodness of fit for main hypothesis
<table><tr><td>Model fit</td><td>Saturated model</td><td>Estimated model</td></tr><tr><td>SRMR</td><td>0.075</td><td>0.075</td></tr><tr><td>NFI</td><td>0.808</td><td>0.804</td></tr></table>
It is clear from the table that the square root mean error for the actual model was 0.075, while it was 0.075 for the estimated model. It was also shown that the quality index (NFI) was 0.808, and then it is possible to judge the quality of the results obtained.
So, we reject the null hypothesis and accept the alternative hypothesis that there is statistical relation between the Project costs and Infrastructure Projects Failures.
$$
\mu\mathbf{1}\neq\mu\mathbf{2}
$$
According to the above, P-Value (Level of Sig. (2-tailed)) = 0 which is $< (\alpha = 0.05)$, that means the first research hypothesis (H1) has been verified positively, which is "Study of project costs accurately during the rollout phase will contribute positively to controlling cost overruns."
## iii. Sub-Hypothesis H2
There is no Statistical relation between Managing the project risk plan and Infrastructure Projects Failures.
H0: No significance, where estimated costs of risk on project budget cost and doesn't impact cost overrun.
$$
\mu 1 = \mu 2
$$
H2: There is a level of significance, Managing the project risk plan, will contribute positively to controlling cost overruns.
$$
\mu 1 \neq \mu 2
$$
Table No. 9.7: Goodness of fit for sub-hypothesis2
<table><tr><td>Model fit</td><td>Saturated model</td><td>Estimated model</td></tr><tr><td>SRMR</td><td>0.062</td><td>0.062</td></tr><tr><td>NFI</td><td>0.854</td><td>0.854</td></tr></table>
It is clear from the table that the square root mean error for the actual model was 0.062, while it was 0.062 for the estimated model. It was also shown that the quality index (NFI) was 0.854, and then it is possible to judge the quality of the results obtained.
So, we reject the null hypothesis and accept the alternative hypothesis that there is statistical relation between Managing the project risk plan and Infrastructure Projects Failures.
$$
\mu 1 \neq \mu 2
$$
According to above, P-Value (Level of Sig. (2-tailed)) = 0 which is $< (\alpha = 0.05)$, that is mean the second research hypothesis (H2) has been verified positively, which is "Managing the project risk plan, will contribute positively to controlling cost overruns."
## iv. Sub-Hypothesis H3:
There is no Statistical relation between the Earned value management (EVM) and Infrastructure Projects Failures.
H0: No significance, where Earned Value Management will not provide strong indicator for monitor & control project cost overrun.
$$
\mu 1 = \mu 2
$$
H3: There is level of significance, Using Earned value management (EVM) method during the project lifecycle will provide strong indicators that contributed to monitoring and control project cost overruns.
$$
\mu 1 \neq \mu 2
$$
Table No. 9.8: Goodness of fit for sub-hypothesis3
<table><tr><td>Model fit</td><td>Saturated model</td><td>Estimated model</td></tr><tr><td>SRMR</td><td>0.065</td><td>0.065</td></tr><tr><td>NFI</td><td>0.853</td><td>0.853</td></tr></table>
It is clear from the table that the square root mean error for the actual model was 0.065, while it was 0.065 for the estimated model. It was also shown that the quality index (NFI) was 0.853, and then it is possible to judge the quality of the results obtained.
So, we reject the null hypothesis and accept the alternative hypothesis that there is statistical relation between the Earned value management (EVM) and Infrastructure Projects Failure.
$$
\mu\mathbf{1}\neq\mu\mathbf{2}
$$
According to above P-Value (Level of Sig. (2-tailed)) $= 0$ which is $< (\alpha = 0.05)$, that means the third research hypothesis (H3) has been verified positively, which is "Using Earned value management (EVM) method during the project lifecycle will provide strong indicators that contributed to monitoring and control project cost overruns".
## XI. CONCLUSION AND RECOMMENDATIONS
### a) Root Cause of Failure Projects
The root causes of failure in water and wastewater projects which often lead to cost overruns that create a heavy financial burden for both the public and private sectors. The research analysis revealed a major reasons behind these cost overruns: inadequate initial cost estimation. Insufficient evaluation of project requirements and a limited understanding of potential risks can result in unrealistic budgeting, dramatically increasing the likelihood of cost overruns. Delays in project completion due to unforeseen circumstances, such as adverse weather conditions or logistical challenges, also contribute to cost overruns. These delays bring with them additional expenses related to extended construction periods, increased labor costs, and the need for extra resources. It's a vicious cycle that drains resources and exacerbates the problem. Poor project management and ineffective communication between stakeholders leading to further delays and cost overruns.
It is, therefore, of utmost importance for project managers and stakeholders involved in water and wastewater projects to conduct thorough cost estimations, identify potential risks, and establish effective communication channels to mitigate the impact of cost overruns. By addressing these issues head-on, the water and wastewater industry can significantly improve project delivery, ensure the efficient use of resources, and alleviate the financial strains on both public and private entities. Various other factors contribute to cost overruns in water and wastewater projects. One such factor is the lack of comprehensive asset management strategies. This lack of foresight leads to cost overruns during the project implementation phase. To combat this, project stakeholders must invest in comprehensive asset management strategies that encompass regular inspections, condition assessments, and long-term planning. By gaining a clear understanding of the condition and performance of their assets, utilities can accurately estimate the level of investment required, thereby minimizing the risk of cost overruns.
- Design flaws also play a significant role in driving up costs in water and wastewater projects. These flaws can range from errors or omissions in the engineering design to inadequate consideration of operational requirements.
- Construction delays are yet another major contributor to cost overruns in water and wastewater projects. These delays can be caused by a multitude of factors, such as adverse weather conditions, logistical challenges, or poor project
management. When projects experience delays, additional expenses are incurred due to extended construction periods, increased labor costs, and the need for supplementary resources. To mitigate the risk of construction delays, project managers should develop realistic project schedules, account for potential risks and uncertainties, and implement effective project management techniques. This includes regular monitoring and reporting of project progress, proactive identification and resolution of issues, and seamless coordination and communication among all stakeholders involved.
By tackling these issues head-on, the water and wastewater industry can pave the way for successful projects and alleviate the financial strains imposed on both public and private entities.
### b) Recommendation
Based on the research results, the following recommendations are made, which directly affect controlling the project costs and their impact on project management:
- The contracting companies should delegate authority to the competent authorities to distribute and allocate the resources for work package, and the planning department of the company should allow the experienced employees to participate in the development of the plans.
- The laws, regulations, and circulars that affect the cost planning and control process for construction and infrastructure projects should be studied and identify the procedures to be applied to control costs.
- The terms of the contract must be reviewed and audited. Also, the executive regulations of the procurement procedures should be considered, because of its binding clauses for the contractor.
- Familiarity with the prices of raw materials used according to the approval of the owner to procurement plan, taking into consideration the difference in prices of raw materials from one area to another.
- The price of the project items should be determined according to the specified profit margin, taking into consideration the nature of the project, size, and location, so that the profit margin is realised in all the items in a balanced manner.
- The project risk plan should take importance regarding project risk identification in advance and then estimate the costs of these risks within the overall project costs.
- Monitoring and control of project costs should be determined from the initiation process for the project and during the project life cycle, and use of appropriate measurement indicators to monitor and measure the cost plan.
Enhancing Cost Accuracy: Activity-based Costing (ABC)
- Better Cost Control:
Through the detailed insights provided by ABC, organizations can exercise better control over their costs. This includes identifying cost-saving opportunities, optimizing resource allocation, and improving overall operational efficiency.
Enhanced Budgeting and Planning:
ABC facilitates more accurate budgeting and planning by providing a realistic breakdown of costs associated with each activity. This helps organizations set more realistic budgets and allocate resources more effectively.
- Adaptability to Changes:
ABC is adaptable to changes in business processes. If there are changes in activities or resource requirements, the ABC model can be adjusted to reflect these changes, ensuring ongoing accuracy in cost allocation.
- Benchmarking and Performance Measurement:
ABC enables organizations to benchmark the performance of different activities and departments. This information is valuable for identifying areas of improvement and making strategic decisions to enhance overall organizational efficiency. While ABC offers numerous advantages in enhancing cost accuracy, it's important to note that its implementation may require a significant investment in data collection and analysis.
Generating HTML Viewer...
References
32 Cites in Article
K Ahsan,I Gunawan (2010). Analysis of Cost and Schedule Performance of International Development Projects.
Nabil Al-Hazim,Zaydoun Salem,Hesham Ahmad (2017). Delay and Cost Overrun in Infrastructure Projects in Jordan.
C Kothari (2004). Research Methodology: Methods and Techniques.
David Crowther,Geoff Lancaster (2008). Research Methods.
H Doloi (2011). Cost Overruns and Failure in Project Management: Understanding the Roles of Key Stakeholders in Construction Projects.
H Doloi (2012). Cost Overruns and Failure in Project Management Understanding the Roles of Key Stakeholders in Construction Projects.
Q Fleming,J Koppelman (1996). Cost and Schedule Trend Analysis—Forecasting of Baselines 193.
Bent Flyvbjerg,Mette Holm,Soren Buhl (2002). Underestimating Costs in Public Works Projects:<i>Error or Lie?</i>.
B Flyvbjerg (2017). The Oxford Handbook of Megaproject Management.
Bent Flyvbjerg (2018). Planning Fallacy or Hiding Hand: Which is the Better Explanation?.
Peter Love (2002). Influence of Project Type and Procurement Method on Rework Costs in Building Construction Projects.
Peter Love (2002). Influence of Project Type and Procurement Method on Rework Costs in Building Construction Projects.
Peter Love,Raymond Tse,David Edwards (2005). Time–Cost Relationships in Australian Building Construction Projects.
Bergkvist,Johansson (2007). Figure 2: The number of radiographers involved in different stages of the research process..
Peter Love,David Edwards,Hunna Watson,Peter Davis (2010). Rework in Civil Infrastructure Projects: Determination of Cost Predictors.
Robert Lopez,Peter Love (2012). Design Error Costs in Construction Projects.
M Easterby-Smith,M Thorpe,R Jackson,P (2012). Management Research.
M Marey-Perez,Al Amri,T (2020). Delays and cost Overrun Causes in Construction Projects of Oman.
Nwc (2021). Project Management Offices Report.
Nwc (2022). Project Management Offices Report.
Nwc (2023). Project Management Offices Report.
Y Olawale,Sun (2010). Cost and time control of construction projects: Inhibiting factors and mitigating measures in practice.
(2011). Practice Standard for Earned Value Management.
No ethics committee approval was required for this article type.
Data Availability
Not applicable for this article.
How to Cite This Article
Ahmed Mohamed Nabil. 2026. \u201cImpact of Cost Overruns on Infrastructure Projects Failures and Effective Cost Management to Reduce Overruns\u201d. Global Journal of Research in Engineering - J: General Engineering GJRE-J Volume 24 (GJRE Volume 24 Issue J2): .
Explore published articles in an immersive Augmented Reality environment. Our platform converts research papers into interactive 3D books, allowing readers to view and interact with content using AR and VR compatible devices.
Your published article is automatically converted into a realistic 3D book. Flip through pages and read research papers in a more engaging and interactive format.
This research is to investigate and analyze the reasons behind cost overruns in infrastructure projects compared to the planned costs. It also delves into establishing procedures for effectively monitoring and controlling project costs and measuring cost performance indicators throughout the project lifecycle. To achieve these goals, the research addresses three key questions that provide clarity on the research objectives. The research questions primarily focus on the estimation of risk costs for construction and infrastructure projects as an integral part of project knowledge areas. Additionally, the study analyzes the actual cost estimation methods employed by construction organizations and seeks to develop project cost management as an integrated part of all project knowledge areas, thereby enhancing the procedures for monitoring and controlling costs.
Our website is actively being updated, and changes may occur frequently. Please clear your browser cache if needed. For feedback or error reporting, please email [email protected]
Thank you for connecting with us. We will respond to you shortly.