I. INTRODUCTION
Nigeria is a blessed country with abundant physical, human and natural resource endowments; however, many of its populace lives below both the outright and relative poverty lines. The public survey conducted between 2003 and 2004 shows that somewhat above half of the populace (51.6 per cent) live under one USA dollar each day, and the relative national poverty incidence was found to be 54.4 per cent (National Bureau of Statistics (NBS), 2005, 2008). Notwithstanding, the most current Human Advancement Report by the United Nations Development Programme (UNDP, 2009) shows that about 64.4 and 83.7 per cent of the populace live beneath 2 every day, individually. This poverty circumstance is more awful in the rural areas where more than 70% of individuals dwell and make money through farming than in the metropolitan regions (UNDP, 2009). More than 86.5 per cent of the rural population is engaged in agriculture (NBS, 2005).
As one of the Sub-Saharan countries in Africa, Nigeria has a notable share of its population, hinging their means of livelihood and survival on agriculture. Therefore, from the same perspective, the past several decades have seen Nigeria's agrarian sector modifying productivity progression through the adoption of diverse new farming technology globally recognised as unparalleled agronomic practices. These practices include the utilisation of soil erosion control structures, improved seeds, pesticides, fertilisers, new farming techniques, among others.
This perpetually leaves farming as a key area fit for influencing most Nigerians differently. In this way, the perseverance of appetite and neediness in Nigeria should be, generally, the disappointment of the farming area to completely affect emphatically on individuals (NBS, 2017)
Notwithstanding the great achievements in the agricultural sector, Nigeria's agricultural performance lately remains deficient and, in reality, undeniably not as much as its potentials. Food demand surpasses the supply, hence prompting huge importations of food, which further erodes the economies foreign exchange. The growing food import over the course of the years brought about heightening foreign exchange expenditures, which might have been invested into different spaces of the economy. Nigeria imported food items worth ₦3.474 billion as of 1990 to ₦654 billion in 2007, whereas it could only boast of the agricultural export worth of N73.3 million (CBN, 2007); and this trend has not yet changed. According to a CBN report (pmnewsnigeria, 2018), Nigeria's monthly food import bill fell from 160.4million as of October 2018. These noticeable declines were steadily recorded in our monthly food import bill from 160.4million as of October 2018; A cumulative fall of 75.9 per cent and an implied savings of over $21billion on food imports alone over that period. Most evident was the 97.3 per cent cumulative reduction in monthly rice import bills, 99.6 per cent in fish, 81.3 per cent in milk, 63.7 per cent in sugar, and 60.5 per cent in wheat (pmnewsnigeria, 2018).
The expanded under-productivity in the nation could be an after-effect of various components, which might be direct or indirect. With the quick expansion in the human populace in the country, which was 201,252,133 (Worldometer Report, 2019), there is no doubt that resources are becoming scarcer than ever before, and therefore, development strategies should focus on policies that are intended to increase the productivity of scarce resources. Although smallholder farmers dominate agricultural production in Nigeria and individually exert little influence, collectively, they form the foundation upon which the economy rests. About 90 per cent of Nigeria's total food production comes from small farms, and at least 60 per cent of the country's population earns their living from these small farms, with farm sizes generally less than 2 hectares (Dansabo, 2017). According to the CBN, as Ships and Ports (2018) reported, the above percentage of farmers in the country represent about 862,069 farmers cultivating about 835,239 across the country.
Unfortunately, these smallholder farmers are subsistence farmers and use crude and traditional production implements and techniques resulting in the poor performance of the sector. Therefore, an effective economic development strategy will depend critically on promoting productivity and output growth, particularly among small-scale producers since they make up the bulk of the nation's agriculture. In order to boost the agricultural production base of the country, several policies have been put in place and these in a broad sense; include(Oluwatayo as cited in Dansabo, 2017): the accomplishment of independence in essential food supply and the attainment of food security; expanded production of agricultural raw materials for enterprises; expanded production and processing of export crops, utilising improved production and processing technologies; generating gainful employment; rational utilisation of agricultural resources, improved protection of agricultural land resources from drought, desert encroachment, soil erosion and flood, furthermore, the overall conservation of the environment for the sustainability of agricultural production; Advancement of the expanded use of current innovation to agricultural production and an improvement in the quality of life of rural dwellers (Olowa and Olowa, 2015).
Agricultural productivity in Sub-Saharan Africa remains low, inadequate and considerably behind other continents and regions in the world (Alliance for a Green Revolution in Africa, AGRA, 2013). The agricultural sector, which is known as smallholder mixed farming, is dominated by primary production. According to Food and Agricultural Organization (FAO 2009), the sector has not received sufficient support from sub-Saharan governments. Whilst many agricultural development initiatives in Africa are now supporting the use of modern and appropriate technologies to enhance productivity (AGRA, 2013), farmers continue to be disadvantaged due to failure to adopt such technologies that would guarantee sustainable land use and improved productivity.
According to FAO's (2005) definition and concepts, food security is achieved when individuals have the food they need to live their lives: it depends on sufficient, adequate food being available; people having access to it; food being well utilised; and on reliable availability and access (Wiggins and Keats, 2013). The Famine Early Warning Systems Network (FEWS NET, 2019) reported that Herders/farmers conflicts ravaging the country, especially the north-central states, parts of southeast and southwest and the armed banditry affecting households in Zamfara and Katsina states had threatened agricultural productivity in these parts of the country. This, according to FEWS NET, has resulted in under nutrition and food insecurity in these parts and the country as a whole. The report of the Global Hunger Index (GHI) for 2018 shows that hunger varies enormously by region. The 2018 GHI scores of SouthAsia and Africa (south of the Sahara), at 30.5 and 29.4, respectively, reflect serious levels of hunger. These scores stand in stark contrast to those of East and Southeast Asia, the Near East and North Africa, Latin America and the Caribbean, and Eastern Europe and the Commonwealth of Independent States, where scores range from 7.3 to 13.2, indicating low or moderate hunger levels (von Grebmer, Bernstein, Patterson, Sonntag, Klaus, Fahlbusch, Towey, Foley, Gitter, Ekstrom, and Fritschel, 2018).
Families spend up to seventy per cent of their income on food, and yet nearly fifty per cent of the children under five are malnourished (Ibok, 2012). The present status of hungry people in Nigeria stands at of the country's population of 201,252,133, equivalent to 66.4 million people (von Grebmer et al., 2018; Worldometer.com, 2019). These are matters of grave concern generally in light of the fact that Nigeria was independent in food production and was indeed a net exporter of food to different regions of the African continent during the 1950s and 1960s. Things changed dramatically for the worse following the global economic crises that hit the developing countries beginning from the 1970s. The discovery of raw crude and rising revenue from the country's oil and gas sector encouraged official neglect of the agricultural sector and turned Nigeria into a net importer of food (Ibok, 2012).
Loevinsohn, Sumberg, and Diagne (2012) see technology as the means and methods of producing goods and services, including methods of organisation as well as physical technique. According to Loevinsohn et al. (2013), new technology is new to a particular place or group of farmers or represents a new use of technology that is already in use within a particular place or amongst a group of farmers (Mwangi and Kariuki, 2015). Technology/innovation is the information/knowledge that allows some tasks to be executed more easily without any problem, and some services to be rendered or the manufacture of a product with less stress (Lavison, 2013). Technological innovation itself is pointed toward advancing a given circumstance or changing the state of affairs to a more attractive level. It helps the candidate to tackle a job simpler than he would have without the technology; consequently, it assists in saving time and labour (Bonabana-Wabbi, 2002).
The failure by farmers to adopt modern and appropriate technology has previously been blamed on farm location, land tenure security and other personal related factors such as age, gender (Nyariki, 2011), lack of incentives (Masano and Miles, 2004), limited ducation, household income levels, socio-economic status (Adekoya and Babaleye, 2009; Ali, 2014), simplicity and usefulness of the technology (McDonald, Heanne, Pierce, and Horan, 2015). Looking at the present rate of agricultural development and empirical pieces of evidence from the literature, the lacklustre approach to agricultural development in Nigeria, the attainment of Agenda 2030 (Sustainable Development Goals, SDGs) will be a wild goose chase.
Food is a basic necessity of life. Its importance is seen in the fact that it is a basic means of sustenance and adequate food intake in terms of quality and quantity; it is key for a healthy and productive life. The importance of food is also shown in the fact that it accounts for a substantial part of a typical Nigerian household budget (Omonona and Agori, 2007). Food security has always been at the spearhead of countries' agricultural advancement policies because it clearly indicates the population's standard of living, especially in countries where agriculture is the predominant factor of people's livelihood.
The problem of food insecurity is exacerbated by low production and crop loss mainly caused by low technological input, poor management practices, low and irregular rainfall, among others. Agricultural production is predominantly dependent on farm inputs in terms of improved seeds, modern farm implements like tractors, planters, harrowers, harvesters, etc. This has made the country's agricultural-based economy extremely fragile and vulnerable, which results in partial or total crop failure and subsequent food shortages and famines. This implies that, at present, the food security status of smallholder farmers in Nigeria is threatened. This is no doubt occasioned by certain factors such as illiteracy, poverty/lack of funds which has impeded the adoption of farm technology, making smallholder farmers vulnerable to food insecurity.
In Zimbabwe, Pindiriri (2018) observed that there is increased adoption among smallholders exposed to farm technologies. Langat et al. (2013) reported that the challenges of agricultural technology adoption in Kenya is being solved through gender-targeted programmes, off-farm employment, household size, education level, age, land size and extension services. Enjoy et al., as cited in Jha et al. (2019), observed that before an agricultural technology is introduced, promoted, and implemented, its sustainability for the local region must be investigated and include the perceptions of the farmers. This implies that the perception of local farmers goes a long way in determining technology adoption.
Previous studies in Nigeria dealt with agricultural technology adoption (Chukwuone, Agwu & Ozor, 2006) carried out in the six geopolitical zones-specifically, Katsina, Bauchi, Kogi, Ondo, Rivers, and Enugu states, as well as the role of agricultural technology in poverty reduction among crop farmers in Ohaji Area of Imo State (Nnadi, Chikaire, Nnadi, Utazi, Echetama & Okafor 2012). Studies in Taraba have dealt with the level of awareness of climate change impacts and adaptation strategies among women in Ardo-Kola (Philip, Ojeh and Tukura, 2018), the response of household food security to climate change extreme events and socio-economic characteristics of the household (Ike and Opata, 2017). Little has been done to analyse the impacts of farm technology on food security among smallholder farmers in Taraba State; it is invaluable to analyze if there has been an increase in food production, availability, and subsequently food security among smallholder farmers in Taraba State; and if the said increase is as a result of farm technologies. It is against this backdrop that this study analyzed technology adoption and food security among smallholder farmers in Taraba State.
II. AIM AND OBJECTIVES
The aim of this study is the analysis of farm technologies on food security among smallholder farmers in Taraba State.
The specific objectives include to:
1. Examine the food security status of smallholder farmers in Taraba State;
Examine factors affecting the adoption of farm technology and vulnerability to food insecurity by smallholder farmers in Taraba State;
Determine the level of adoption of farm technology by smallholder farmers in Taraba State; and
Determine the impact of farm technology on household food security in Taraba State.
In order to ascertain the level of relationship between the adoption of technology and food security, two hypotheses were stated:
There is no significant relationship between the level of farm technology adoption and smallholder farmers' food security in Taraba State.
There is no significant relationship between the factors affecting the adoption of farm technology and vulnerability to food insecurity by smallholder farmers in Taraba State.
III. MATERIALS AND METHODS
a) Study Area
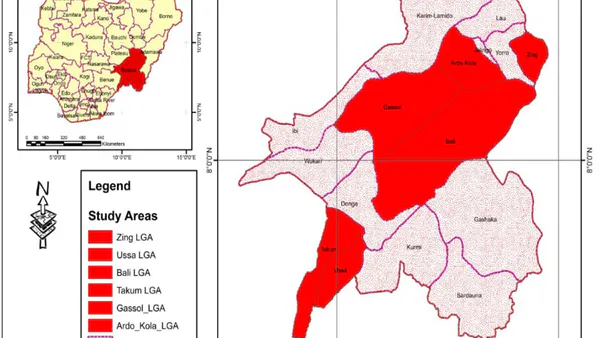
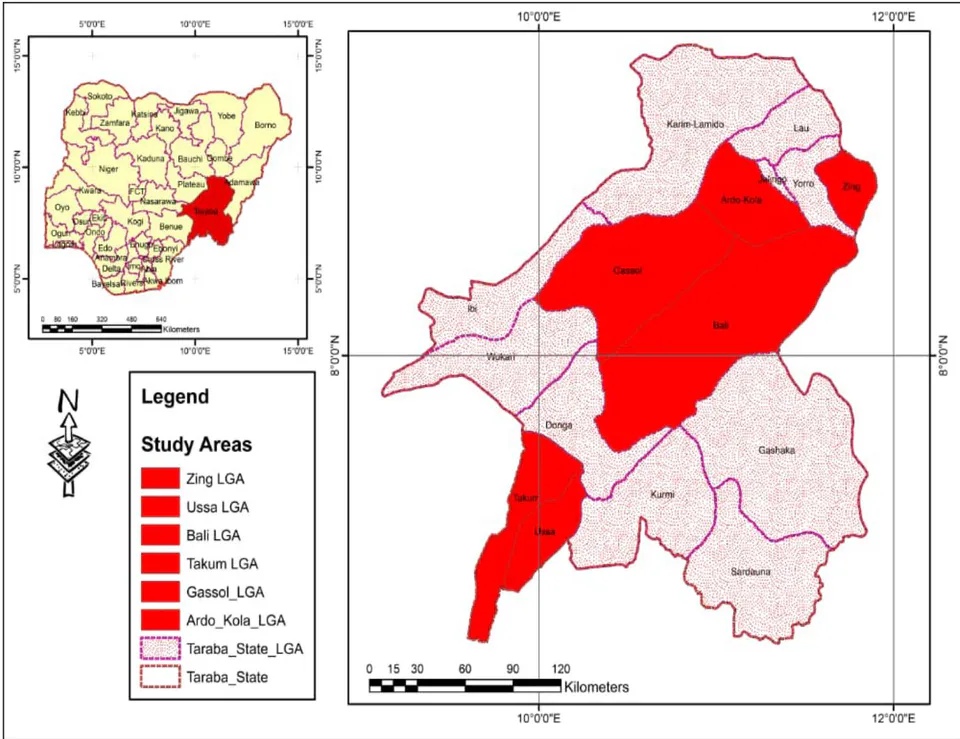
- Location: Taraba state is located in the Northeastern part of Nigeria. It lies between latitude 6°25' and 9°30' North and between longitude 9°30' and 11°45' East of the Greenwich Meridian (Fig. 1). The State shares boundaries with Bauchi and Gombe States in the North, Adamawa State in the East and the Cameroon Republic in the South. The state is bounded along its western side by Plateau, Nassarawa and Benue States. The state has a land area of 54 428km². The 2019 projected population of Taraba was about 3,345,666 at +2.94% per year according to the 2006 census (NPC, 2011). Taraba has 16 Local Government Areas with Jalingo as the State capital (Oruonye and Abbas, 2011).
Climate: Taraba has a tropical savanna climate well marked by wet and dry seasons. Constant high temperatures characterise tropical climates (at sea level and low elevations); all 12 months of the year have average temperatures of or higher. According to Wladimir Koppen and Rudolf Geiger's climate classification, or as it is sometimes called the Koppen-Geiger climate classification system, Taraba falls under the Aw: tropical savanna climate with non-seasonal or dry-winter characteristics. Aw climates have an articulated dry season, with the driest month having precipitation under 60mm (2.36 inches) of precipitation (Wikipedia, 2019). The wet season lasts, on average, from April to October, with mean annual rainfall that varies between 1058mm in the North around Jalingo and Zing to over 1300mm in the South around Serti and Takum. The wettest months occur in August and September, while the dry season is experienced from November to March; the driest months are December and January, with relative humidity dropping to about 15 per cent. The mean annual temperature around Jalingo is about 28°C with maximum temperatures varying between 30°C and 39.4°C, and minimum temperatures range between 15°C to 23°C. The Mambilla plateau has climatic characteristics typical of a temperate climate (Oruonye and Abbas, 2011).
Socio-economic Activities: The people of Taraba are mainly farmers, fishers and traders. Crops grown in Taraba include maise, groundnut, yam, millet, beans, rice, fruits and vegetables. Therefore, the major occupation of the people of Taraba State is Agriculture. Cash crops produced in the state include coffee, tea, groundnuts and cotton. Crops such as maise, rice, sorghum, millet, cassava, and yam are also produced in commercial quantity. However, because of the growth in the numbers of civil servants, public officials, educational institutions, and Federal Government establishments, establishments propelled the growth of the commercial and service section of the economy (Oruonye, 2012). Therefore, a significant portion of the population is engaged in the civil service (local, state and federal government). Others include; shop-keepers, service providers like barbing saloons, hairdressers, restaurants, hotels, GSM and recharge card business, transportation, business centres, fruits and vegetable trade and petroleum products businesses. Additionally, because of the agrarian nature of the state and the increasing rate of urbanisation, a significant part of the population is engaged in produce and livestock trades to cope with the demand of food and meat product of the populace (Oruonye, 2012).
b) Methodology
Research Design: The study adopted a descriptive survey research design. The survey research studied samples chosen from the population to discover the relative incidence, distribution, and inter-relations of sociological and psychological variables. Survey research is interested in the accurate assessment of the characteristics of whole populations of people. The study adopted the survey design because it more than merely uncoversdata; it interprets, synthesizes, and integrates these data and point to implications and inter-relationship. It offers ample opportunity for the investigator to display ingenuity and scholarliness in his/her interpretation of the data and understanding of their relationship, their apparent antecedents, and especially their implication.
Population of the Study: The population comprises all farmers in Taraba State. For the purpose of this research, only registered farmers in six (6) Local Government areas were selected for the study. The researcher selected two Local Government areas, each from the state's northern, central and southern zones. The basis for the selection of farmers in those Local Governments was due to the available and up-to-date data of farmers from the Value Chain Development Programme (VCDP, an International Fund for Agricultural Development IFAD, intervention programme), Federal Ministry of Agriculture and Rural Development (FMARD), and Taraba State Ministry of Agriculture (TSMA). There are approximately 78,688 registered smallholder farmers (TSMA/FMARD, 2019).
Sample Size and Sampling Technique: A multistage sampling technique was used to select the respondents for the study. The respondents were 384 farmers with smallholdings. Taraba state consists of three senatorial zones. These are the Taraba North (with six LGAs: Jalingo, Zing, Yorro, Ardo-Kola, Karim-Lamido and Lau), Taraba Central (with five LGAs: Gassol, Bali, Kurmi, Gashaka and Sardauna) and the Taraba South (with five LGAs: Wukari, Takum, Ussa, Donga and Ibi). The three zones were used for the study. For the purpose of this study, smallholder farmers refer to farmers who rely predominantly on family-provided labour, which is made up of at least four persons – the farmer, his wife and two children. In addition, they are resource-poor in terms of farming and financial inputs with farms sizes of about two hectares, which are predominantly run for subsistence with the aid of hoes, cutlasses and other local implements.
First, two LGAs were selected, using random sampling from each zone, making a total of six LGAs based on the availability of data on registered farmers and the predominance of farming activities in these areas. Secondly, three (3) farming communities were randomly selected, each from Ardo-Kola, Zing, Bali, Ussa and Takum LGAs, while four (4) communities were selected from Gassol to give a total of sixteen (16) communities. Since it would not be convenient for the researcher to study the entire population, the sample size was determined using the Raosoft method of sample size calculation (Raosoft ©).
The Local Governments selected for the study include Ardo-Kola and Zing (North), Bali and Gassol(Central) and, Takum and Ussa (South); they were selected purposively based on available farmers' data. The available data of farmers in the selected Local Governments and sample size is shown below.
| Zones | Local Government Area | Farmers' Population | Sample Size |
| North | Zing | 19,216 | 70 |
| Ardo-Kola | 15,222 | 66 | |
| Central | Bali | 18,683 | 66 |
| Gassol | 19,033 | 66 | |
| South | Takum | 15,374 | 66 |
| Ussa | 11,902 | 66 | |
| Total | 99,430 | 400 |
Finally, in each community, twenty-four (24) respondents (smallholder farmers) were randomly selected from each of the sixteen (16) communities with the help of extension agents and research assistants in the area and the farmers' cooperatives in each of the communities, making three hundred and eighty-four (384) respondents. This is the sample size for this study. Three (3) extension agents were used for the study. They provided the necessary information on farming communities in the local governments. Two (2) research assistants were recruited to help in the distribution and retrieval of the questionnaires as well as coding of the data.
Instrument for Data Collection: Data for this study was obtained from primary and secondary sources. The research questionnaire was used for data collection, whereas the secondary source comprises data from TADP, IFAD, FMARD and TSMA. Data was collected using a set of structured questionnaires. The questionnaires, four hundred (400) was administered to respondents eliciting information on their demographic and socio-economic characteristics, level of adoption of farm technology, the impact of farm technology on household food security, the food security status of smallholder farmers and the factors affecting the adoption of farm technology and vulnerability to food insecurity by smallholder farmers. The study wanted to administer three hundred and eighty-four (384) respondents, but in order to take care of respondents misplacing or not filling out the questionnaires correctly, the error margin was reduced to 4.88% as against 5%, and the number of questionnaires was increased to four hundred (400); which was the amount that was administered to the respondents in the study area. Three hundred and eighty-five (385) questionnaires were returned in all.
Data Analysis: The descriptive statistics involving the use of frequency count, percentage (%), the mean and standard deviation were used. The choice was premeditated on the ease in the interpretation of results obtained. In the presentation, analysis and interpretation of data, tables were used from which inferences were drawn. Most importantly, the analysis was carried out in line with the objectives of the study, as earlier on stated in chapter one. Correlation analysis was carried out to test the null hypotheses: there is no correlation between the level of farm technology adoption and smallholder farmers food security in Taraba State and there is no correlation between the factors affecting the adoption of farm technologies and vulnerability to food insecurity by smallholder farmers in Taraba State.
IV. STUDY RESULT
a) Demographic Characteristics of the Respondents
This section presents the demographic characteristics of the food security status of the respondents.
| Item | Frequency | Percentage % |
| Gender | ||
| Male | 209 | 54.3 |
| Female | 176 | 45.7 |
| Age | ||
| 26 – 35 | 76 | 19.7 |
| 36 – 45 | 179 | 46.5 |
| 46 – 55 | 104 | 27 |
| 56> | 26 | 6.8 |
| Marital Status | ||
| Single | 133 | 34.5 |
| Married | 252 | 65.5 |
| Educational Level | ||
| No Formal Edu. | 67 | 17.4 |
| Adult Education | - | - |
| Primary | 93 | 24.2 |
| Secondary | 116 | 30.1 |
| Tertiary | 109 | 28.3 |
| Household Size | ||
| 1 – 3 | 122 | 31.7 |
| 4 – 6 | 179 | 46.5 |
| 7 > | 84 | 21.8 |
| Farming Experience | ||
| 1 – 10 | 119 | 30.9 |
| 11 – 20 | 163 | 42.3 |
| 21 > | 103 | 26.8 |
| TOTAL | 385 | 100 |
Table 4.1 shows that 209 respondents representing 54.3%, are males while 176 respondents represented by 45.7% are females. The age distribution of the respondents shows that those within the age bracket of 36 – 45 years represent 46.5%, followed by those in the age bracket of 46 – 55 years represented by 27%. Those in the age bracket of 26 – 35 and 56 above age bracket are represented by 19.7% and 6.8%, respectively. The marital status of the respondents shows that 252 respondents representing 65.5%, are married, while 133 respondents representing 34.5%, are single. The table also shows that most of the respondents have formal education. The majority of the respondents, represented by 116 (30.1%), have attained a secondary level of education. Those with a tertiary and primary level of education represented 28.3% and 24.2%, respectively. However, 67 respondents representing 17.4%, had no formal education. The household size of the respondents shows that 179 respondents' household size is 4 – 6. Those with a household size of 1 – 3 represented 31.7% of the sampled population. Eighty-four (84) respondents representing 21.8%, have household size above seven (7). The farming experience of the respondents shows that 163 respondents representing 42.3%, have 11 – 20 years of farming experience, 119 representing 30.9% have 1 – 10 years farming experience. Those with over
b) Food Security Status of Smallholder Farmers
| Statement | VHE (%) | HE (%) | L.E. (%) | VLE (%) |
| In the past four weeks, did you worry that your household would not have enough food? | 175 (45.5) | 53 (13.8) | 103 (26.7) | 54 (14) |
| In the past four weeks, were you or any household member not able to eat the type of food you preferred due to lack of resources? | 183 (47.5) | 72 (18.7) | 38 (9.9) | 92 (23.9) |
| In the past four weeks, did you or any household member eat a limited variety of food due to a lack of resources? | 141 (36.6) | 153 (39.7) | 51 (13.3) | 40 (10.4) |
| In the past four weeks, did you or any household member eat some food that you really did not want to eat due to a lack of resources to obtain other types of food? | 191 (49.6) | 122 (31.7) | 46 (11.9) | 26 (6.8) |
| In the past four weeks, did you or any household member eat a smaller portion of a meal than you felt you needed because there was not enough food? | 163 (42.3) | 107 (27.8) | 82 (21.3) | 33 (8.6) |
| In the past four weeks, did you or any other household member eat fewer meals in a day because there was not enough food? | 109 (28.3) | 48 (12.5) | 144 (37.4) | 84 (21.8) |
| In the past four weeks, did you or any household member go to sleep at night hungry because there was not enough food? | 215 (55.8) | 42 (10.9) | 77 (20) | 51 (13.3) |
Source: Field survey, 2020
The result presented in Table 4.2 shows the food security status of smallholder farmers in the study area. The table shows that of the study sample went to bed hungry due to the household's inadequate food supply, while went to bed on a full stomach. Also, of the study sample were not able to acquire and eat the type of food they preferred due to lack of resources, and had no challenge acquiring and eating what they preferred at the time they wanted it. Meanwhile, of the respondents worry about food not being enough within their households, while are less worried about enough food within their household. This shows that smallholder farmers experience food insecurity challenges, as the majority of them are yet to adopt the use of farm technology in the study area. This could be attributed to the lack of political will to commitment on the side of the government, farming system, poverty, illiteracy, family size and the rurality of the communities under study. The findings of the study are in line with the result of Osabohien, Osabuohien, and Urhie (2017) in which was found that there is a high level of food insecurity as a result of insufficient attention on food production occasioned by the pervasive influence of oil that is the major export product in Nigeria. Similarly, the result is also in consonance with Ike and Opata (2017) findings, which reported that of respondents in their study were food insecure in Taraba State. The finding also conforms to the finding of Fakayode et al. (2009), in which it was reported that only of their study samples were food secured as against who were food insecure with moderate hunger.
c) Factors Affecting Adoption of Farm Technology This section presents result on factors affecting farm technology adoption and vulnerability to food insecurity.
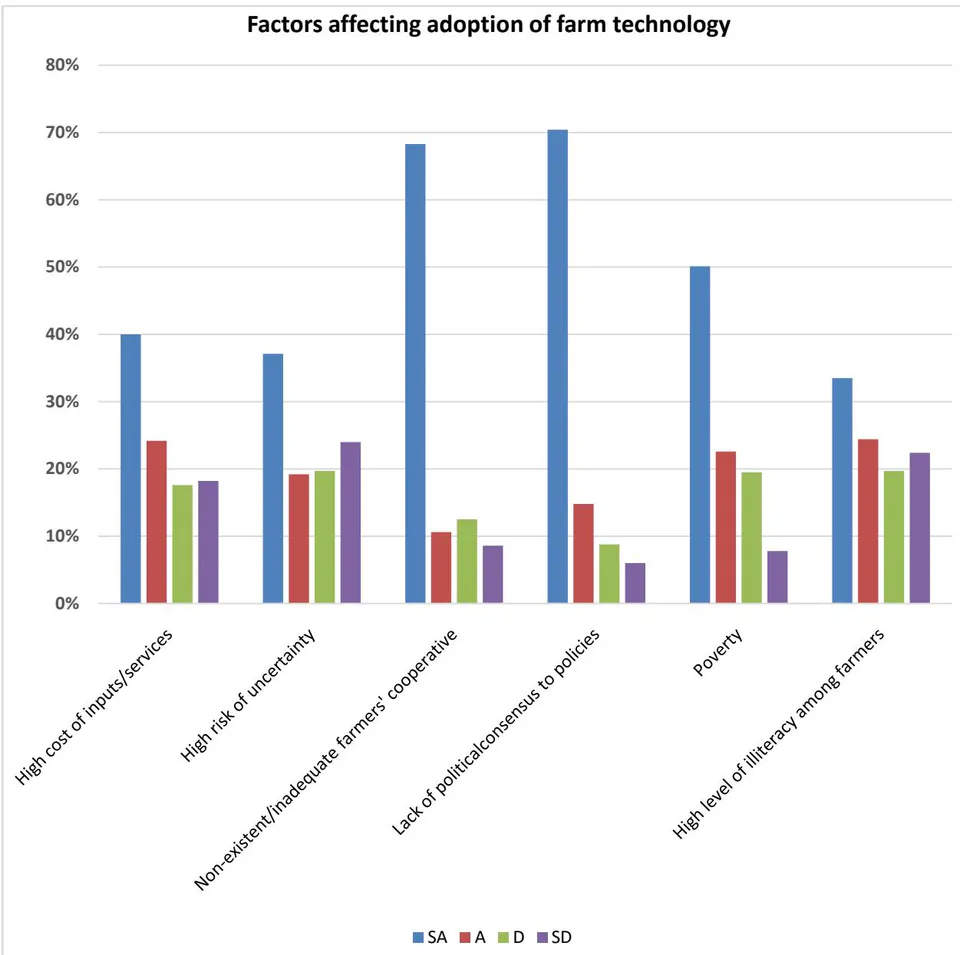
Figure 2: Factors affecting adoption of farm technology
The result presented in Figure 2 shows factors impeding the adoption of farm technology. The result revealed that lack of political will to commitment on the side of government, non-existence/inadequate cooperative organisations, poverty, high costs of agricultural inputs and services, risk of uncertainty in agriculture, and high level of illiteracy among farmers with percentages of 70.4, 68.3, 50.1, 40, 37.1 and 33.5 respectively are some of the stonewalls met by smallholder farmers. This implies that the factors militating against smallholders' adoption of farm technology include costs, risks, inadequate cooperative organisations, lack of political will to commitment on the side of government, poverty, and illiteracy. The result corroborates the finding of Godffrey, Halimu, and Titus (2016) that group involvement and social support are the two important components that significantly influenced the adoption of appropriate agricultural production technologies among farmers in Kenya. This shows that with adequate cooperative groups, the adoption of agricultural technologies will be easy. Similarly, the findings reflect the result of Bethel (2015), where it was reported that the major constraints to the use of agricultural technology were the high cost of inputs, availability of inputs, lack of technical know-how, and poverty among farmers.
| Variable | N | Mean | SD | R | Sig | P |
| Age | 385 | 3.16 | 1.11 | 727 | .000 | Significant P<0.05 |
| Technology Adoption | 385 | 2.92 | 1.10 |
| Technology type | VHE (%) | HE (%) | L.E. (%) | VLE (%) | Mean | S.D. |
| Tractor | 129 (33.5) | 104 (27) | 67 (17.4) | 85 (22.1) | 2.71 | 1.16 |
| Incubator | 104 (27) | 93 (24.2) | 116 (30.1) | 72 (18.7) | 2.64 | .51 |
| Fertiliser | 184 (47.8) | 43 (11.2) | 76 (19.7) | 82 (21.3) | 3.11 | .41 |
| Harvester/planter | 73 (19) | 82 (21.3) | 141 (36.6) | 89 (23.1) | 2.39 | 1.23 |
| Sprayer | 176 (45.7) | 132 (34.2) | 51 (13.3) | 26 (6.8) | 3.22 | .95 |
| Improved/Hybrid seeds | 166 (43.1) | 118 (30.7) | 61 (15.8) | 40 (10.4) | 3.02 | .96 |
| Herbicide/Pesticides | 195 (50.7) | 67 (17.4) | 60 (15.6) | 63 (16.3) | 3.13 | .40 |
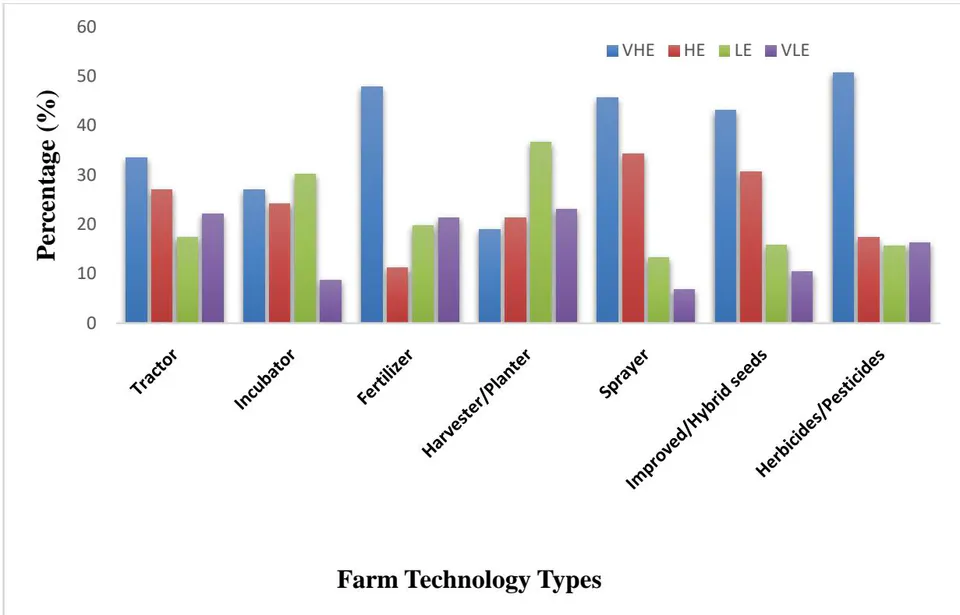
Figure 3: Level of Farm Technology Adoption
Table 4.4 shows that most respondents adopted herbicides/pesticides (50.7%), fertilizer (47.8%), sprayer (45.7%), improved/hybrid seeds (43.1%) and tractor (33.5%). The adoption of herbicides/pesticides, fertiliser, sprayer and improved/hybrid seeds could be attributed to availability, accessibility and affordability.
The result shows that incubator (27%) and harvester/planter (19%) have a low level of adoption among smallholder farmers in the study area. As indicated in the table above, the technologies that were less adopted could be attributed to their availability and affordability. The table shows that harvester/planter (19%) is not a farm technology adopted by many smallholder farmers in the study area. Most of the smallholder farmers live in rural areas with little or no access to or knowledge of these technologies, thus the low level of adoption.
| Value | df | Asymptotic significance (2-sided) | |
| Pearson Chi-Square | 9 | .000 | |
| Likelihood Ratio | 708.177 | 9 | .000 |
| Linear-by-Linear Association | 348.341 | 1 | .000 |
| N of Valid Cases | 385 |
The result presented in Table 4.5 shows the chi-square result for the level of farm technology adoption. The result shows a significant level of farm technology adoption among smallholder farmers in Taraba State. This thus indicates that the level of farm technology adoption among smallholder farmers in Taraba State is moderate.
e) Impact of Technology Adoption on Smallholder Farmers
This section presents results on the impact of farm technology on household food security.
| Statement | VHE (%) | HE (%) | L.E. (%) | VLE (%) | Mean | S.D. |
| There is an increase in crop yield due to technology adoption | 143 (37.1) | 151(39.2) | 51(13.3) | 40 (10.4) | 3.04 | .96 |
| Smallholder farmers experience improves cropping system due to technology adoption | 181 (47) | 122(31.7) | 54(14) | 28 (7.3) | 3.21 | .95 |
| Adoption of farm technology increases farm input among smallholder farmers | 158 (41) | 117(30.4) | 75(19.5) | 35 (9.1) | 3.02 | 1.0 |
| Adoption of farm technology improves storage system devoid of pest infestation | 104 (27) | 88 (22.9) | 116(30.1) | 77 (20) | 2.64 | 1.11 |
| Adoption of farm technology makes farm cultivation among smallholder farmers fast, efficient and easy | 195 (50.7) | 62 (16.1) | 60(15.6) | 68 (17.6) | 3.13 | 1.14 |
Source: Field survey, 2020
The result presented in Table 4.6 above shows that farmers that adopted one form of farm technology or the other revealed faster farm cultivation, improved cropping system, increased farm input, increased crop yield, and improved storage system with percentages of 50.7, 47, 41, 37.1, and 27 respectively. This implies that technology adoption positively impacts smallholder farmers in the study area, as it enhances farm input, output, and storage. The finding is in line with the result of Bethel (2015) in which was found that agricultural technology had a positive effect on farm output for farmers that used it in Bayelsa State, Nigeria. The finding also reflects the result of Muzari et al. (2017), where it was found that the use of conservation agriculture and irrigation technology resulted in significantly higher maize yield among smallholder farmers among households in Ward 15 of Makonde District in Mashona land West Province in North Central Zimbabwe.
| Value | df | Asymptotic significance (2-sided) | |
| Pearson Chi-Square | 9 | .000 | |
| Likelihood Ratio | 492.941 | 9 | .000 |
| Linear-by-Linear Association | 208.605 | 1 | .000 |
| N of Valid Cases | 385 |
The result presented in Table 4.7 shows the chi-square test result for the impact of farm technology adoption on smallholder farmers. The result indicates that farm technology adoption has a significant impact on smallholder farmers' household food security in Taraba State. This means that farm technology adoption impacts smallholder farmers' food security status in Taraba State.
f) Reasons for Technology Adoption
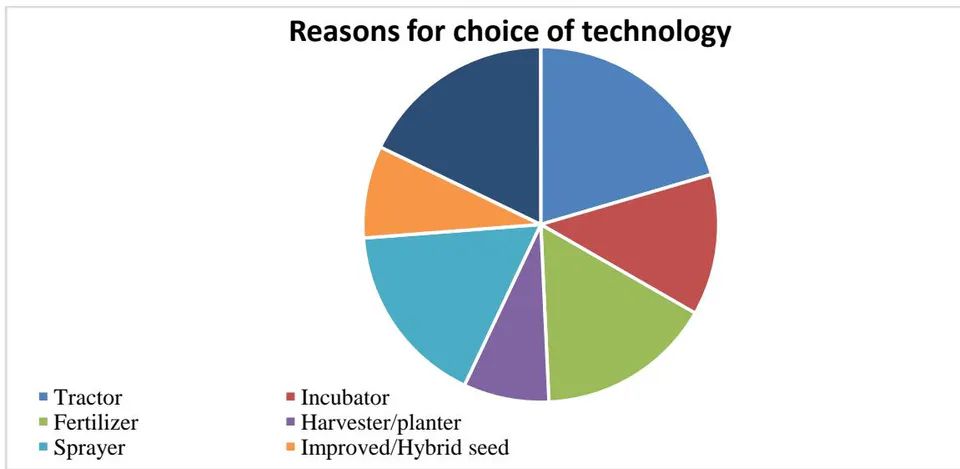
Table 4.8 reveals the reasons for the adoption of the various technologies by the respondents.
Respondents who utilised tractors recorded the highest percentage of 59.2, which implies that tractor usage is based on its availability and simplicity as well as effectiveness. Herbicide/pesticide usage recorded a percentage of 50.1, which implies that the choice of herbicides/pesticide is based on availability, affordability and simplicity of usage. Furthermore, the usage of sprayer and fertiliser recorded percentages of 48.3 and 46.1, respectively, implying that availability, affordability and simplicity were the reasons for adopting sprayers and fertilisers.
| Technology Type | Availability (%) | Affordability (%) | Simplicity (%) | Effectiveness (%) | Mean | S.D. |
| Tractor | 222 (59.2) | 30 (8) | 72 (19.2) | 51 (13.6) | 3.1 | .61 |
| Incubator | 139 (100) | - | - | - | 2.6 | .22 |
| Fertiliser | 173 (46.1) | 97 (25.9) | 72 (19.2) | 33 (8.8) | 2.7 | .45 |
| Harvester/planter | 84 (40.5) | 44 (21.3) | 79 (38.2) | 2.5 | .63 | |
| Sprayer | 181 (48.3) | 117 (31.2) | 54 (14.4) | 23 (6.1) | 3.1 | .46 |
| Improved/hybrid seeds | 91 (42.1) | 30 (13.9) | 35 (16.2) | 60 (27.8) | 2.8 | .69 |
| Herbicides/Pesticides | 193 (50.1) | 107 (27.8) | 54 (14) | 31 (8.1) | 3.2 | .64 |
V. SUMMARY AND CONCLUSION
The study analysed the impact of farm technologies on food security among smallholder farmers in Taraba State. As one of the Sub-Saharan countries in Africa, Nigeria has a substantial share of its population, hinging their means of livelihood and survival on agriculture. Therefore, from the same perspective, the past several decades have seen Nigeria's agrarian sector modifying productivity progression by adopting diverse new farming technology globally recognised as unparalleled agronomic practices.
Food insecurity has remained a fundamental challenge in Nigeria. Food security has always been at the spearhead of countries' agricultural advancement policies because it clearly indicates the population's standard of living, especially in countries where agriculture is the predominant factor of people's livelihood. Food insecurity is exacerbated by low production and crop loss mainly caused by low technological input, poor management practices, low and irregular rainfall, among others. Agricultural production is predominantly dependent on farm inputs in terms of improved seeds, modern farm implements such as tractors, planters, harrowers, harvesters, etc.
Findings revealed that most of the respondents produced crops such as maise, cassava, fruits, white-seed melon, rice, beans and vegetables, among other crops. The types of technology used by farmers in the study area include fertiliser, herbicides/pesticides, improved seeds, and tractor. The smallholder farmers adopted herbicides/pesticides, fertiliser usage, sprayer, improved seeds and tractors. The study found that few farmers only adopt irrigation in the study area. Farmers that adopted one form of farm technology or the other experienced faster farm cultivation, improved cropping system, increased farm input, increased crop yield, and improved storage system. The result revealed that the food security status of smallholder farmers in the study area is moderate (44%). This shows that the smallholder farmers experience food security challenges. The study found that the high costs of agricultural inputs and services, risk of uncertainty in agriculture, nonexistence/inadequate cooperative organisations, lack of political consensus to commitment, poverty and illiteracy were the most prevailing factors militating against technology adoption among smallholder farmers.
The adoption of farm technology will go a long way in enhancing their farm inputs and food security status. The majority of the farmers in Taraba state produce crops such as maise, cassava, fruits, white-seed melon, rice, beans and vegetables, among other crops. The types of technology used by farmers include fertiliser, herbicides/pesticides, sprayers, improved seeds, and tractors. The adopted farm technologies include fertiliser, herbicides/pesticides, sprayers, improved seeds and tractors. Irrigation is not much adopted in the study area. The farmers that adopted one form of farm technology or the other faster farm cultivation improved cropping system, increased farm input, increased crop yield, and improved storage system. The status of smallholder farmers' food security in the state is moderate. This shows that smallholder farmers experience food security challenges. Lack of political consensus to commitment on the side of government, nonexistence/inadequate cooperative organisations, poverty, high costs of agricultural inputs and services, risk of uncertainty in agriculture, and illiteracy were the most prevailing factors militating against technology adoption among smallholder farmers.
VI. RECOMMENDATIONS
Based on the findings of the study, the following recommendations are put forward:
Small holder farmers should be enlightened about the various types of farm technologies and the benefits derivable from their usage.
The government, NGOs and other stakeholders should make these farm technologies accessible and affordable to smallholder farmers who may be interested in adopting them.
The federal, state and local governments should invest in agriculture and make it attractive and profitable so that smallholder farmers can increase their production capacity and earnings, thereby increasing their socioeconomic status.
Grants and loans should be given to smallholder farmers to enable them to produce more food to curb food insecurity.