The present study estimates the impact of financial development and resource rents on total factor productivity in the Gulf Cooperation Council (GCC) countries by applying the GMM approach. The study takes the panel data from 1984 through 2019, while keeping population, corruption, and trade openness as control variables. The results reveal that financial development and resource rents affect total factor productivity positively in GCC countries. Moreover, the results show that improving trade openness contributes positively to total factor productivity. Though, raising corruption and population deteriorate productivity. Thus, this study emphasizes on the need to improve the quality of political institutions to minimize corruption and encourage contraceptives to control the fertility rate for intergenerational sustainability. Further, there is a need to promote trade and financial integration with developed countries, and to efficiently utilize natural resource rents for long-term growth and development.
## I. INTRODUCTION
Individuals, firms, and enterprises in developed and developing countries have high external and internal financial requirements. It is easy to fulfill these requirements if the financial sector is well formalized, developed, and integrated. The financial sector advancement helps countries to achieve sustainable growth and development (Tariq et al., 2020). In developing countries, financial development (FD) leads to the accumulation of human capital especially in education and skill development. Moreover, financial development improves business environment and infrastructure, and attracts Foreign Direct Investment (FDI) (Li and Liao, 2020). Levine (1997) finds that FD might boost long-run productivity growth by reducing information and transaction costs and increasing the rate of investment and technological advancement.
In the traditional growth model, a healthy financial system boosts productivity by facilitating trade channel funds to increase saving rate and investment levels. Still, this role is limited due to diminishing returns to capital (Ehigiamusoe and Samsurijan, 2021). However, the capital might not have diminishing returns due to endogenous technological advances via R&D, which has positive externalities on TFP (Xu and Pal, 2011). It is found that a repressed financial system hinders growth and productivity due to the lack of credit provision to the innovators, the misallocation of resources due to financial distortions, and the inefficiency due to increased cost of doing business (Aghion et al., 2008). FD enables households to switch from unproductive tangible assets into productive financial assets, which increases the credit supply and productivity (Al-Hussainy et al., 2008; Gloede and Rungruxsrivorn, 2013). Moreover, FD reduces market failure that is caused by multiple constraints and under different arrangements (Beck et al., 2008).
Past studies have shown that the effects of resource rents over TFP have mixed outcomes depending on the country's reliance on its natural resources (Aljarallah, 2020a; 2020b). It is found that countries with minimal resources tend to have little or no effect of resource rents on their productivity (Ulusoy and Tas, 2017; Xiao et al., 2022), while countries with higher natural resources tend to show a clear effect of resource rents on TFP (Aljarallah, 2021). The natural resource rents in resource-abundant economies affect productivity positively, while rents from natural resource-dependent economies affect productivity negatively as it slows down economic activities (Zaidi et al., 2019). Though an increase in fiscal revenues boosts TFP growth through spending on innovation and production technology, it is crucial to note that the positive impact of resource rents on TFP is majorly dependent upon institutional quality, legal system, and property rights (Aljarallah, 2020). In an economy where institutions are producer friendly, the increased inflow of receipts from the sale of natural resources generates additional sources of income for producers, pushing profit margins upwards (Kaznacheev, 2013). Thus, the quality of institutions has shown a significant role in determining whether natural resource abundance is a blessing or a curse. The institutions would ensure an environment that fosters TFP through innovation and technological changes, promoting growth and development (Tebaldi, 2016). While many researchers assert the positive impact of resource rents on TFP, there is substantial evidence that they would vouch against it. The argument is based upon the resource curse hypothesis, which states that the abundance of natural resources has a crowding-out effect on economic activities, especially in the manufacturing sector, which drives the growth rates (Atkinson and Hamilton, 2003).
Several studies have shown that corruption has a negative effect on TFP, particularly in low- growth countries. Low-growth countries have less export intensity, less spending on education and low human capital (Demir et al., 2022). High levels of corruption are evident to affect TFP through the adverse effects on the rate of investment, scientific research and innovation, employment, volume and quality of the production factors, and output growth (Keita, 2017; Aqeel et al., 2022). Moreover, corruption affects TFP through tax burden (Keita and Laurila 2021). However, the increase in tax rates doesn't trigger corruption in effectively governing economies with less tax evasion (Dzhumashev, 2014). As per Swaleheen (2011), widespread corruption is one of the main reasons that causes the developing countries to fall back instead of catching up with the developed countries. Teoman et al., (2020) find that the greater the size of the government, the higher the corruption and the lower the TFP. As corrupted politicians tend to create more opportunities for bribery instead of accelerating the governmental processes (Myrdal, 1969). Also, these countries would be stuck with low-value projects due to the shift in the investment flow (Murphy, 2000), thus, harming the investment levels in the country.
The Global Economic Respects (GER) stated that trade openness might accelerate growth by stimulating the latest forms of productivity and specialization, leading to rapid employment creation and poverty alleviation across countries. Thus, trade openness is estimated to affect TFP positively. As a result, trade openness is used as a benchmark for integration and globalization. Isaksson (2007) and Frankel and Romer (1999) find that competition and integration are essential factors that substantially affect TFP. Trade openness enhances TFP through different ways, such as competition, access to advanced technology, encouraging learning by doing, and inducing high demand for skilled labour (Majeed et al., 2010). This results in a stock of skilled human capital that significantly impact trade openness and TFP (Miller and Upadhyay, 2000). Thus, trade restrictions lead countries towards the underutilization of their human capital. Also, larger trade causes greater openness, which expands the country's ability to adopt efficient production techniques that lead to the rapid growth of TFP (Miller and Upadhyay, 2000). However, it is argued by Rodrick (1988) that trade protection does not necessarily discourage productivity growth. As trade liberalization might retard productivity growth by reducing the domestic incentives to invest in technological innovation. Also, trade openness might worsen the export performance due to low supply elasticities in the least developed countries (Stein et al., 1989).
Earlier studies have shown that the impact of population growth on TFP has different results. Klasen and Nestmann (2006) and Boserup (1987) have shown a positive impact of population on TFP as the increase in labour force causes greater productivity. However, other scholars have shown a negative impact of population growth on TFP in developed countries. TFP is affected negatively from the increased dependency ratio of family members to total labour supply, savings, and consumption (Tang and MacLeod, 2006). Pritchett (1999) explains that rapid population growth reduces human capital and causes natural resource depletion. Also, rapid population growth is associated with a slower growth rate of labour force participation in a study conducted by Ursavaš (2020). Kögel (2005) asserts that the youth dependency ratio adversely impacts TFP, which suggests that the fall in productivity per person as the population grows is mainly due to the differences in workforce participation.
Given the importance of financial development and the dependency of Gulf Cooperation Council Countries (GCC) on their natural resources, the present study estimates the impacts of these two variables on total factor productivity (TFP) in the Kingdom of Saudi Arabia (KSA), United Arab Emirates (UAE), Kuwait, and Qatar. To our knowledge, no study has been conducted to estimate the combined impacts of financial development and resource rents on TFP in GCC countries. This study takes the lead and uses the GMM approach. The results indicate that resource rents (RR) and financial development (FD) have positive and significant relationships with the TFP. The control variables in this study are corruption, trade openness, and population.
The present study is organized as follows: section 2 explains the research method and data. Then, section 3 states the results and discussion and section 4 presents the conclusion and policy recommendations.
## II. RESEARCH METHOD
In this study, we estimate the impacts of specific financial development and resource rents on total factor productivity, the Generalized Method of Moments (GMM) is used. The study regression model is
$$
\begin{array}{l} \ln T F P _ {i t} = \beta_ {0} + \beta_ {1} F D _ {i t} + \beta_ {2} R R _ {i t} + \beta_ {3} C o r r _ {i t} + \beta_ {4} P o p _ {i t} + \\\beta_ {5} \operatorname{Trad} + \mu_ {i t} \dots (1) \\\end{array}
$$
Total factor productivity (TFP) is taken as a dependent variable. The variable FD represents the financial development, whereas the variable RR is the resource rents. The Corr shows the Corruption. Pop represents the population and Trad represents the trade openness.
The balanced panel data estimates the impact of financial development on total factor productivity. The GMM technique has proved to be better when dealing with endogeneity (Ullah et al., 2018). The GMM is one of the most widely used methods for estimation in economics. The dataset ranges from 1984 to 2018 and covers four Gulf Countries. The total factor productivity has proved to be an essential tool for comparing the development across countries. The detail of variable description and the data source is provided in table 1.
Table 1: Summary of variables, descriptions and data sources
<table><tr><td>Classification</td><td>Variable name</td><td>Description</td><td>Data source</td></tr><tr><td>Dependent Variable</td><td>Total Factor Productivity</td><td>TFP level at current PPPs (USA=1)</td><td>Penn World Table 10.0
https://www.rug.nl/ggdc/productivity/pwt/?lang=en</td></tr><tr><td rowspan="5">Independent variables</td><td>Natural Resources Rents (% GDP)</td><td>Total natural resources rents are the sum of oil rents, natural gas rents, coal rents (hard and soft), mineral rents and forest rents.</td><td>World Development Indicator, World Bank https://databank.worldbank.org/source/world-development-indicators#</td></tr><tr><td>Financial Development Index</td><td>It measures and analyses different factors that enable the development of financial systems among different economies</td><td>IFS -International Financial Statistics
https://data.imf.org/?sk=F8032E80-B36C-43B1-AC26-493C5B1CD33B</td></tr><tr><td>Population</td><td>Total Population</td><td>World Development Indicators, World Bank https://databank.worldbank.org/source/world-development-indicators#</td></tr><tr><td>Trade Openness</td><td>(Imports + Exports)/GDP</td><td>World Development Indicators, World Bank https://databank.worldbank.org/source/world-development-indicators#</td></tr><tr><td>Corruption</td><td>The inverse of Control in Corruption index</td><td>ICRG- International Country Risk Guide
https://www.prsgroup.com/explore-our-products/icrg/</td></tr></table>
Figure (1) below shows the TFP in the selected four Gulf countries. The TFP of UAE faces fewer fluctuations than other countries over the period mentioned. TFP in UAE is high on average among the other countries, but there is a decrease in 2018 compared with the 1984 value. As in 1984, the TFP of UAE was 1.28 and 0.98 in 2018, showing a sharp reduction over the period. The TFP is high in Qatar, followed by KSA and UAE, but it also faced a sharp decrease, as it was 1.13 in 1984 and 0.51 in 2018. The TFP of Kuwait faced sharp fluctuations, mainly in the war period of 1991 when TFP reached its minimum level. Another massive reduction in the TFP of Kuwait was from 0.96 in 1984 to 0.61 in 2018. KSA's TFP was 0.86 in 1984 and 0.63 in 2018. Moreover, Qatar faced a huge reduction in TFP in the studied period; it was 1.13 in 1984 and 0.51 in 2018.
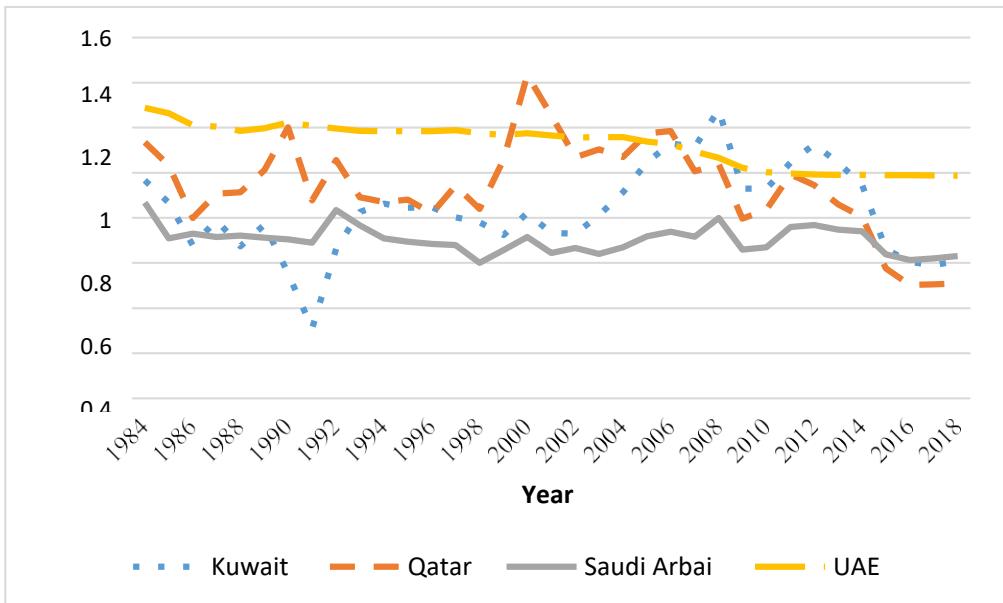 Figure 1: Total factor productivity trend in the selected Gulf Countries from 1984-2018
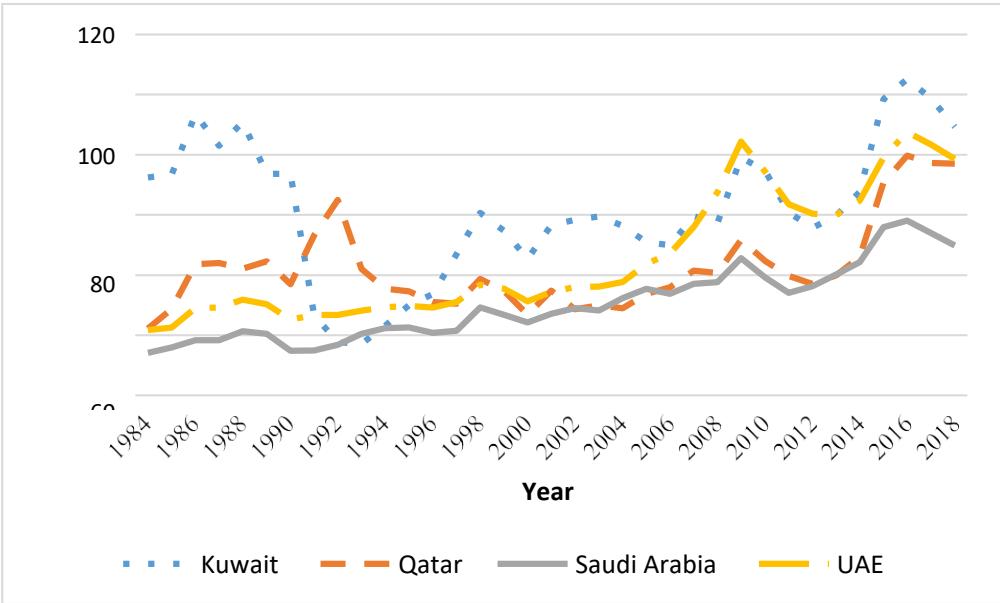
Moreover, figure (2) below shows the trend of financial development (FD) in GC, which is approximately similar to TFP. Financial development in UAE faced a considerable rise over the studied period, with a maximum value of 84.4 in 2009 and 21.75 in 1984. The financial development of Kuwait remained high during the period among other countries; however, its trend showed sharp fluctuations. The lowest level of
FD in Kuwait was 17.16 in 1993, which was post-war, while the highest level was in 2016 compared to the other countries. FD in Kuwait was 72.43 in 1984 and 89.32 in 2018. The trend of FD in Qatar shows an average level among other countries; it was 28.77 in 1984 and 77.06 in 2018. KSA's financial development trend increased over the period. It was 14.14 in 1984 and 49.83 in 2018.
 Figure 2: Financial development in the selected Gulf Countries from 1984-2018
Furthermore, figure (3) shows that the trend of resource rents had sharp fluctuations in approximately all the studied countries over the period from 1984 through 2018, where the lowest level was for UAE and the highest level was for Kuwait except in 1991. Kuwait's resource rents were 45.42 in 1984 and 42.13 in 2018.
KSA and Qatar's trends show similarities except for some years. Qatar's resource rents showed a considerable decrease over the period, as it was 50.69 in 1984 and 20.54 in 2018. The resource rents of KSA were 34.63 in 1984 and 27.48 in 2018. The resource rents of the UAE were 23.38 in 1984 and 16.03 in 2018.
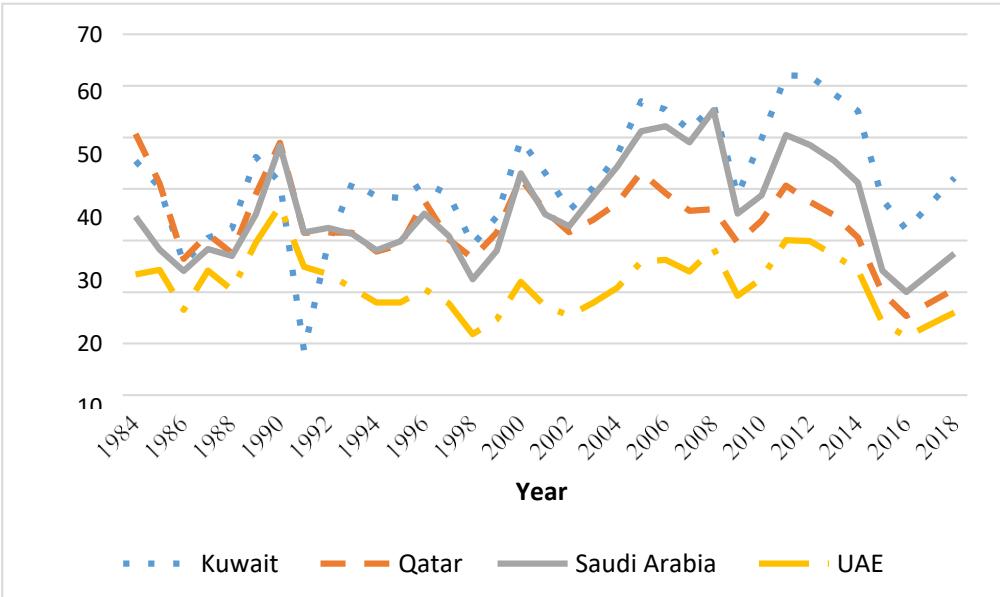 Figure 3: Resource rents in the selected Gulf Countries from 1984-2018
Table 2: Descriptive analysis of the selected Gulf Countries
<table><tr><td colspan="7">Kuwait</td></tr><tr><td></td><td>Corr.</td><td>OP</td><td>FD</td><td>RR</td><td>POP.</td><td>TFP</td></tr><tr><td>Mean</td><td>2.757143</td><td>0.724438</td><td>61.56415</td><td>42.09988</td><td>2452364</td><td>0.829986</td></tr><tr><td>StDev.</td><td>0.384079</td><td>0.069521</td><td>23.06325</td><td>11.26677</td><td>777370.3</td><td>0.196157</td></tr><tr><td>Min.</td><td>2</td><td>0.531303</td><td>17.1625</td><td>8.682839</td><td>1605901</td><td>0.309721</td></tr><tr><td>Max.</td><td>3</td><td>0.853516</td><td>105.1868</td><td>62.04703</td><td>4137309</td><td>1.2801</td></tr><tr><td colspan="7">Qatar</td></tr><tr><td></td><td>Corr.</td><td>OP</td><td>FD</td><td>RR</td><td>POP.</td><td>TFP</td></tr><tr><td>Mean</td><td>2.469048</td><td>0.749343</td><td>42.69671</td><td>33.09315</td><td>1105440</td><td>0.94054</td></tr><tr><td>StDev.</td><td>0.705396</td><td>0.090446</td><td>14.76614</td><td>7.858425</td><td>837844.6</td><td>0.209804</td></tr><tr><td>Min.</td><td>2</td><td>0.575835</td><td>22.28938</td><td>15.35258</td><td>341272</td><td>0.503247</td></tr><tr><td>Max.</td><td>4</td><td>0.876443</td><td>79.76061</td><td>50.69461</td><td>2781677</td><td>1.433439</td></tr><tr><td colspan="7">KSA</td></tr><tr><td></td><td>Corr.</td><td>OP</td><td>FD</td><td>RR</td><td>POP.</td><td>TFP</td></tr><tr><td>Mean</td><td>2.307143</td><td>0.597228</td><td>30.3158</td><td>35.80453</td><td>22282595</td><td>0.70435</td></tr><tr><td>StDev.</td><td>0.442587</td><td>0.099529</td><td>12.38768</td><td>9.709807</td><td>6227311</td><td>0.060082</td></tr><tr><td>Min.</td><td>2</td><td>0.451887</td><td>14.14612</td><td>20.03072</td><td>12418834</td><td>0.601326</td></tr><tr><td>Max.</td><td>3.333333</td><td>0.824545</td><td>58.11449</td><td>55.31184</td><td>33699947</td><td>0.868255</td></tr><tr><td colspan="7">UAE</td></tr><tr><td></td><td>Corr.</td><td>OP</td><td>FD</td><td>RR</td><td>POP.</td><td>TFP</td></tr><tr><td>Mean</td><td>2.686905</td><td>1.039749</td><td>45.45394</td><td>21.46763</td><td>4692465</td><td>1.126676</td></tr><tr><td>StDev.</td><td>0.740984</td><td>0.371433</td><td>20.79456</td><td>5.790963</td><td>3096863</td><td>0.093216</td></tr><tr><td>Min.</td><td>2</td><td>0.502657</td><td>21.7559</td><td>11.3467</td><td>1293971</td><td>0.986672</td></tr><tr><td>Max.</td><td>4</td><td>1.65286</td><td>87.60196</td><td>36.70007</td><td>9630959</td><td>1.288048</td></tr></table>
The descriptive statistics of the studied GCC countries are shown in Table 2 concerning variables. Kuwait shows an increased average of corruption control among the other countries by 2.75, followed by UAE, Qatar and KSA, respectively, which shows that Kuwait has strict regulations to control corruption. Also, the average rate of resource rents is high in Kuwait in compared to the other GC. The average rate of trade openness is high in UAE, which explains the high levels of its financial development, though Kuwait showed a higher level of FD. Then, UAE offers another high level of TFP that could result from its high trade openness. UAE also indicates a higher value of SD for corruption and trade openness, while Kuwait offers a higher value of SD of financial development, followed by UAE. Resource rents show high variations in Kuwait, but TFP shows high variations in Qatar among the other GC. The minimum level of corruption is the same for all the studied countries, while the maximum level is high in UAE. The trade openness of UAE is the maximum, while the minimum trade openness is in KSA. Financial development shows a maximum value in Kuwait, followed by UAE. Resource rents offer a maximum value in Kuwait, followed by KSA. The maximum value of TFP is presented in Qatar compared to the GC.
## III. RESULTS AND DISCUSSION
The results of GMM estimation are presented in Table 3. The present study takes the financial development (FD), resource rents (RR), corruption (CORR), trade openness (OP) and population (POP) as independent variables. The RR and FD indicate a positive and significant relationship with TFP. The coefficient value is 0.47 and 0.43, showing that a one percent increase in RR and FD causes an increase in TFP by 0.47 and 0.43 percent, respectively. The results of FD and its association with productivity are aligned with the previous studies, e.g., Guillaumeont et al., (2006) and Wang (2021), who find that FD enhances TFP and growth in China. Bist (2018) considers that FD increases the level of productivity and the standards of living of the general populace in the African regions. Also, the resource rents' results align with recent studies conducted by Aljarallah (2020a, 2020b). The coefficient of log of CORR shows a significant negative association with TFP. The coefficient value is 0.26, indicating that a one percent increase in CORR decreases TFP by 0.27 percent. These results support the findings of Teoman et al., (2020). The OP affects significantly and positively the
TFP by 0.47 percent. Then, TFP is affected negatively by the POP.
A one percent increase in POP causes TFP to increase by 0.07 percent in GC. The present study uses the lag of RR and FD as instrumental variables to control endogeneity. The validity of the instrument's variable is checked through J- statistics and the probability of J-statistics is greater than 0.10, which means that the instruments are valid.
Table 3: Empirical Results
<table><tr><td>Variable</td><td>Coefficient</td><td>t-statistics</td></tr><tr><td>LOG(FDI)</td><td>0.435572**</td><td>2.860901</td></tr><tr><td>LOG(RR)</td><td>0.475844**</td><td>2.848990</td></tr><tr><td>LOG(CORR)</td><td>-0.268862**</td><td>-3.076152</td></tr><tr><td>LOG(OP)</td><td>0.478889***</td><td>6.594613</td></tr><tr><td>LOG(POP)</td><td>-0.073763***</td><td>-4.728558</td></tr><tr><td>C</td><td>1.34890***</td><td>5.70620</td></tr><tr><td>R-squared</td><td>0.305666</td><td></td></tr><tr><td>Prob(J-statistic)</td><td>0.26577</td><td></td></tr></table>
## IV. CONCLUSION
The present study estimates the impact of financial development and resource rents on total factor productivity in Gulf Cooperation Council countries. We used the panel data from 1984 to 2019 and applied the GMM approach. The variables of population, corruption and trade openness were used as control variables. The results indicate that financial development and resource rents positively affect total factor productivity in Gulf countries. Moreover, the results show that increasing trade openness contributes positively to total factor productivity. However, corruption and population negatively affect productivity.
The results are particularly significant for the governments in resource-rich nations that intend to manage the enormous earnings from natural resources sustainably. This research proves that when resource earnings are managed appropriately, TFP could be enhanced. Moreover, bettering the state of law and order, reducing corruption, and improving the institutional environment are urgent needs that must coexist with any aspirations for further development. Additional efforts must be applied to identify effective ways to raise institutional quality at the national level, ensuring long-term growth and development.
The impacts of natural resource dependency on economic growth are by no means comprehensive and universal. The wealth of natural resources can impact growth positively or negatively as noticed in the theoretical analysis and the statistical verification. There are several factors that determine growth across countries, and they are correlated in multi-dimensional ways, which creates an entirely different case in every country. Thus, it is important to highlight these factors when considering the challenges of resource dependency.
Therefore, this research recommends financial reforms and developments that should consider the importance of money, maximize the investment choices of key market participants, and regulate the rational use of resources. Second, it is suggested that policies such as interest rate policy, exchange rate policy and market pricing policy should be better aligned to improve the ability of financial institutions. Third, the banking industry should lower the entrance requirements to accommodate the multiple demands for financial resources made by multiple financial authorities. Fourth, the capital market's structural efficiency and financial systems' standardization should be improved to increase the availability of finance for businesses involved in technological innovation. All things considered, the governments should understand the regional mismatch between TFP growth and economic growth due to an imbalanced regional financial development.
Generating HTML Viewer...
References
44 Cites in Article
Philippe Aghion,Matias Braun,Johannes Fedderke (2008). Competition and productivity growth in South Africa.
Ruba Aljarallah (2020). Natural resource dependency, institutional quality and human capital development in Gulf Countries.
Ruba Aljarallah,Andrew Angus (2020). Dilemma of Natural Resource Abundance: A Case Study of Kuwait.
Ruba Aljarallah (2021). An assessment of the economic impact of natural resource rents in kingdom of Saudi Arabia.
E Al-Hussainy,T Beck,A Demirguc-Kunt,B Zia (2008). Household use of financial services.
R Aqeel,M Zahid,M Ejaz (2022). Corruption and Economic Development: A Comparative Analysis with Evidence from the Extended Solow Growth Model.
Giles Atkinson,Kirk Hamilton (2003). Savings, Growth and the Resource Curse Hypothesis.
Jagadish Bist,Robert Read (2018). Financial development and economic growth: Evidence from a panel of 16 African and non-African low-income countries.
E Boserup (1987). Population and technology in preindustrial Europe.
Firat Demir,Chenghao Hu,Junyi Liu,Hewei Shen (2022). Local corruption, total factor productivity and firm heterogeneity: Empirical evidence from Chinese manufacturing firms.
Ratbek Dzhumashev (2014). Corruption and growth: The role of governance, public spending, and economic development.
K Ehigiamusoe,M Samsurijan (2021). What matters for finance-growth nexus? A critical survey of macroeconomic stability, institutions, financial and economic development.
J Frankel,D Romer (1999). Does trade cause growth?.
O Gloede,O Rungruxsirivorn (2013). Local financial development and household welfare: Microevidence from Thai households.
Guillaumont Jeanneney,S Hua,P Liang,Z (2006). Financial development, economic efficiency, and productivity growth: Evidence from China.
Shahadat Hosan,Shamal Karmaker,Md Rahman,Andrew Chapman,Bidyut Saha (2022). Dynamic links among the demographic dividend, digitalization, energy intensity and sustainable economic growth: Empirical evidence from emerging economies.
A Isaksson (2007). Determinants of total factor productivity: a literature review.
Peter Kaznacheev (2013). Resource Rents and Economic Growth. Economic and Institutional Development in Countries with a High Share of Income from the Sale of Natural Resources. Analysis and Recommendations Based on International Experience..
K Keita (1714). Does Corruption affect total factor productivity? An empirical analysis.
Kouramoudou Kéïta,Hannu Laurila (2021). Corruption and Tax Burden: What Is the Joint Effect on Total Factor Productivity?.
Stephan Klasen,Thorsten Nestmann (2006). Population, population density and technological change.
T Kögel (2005). Youth dependency and total factor productivity.
Ross Levine (1997). Financial Development and Economic Growth: Views and Agenda.
Tinghui Li,Gaoke Liao (2020). The Heterogeneous Impact of Financial Development on Green Total Factor Productivity.
S Majeed,Q Ahmed,M Butt (2010). Trade liberalization and total factor productivity growth (1971-2007).
S Miller,M Upadhyay (2000). The effects of openness, trade orientation, and human capital on total factor productivity.
Gary Murphy (2000). A culture of sleaze: Political corruption and the Irish body politic 1997–2000.
G Myrdal (1969). The Soft States of South Asia: The Civil Servant Problem.
Lant Pritchett (1999). Population Growth, Factor Accumulation, and Productivity.
Dani Rodrik (1988). Closing the Technology Gap: Does Trade Liberalization Really Help?.
E Stein,J Weiler,R Plender,R Goebel,P Brückner,A Haagsma (1989). Can WTO Law Keep Up with the Internet?.
Mushfiq Swaleheen (2011). Economic growth with endogenous corruption: an empirical study.
Jianmin Tang,Carolyn Macleod (2006). Labour force ageing and productivity performance in Canada.
Rameez Tariq,Muhammad Khan,Abdul Rahman (2020). How Does Financial Development Impact Economic Growth in Pakistan?: New Evidence from Threshold Model.
E Tebaldi (2016). THE DYNAMICS OF TOTAL FACTOR PRODUCTIVITY AND 37.
O Teoman,O Dincer,T Cavusoglu (2020). Corruption and Total Factor Productivity in the Long-Run: Evidence from Post-WW2 Turkey.
Subhan Ullah,Pervaiz Akhtar,Ghasem Zaefarian (2018). Dealing with endogeneity bias: The generalized method of moments (GMM) for panel data.
V Ulusoy,C &taş (2017). On the effects of total productivity growth of economic freedom and total resource rents: The case of both natural resource rich and OECD countries.
Uğur Ursavaş (2020). Toplam Faktör Verimliliği Artışı ve Demografi: Türkiye Örneği.
Shuhong Wang,Binbin Lu,Kedong Yin (2021). Financial development, productivity, and high-quality development of the marine economy.
Zumian Xiao,Hongfeng Peng,Zheyao Pan (2022). Innovation, external technological environment and the total factor productivity of enterprises.
Z Xu,S Pal (2011). Financial development and total factor productivity: Evidence from India's manufacturing sector.
Syed Zaidi,Muhammad Zafar,Muhammad Shahbaz,Fujun Hou (2019). Dynamic linkages between globalization, financial development and carbon emissions: Evidence from Asia Pacific Economic Cooperation countries.
No ethics committee approval was required for this article type.
Data Availability
Not applicable for this article.
How to Cite This Article
Ruba A. Al-Jarallah. 2026. \u201cImpact of Financial Development and Resource Rents on Total Factor Productivity in Gulf Cooperation Council Countries\u201d. Global Journal of Management and Business Research - B: Economic & Commerce GJMBR-B Volume 22 (GJMBR Volume 22 Issue B5).
Explore published articles in an immersive Augmented Reality environment. Our platform converts research papers into interactive 3D books, allowing readers to view and interact with content using AR and VR compatible devices.
Your published article is automatically converted into a realistic 3D book. Flip through pages and read research papers in a more engaging and interactive format.
Our website is actively being updated, and changes may occur frequently. Please clear your browser cache if needed. For feedback or error reporting, please email [email protected]
Thank you for connecting with us. We will respond to you shortly.