
Introduction
Infrastructure is one of the structural constraints that affect market functionality and market access of rural farmers (Ezeudu & Obimbua, 2024). Despite the central importance of infrastructure in national development, investment in infrastructure in Nigeria is low (World Economic Forum [WEF], 2025). This low level of infrastructure investment portends negative implications for the agriculture sector, which is characterized by many smallholder farmers, many of whom are women, low productivity, poor market access, underdeveloped value chains, and inadequate or non-existent infrastructure (Ezeudu & Obimbua, 2024). Road infrastructure comprises roads and a variety of structures, such as bridges, culverts, drainage systems, that enable the transportation of people, goods, and services, connecting communities, and with a potential to catalyse growth and development required for improved welfare of citizens (Dumas and Játiva, 2025; Ezeudu & Obimbua, 2024; Mtweve et al.,2025; Udoinyang, 2025). It is particularly critical to agriculture, which is the major income source in Nigeria’s rural areas, making access to markets, extension and other services available(Isah & Ogundele, 2025; Yusuf et al., 2024). The appalling state of roads hinders effective agricultural development through high transportation cost, delays and consequently postharvest losses (Aboyeji & Aguda, 2024), impacting productivity and market access, especially for women who already face constraints at various points of the food system. It is believed that access to markets would enhance women’s productivity, produce price and quality, incomes, food security, and reduction of poverty and hunger (World Bank, 2022; Ojo & Baiyegunhi, 2023). However, a topical issue of discussion is the poor condition or complete absence of rural road infrastructure further exacerbating women’s inability to access markets and worsens their economic empowerment. which in turn impacts on the nutrition of their households (Ngomane, 2024; Odei et al., 2023).
Available statistics on nutrition in Nigeria reveal a worrisome situation. Between 2013 and 2018, women’s nutrition worsened in terms of the burden of thinness from 11 to , and obesity from 25 to (FAO et al., 2025). This nutrition crisis disproportionately affects the Northern regions compared to the Southern zone, due to conflict and other crises such as drought, security challenges, and economic crunches (OCHA, 2024). Furthermore, almost one out of every 10 Nigerian children are wasted, while almost of children less than five years old are stunted and are under-weight (Awosan et al., 2024; USAID, 2022), with and of the burden of stunted children in urban and rural areas, respectively. The prevailing nutrition situation thus makes Nigeria’s chances of attaining the Sustainable Development Goals (SDGs) slimmer, with current progress pegging the country at 159th out of 162 countries (Aderogba & Aderogba, 2025).
Given that infrastructure fosters holistic growth and maximizes positive impacts on welfare, market participation, and livelihood outcomes across developing economies (Abdullahi & Sieng, 2023), empirical evidence on the impact of road infrastructure programmes on households’ nutrition and women’s economic empowerment outcomes remains limited. Households in Nepal experienced and increase in food and non-food purchases from the market following road improvements (Koirala, 2023), while household consumption in Ethiopia, increased by in previously isolated communities, decreasing the probability of falling into poverty by (OPEC Fund for International Development, 2024). Existing evidence in Nigeria have primarily focused on the effects of road infrastructure on income, transportation costs, and market access. For instance, Yusuf et al. (2024), using the Autoregressive Distributed Lag (ARDL) model, found a positive correlation between rural road improvements and household income arising from reduction in transportation costs and enhanced market access. Similarly, Ugwu et al. (2025) showed that poor road infrastructure increases market costs making barriers to market access, thus reducing agricultural market efficiency in Karu Local Government Area of Nasarawa State, Nigeria. However, these studies are limited in important ways. First, they largely overlook nutrition related outcomes, particularly dietary diversity at both household and individual levels. Second, they do not explicitly consider the multidimensional nature of women’s empowerment, including aspects such as income use, decision making, access to resources and workload. Furthermore, past evaluation of the VCDP such as Omotoso and Obi-Egbedi (2025) only assessed its impact on poverty incidence of rural households, without linking the road investment component of the intervention to nutrition and gender equality outcomes.
The foregoing reveals that the impacts of road infrastructure intervention on women empowerment and nutrition are not clear-cut in the literature. It therefore becomes imperative to investigate a gender-inclusive and nutrition-sensitive approach in the planning and management of infrastructure delivery and development. This could help to improve women’s economic empowerment and nutritional outcomes. On the other hand, restricting women’s empowerment opportunities and outcomes holds economies back from experiencing growth and prosperity (Das, 2025). Thus, this study employed the Value Chain Development Programme (VCDP) dataset from 2019 to 2022, to examine the impact of road infrastructure on women empowerment and household nutrition among rural communities in Nigeria using the Difference-in-Difference (DiD) model.
The rest of the paper is structured as follows. The immediate section provides a brief background on value chain development programme in Nigeria, which is then followed by a conceptual framework and methodology sections. The results of the analysis and discussions are presented in the penultimate section while the last section concludes the paper by presenting recommendations on ways to enhance rural road infrastructure development in Nigeria.
Conceptual framework
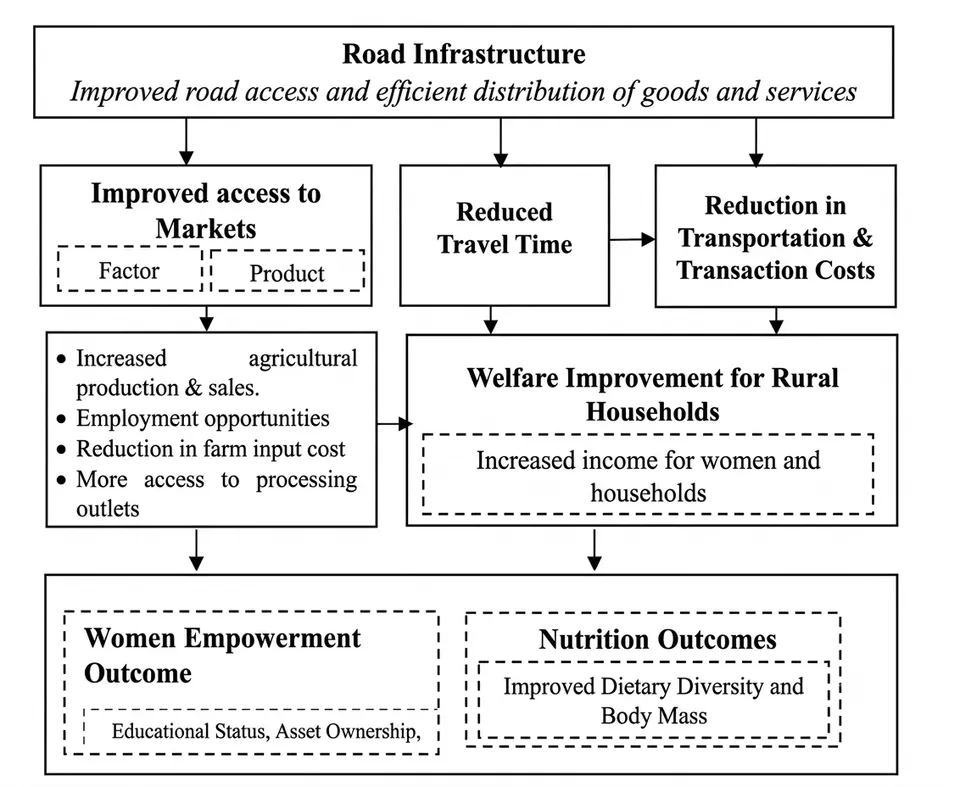
Conceptually, the mechanisms and pathways by which a road infrastructure intervention(including activities during the construction) may positively impact women’s economic empowerment and household nutrition are shown in Figure 1, with three possible pathways to improved nutrition and increase women empowerment considered. First, improved road infrastructure results in greater accessibility to both factor and product markets (Alao, 2021; Eissler & Heckert, 2024; Xu et al., 2024). Road infrastructure also expands employment opportunities for rural women, particularly during construction where trading activities are initiated along the road corridor, which ultimately increases the income of rural women (Osunmakinde et al., 2022; Das, 2025). Second, rural roads improve the speed and ease of travel, which ultimately saves time, creating more avenues for investment in productive activities, and enhancing effective distribution of farm produce from production areas to market and processing outlets, thereby reducing postharvest losses, especially for perishable crops (Ngezahayo et al., 2019; Stephen., 2024). Third, increased volume of private transport and competition, invariably reduces transportation and transaction costs (Biber-Freudenberger et al., 2025). Therefore, the savings in transportation costs and travel time will positively impact the income-earning potentials of rural households and women. Improvement in women’s income generating capacity has been identified as an important contributor to their economic empowerment (Gupta et al., 2019; FAO, 2024). Women’s economic empowerment, in turn, contributes directly not only to improvements in women’s nutritional status but also to that of their household members (Etea et al., 2023; Adeyanju and Fadupin, 2023).
Methodology
Data and source
The study utilized secondary data from the baseline and result-level monitoring surveys of the Value Chain Development Project (VCDP) conducted in nine states (Kogi, Benue, Niger, Nasarawa, Taraba, Anambra, Ebonyi, Enugu and Ogun) in Nigeria which were the pilot states for the project. A rapid qualitative assessment was also conducted in six out of the nine states (Ogun, Ebonyi, Anambra, Benue, Niger and Taraba) of the VCDP programme in order to validate the data from secondary sources. This represents four out of the six geopolitical zones of the country. The surveys were conducted across 2019 and 2022. The 2019 survey served as the baseline data while the 2022 survey was the post-intervention dataset.
Measurements of outcome variable and empirical model
Women’s empowerment
The study measured women empowerment using the Abbreviated Women Empowerment in Agriculture Index (AWEAI), an abridged version of the Women Economic Empowerment in Agriculture (WEAI). The VCDP data set contains all the sub-indicators included in the measurement of the AWEAI, but not for other versions which include additional modules and data not available in the dataset. Like WEAI, AWEAI retains all the domains of empowerment but only employs 6 out of the 10 indicators (Nacka et al., 2024). The index was computed using two subindexes: the 5 Domains of Empowerment (5DE) and the Gender Parity Index (GPI). According to Obayelu et al. (2024), the 5DE score shows how much women are empowered within the five domains of empowerment which are, input in agricultural production decisions; access and decision-making power over productive resources; control over the use of income; leadership in the community; and time allocation. The GPI measures women empowerment relative to that of men through the comparison of the 5DE profiles of women and men who are considered primary decision-makers in each household.
Household and women’s nutrition status
Household nutrition and women’s nutrition status were evaluated using their dietary quality intake. The household dietary diversity score (HDDS) and minimum dietary diversity score for women (MDDW) were computed to measure the diet quality for households and women, respectively. Household dietary diversity score was adopted as a proxy for household nutrition outcomes and assessed on a scale of 1-12 as the number of food groups consumed by a household. The 12 food groups considered based on FAO’s recommendation include cereals, vegetables, fruits, meat, egg, fish, and other sea products, nuts and seeds, legumes, milk and milk products, oil and fats, sweets, spices, beverages, and condiments, and roots and tubers (del Valle et al., 2024).
Mean household dietary diversity score was determined and household dietary diversity was categorized as low food groups), medium (4-5 food groups), and high dietary diversity food groups) following Ouedraogo et al. (2024). In addition, the MDDW, which measures the dietary diversity of female household members, was computed using a score of five or more out of ten recommended food groups as a representation of the MDDW met.
Difference-in-difference with propensity score matching (DID-PSM) method
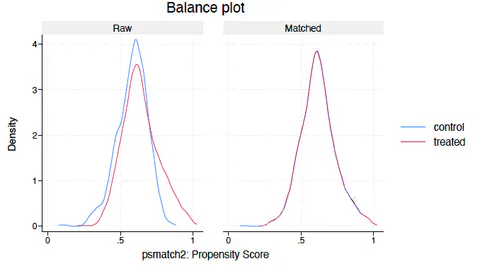
The DID estimated the impact of the VCDP road infrastructure as the average changes in outcomes among beneficiary and non-beneficiary households before (pre-intervention) and after (post-intervention) the facilities were provided.Hence, it is assumed that for the intervention, the level of economic empowerment and nutrition among the households would be the same. However, certain heterogeneity may exist among the households pre intervention (Hu & Wang, 2023). Since we acknowledge that this initial heterogeneity may bias the impact estimates, we use PSM to ensure balance in the initial conditions between beneficiary and the non-beneficiary groups in the 2019 baseline data (Günther et al., 2025). This ensures, as opined by Peersman (2014) and Capacci et al. (2022), that the essential condition in impact evaluation is that the characteristics of the control and the treatment groups are similar except that one is treated. Hence, the outcomes of interest observed after intervention are attributable and measured as the impacts of benefitting in the VCDP road infrastructure. While road infrastructures were provided at the community level, the impacts of these facilities are expected to reflect in the outcomes of economic activities and nutrition of households within the benefitting communities. Hence, our analyses were conducted at the household level. In Figure 2, all the regions of matching overlaps show that the distribution of the observed covariates is balanced and there is effective matching for the treatment (beneficiary households) and control (non-beneficiary households) groups.
Once the balance between the beneficiary and non-beneficiary households was established using the 2019 baseline data, the impact of the road infrastructure development component of the VCDP on the empowerment of rural women, their nutrition and that of the households was measured using the Difference-in-Difference (DiD) method. There are three parameter estimates that are mostly used in identifying the average impact of any policy intervention (Blundell & Costa-Dias, 2009; Dong et al., 2023; Wang et al., 2024). With respect to the assumptions needed to make an inference, the parameters include: the overall population average treatment effect (ATE) which measures the average outcome if study participants were assigned to treatment randomly; the average treatment effect on the treated (ATT) that measures the average effect on those that were exposed to treatment; and the average effect on non-participants (ATNT). For the DiD, the parameter of interest is that which identifies the impact of exposure to treatment on individuals that were assigned to treatment denoted as ATT. For this study, the empirical DiD methodology adopted following Chen and Pan (2019) and Wang et al. (2024) is given as:
Where represents household/individual , 1 denoting year which is the base period and follow-up period, respectively. The denotes the outcome variables which in the case of nutrition includes the dietary diversity index of households (HDDS) and women (MDD-W), while for women empowerment, it is the empowerment index generated for each woman. The P is a dummy variable, equal to 1 for a household/individual in 2022 (after the introduction of the project) and 0 otherwise. The T is a dummy variable, equal to 1 if a household/individual is resident in areas where road construction or rehabilitation took place, and 0 otherwise. The X is a vector of control variables, including sex of household head, level of education attained, cultivated farm size (ha), geo-political zone of residence, proportion of farm income to total household income, total household income, access to extension services, access to credit, and asset ownership index. The is the random unobserved error term which contains all unobserved variables omitted in the model, is the constant term, represents changes in the outcome before and after the intervention (i.e., pre- and post-intervention), is the treatment group specific effect gamma. The coefficient of interest is the interaction term which measures the true effect of the intervention or treatment and measures the change of outcome variable in covariates in household and year t.
To account for the length (kilometers) of roads rehabilitated and constructed as well as the number of bridges constructed in the VCDP study sites, the model was further expanded. This was needed as new variables introduced helped to further ascertain the relevance of the intervention as a treatment that brings nutrition and gender benefits. The two new variables jointly interacted with the area of residence vector (T) of households, while the coefficient of interest associated with this interaction measures the true effect of the intervention based on kilometers of roads and bridges (in numbers) constructed and rehabilitated. Given that the variables in equation (2) remain the same as in equation (1), the expanded estimated DiD model, is specified as:
Where R is the roads constructed and rehabilitated in kilometers, and is the number of bridges constructed. The coefficients and represent the direct effects of roads and bridges respectively on welfare outcomes.
Results and discussion
Descriptive statistics of respondents
Table 1 presents descriptive statistics for key socio-economic variables of beneficiary, and non-beneficiaries as well as the pooled sample households of VCDP road interventions. Most beneficiary and non-beneficiary households were male headed. The result substantiates the position of Bello et al. (2021) and Alawode et al. (2025) that males dominate the agrarian sector of Nigeria. The average age of the beneficiary and non-beneficiary households was about 45 and 43 years. More VCDP beneficiary households than non-beneficiaries had access to extension services, while households that cultivated at most 5ha were in majority as about of beneficiaries, and average farm size of beneficiaries was significantly higher than that of the non-beneficiaries by 0.70ha. This agrees with Anderson et al. (2017), Oluwatunsin and Sekunmade (2016) and Obi-Egbedi and Lijadu (2024) that smallholders farming households cultivated average farm size between 1-3ha. Household heads who had up to tertiary education were about and among beneficiary and non-beneficiary households, respectively.
Access to financial credit was higher among beneficiaries than the non-beneficiaries versus , likely attributed to the availability of basic rural infrastructure including the road infrastructure driving availability and access to financial institutions (Nwude & Anyalechi, 2018). Furthermore, while the average farm income for beneficiary (N 366,439.4) was significantly higher than that of the non- beneficiary (N 314,569.8) by N 51,869.64, the average non-farm income (N 182,649.4) for beneficiary was similarly significantly higher than that of the non-beneficiary by N 31,279.4. This aligns with Purwanto (2020) and Yuan and Wang (2024) who found that infrastructure provides a boost for rural household income through enhanced nonfarming activities.
| Variables | Beneficiary (n = 844) | Non-beneficiary (n = 450) | Pooled (n = 1294) | Mean difference |
|---|---|---|---|---|
| Gender | ||||
| Male | 508 (60.19) | 274 (60.89) | 782 (60.43) | |
| Female | 336 (39.81) | 176 (39.11) | 512 (39.57) | |
| Age (years) | ||||
| 145 (17.18) | 100 (22.22) | 245 (18.93) | ||
| 36–55 | 666 (78.91) | 339 (75.33) | 1,005 (77.60) | |
| 33 (3.9) | 11 (2.44) | 44 (3.40) | ||
| Mean SD | 44.68 9.45 | 43.00 9.72 | 44.10 9.57 | 1.68*** |
| Marital status | ||||
| Single | 24 (2.84) | 28 (6.22) | 52 (4.02) | |
| Married | 766 (90.76) | 394 (87.56) | 1160 (89.64) | |
| Others | 54 (6.40) | 28 (6.22) | 82 (6.33) | |
| Household size | ||||
| 177 (20.97) | 85 (18.89) | 262 (20.25) | ||
| 6–10 | 632 (74.88) | 346 (76.89) | 978 (75.58) | |
| 35 (4.15) | 19 (4.22) | 54 (4.17) | ||
| Mean SD | 7.30 0.07 | 7.49 0.10 | 7.36 0.05 | |
| Education Level | ||||
| Primary | 183 (21.68) | 63 (14.00) | 236 (18.24) | |
| Secondary | 256 (30.33) | 152 (37.78) | 384 (29.68) | |
| Tertiary | 405 (47.99) | 241 (53.56) | 674 (50.00) | |
| Access to credit | ||||
| Yes | 405 (47.99) | 164 (36.44) | 569 (43.97) | |
| No | 439 (52.01) | 286 (63.56) | 725 (56.03) | |
| Mean SD (Amount, N) | 77,041 187,987 | 64,003 101,756 | 72,507 163,323 | 13,037** |
| Extension services | ||||
| Access (Yes) | 520 (61.61) | 190 (42.22) | 710 (54.87) | |
| No Access | 324 (38.39) | 260 (57.78) | 584 (45.13) | |
| Farm size (ha) | ||||
| 702 (83.18) | 450 (100) | 1,152 (89.03) | ||
| –10.00 | 123 (14.57) | – | 123 (9.51) | |
| 19 (2.25) | – | 19 (1.47) | ||
| Mean SD | 2.94 2.13 | 2.24 0.96 | 2.69 1.84 | 0.70*** |
| Total Income (N) | ||||
| Total Household | 546,088 360,000 | 465,939 345,059 | 520,173 356,947 | 83,149*** |
| Non-farm | 182,649 238,925 | 151,370 186,599 | 171,771 222,556 | 31,279*** |
| Farm | 366,439 229,598 | 314,569 244,531 | 348,401 236,102 | 51,869*** |
Table 1: Socio-economic Characteristics for Pooled VCDP Beneficiary and Non-beneficiary Households
*, ** and *** represent statistical significance for t-test of the mean difference at 10%, 5% and 1%. Figures in parentheses represent the percentage distribution.
Women empowerment of beneficiaries and non-beneficiaries
Table 2 presents the AWEAI estimates and its sub-indices (5DE and Gender Parity Index-GPI) showing the extent of women empowerment among benefitting cum non-benefitting households across 2019 and 2022. According to IFPRI (2021 & 2020) and Brago et al. (2025), higher values of AWEAI and its indices imply improvement in empowerment. As shown in Table 2, the AWEAI index and the 5DE sub-index did not distinguish between the beneficiaries and nonbeneficiaries in the baseline period (2019). This suggests similarities in characteristics and represents an essential condition in impact evaluation as the control and the treatment groups are expected to be initially similar except that one is treated (Peersman, 2014; Capacci et al., 2022). Disaggregation by 5DE score, however, shows slight differences in the empowerment status of the beneficiaries and nonbeneficiaries in 2019, with and of the women beneficiaries and non-beneficiaries, respectively empowered. Furthermore, the beneficiaries and nonbeneficiaries achieved weighted adequacy scores of and , respectively. In 2022, the achievements of women in terms of the empowerment domains were considerably higher among the beneficiaries than non-beneficiaries, as disempowerment headcount in 2022 reduced by for the beneficiaries and for non-beneficiaries. This greater reduction in disempowerment as found for the beneficiaries in this study indicates that access to road infrastructure may have improved empowerment among the beneficiary women.
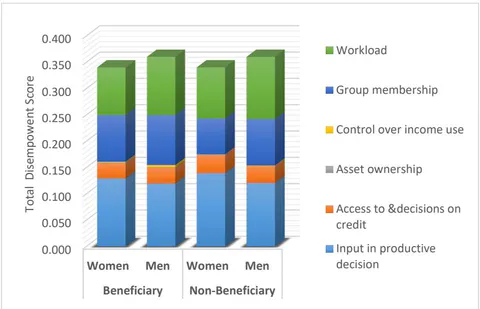
The GPI score which measures intra-household differences in empowerment (Nacka et al., 2024) is higher for the women beneficiaries than the non-beneficiaries following the introduction of the intervention, indicating greater parity among beneficiaries than the non-beneficiaries and aligns with a study in Ghana by Fuseini (2024). Parity with the primary male decision maker in the household was achieved by of the women beneficiaries and of non-beneficiaries, while their average empowerment gaps were and , respectively. Expectedly, the AWEAI score is also higher for the beneficiaries than the non-beneficiaries (0.81 versus 0.72). In terms of improvement in empowerment status for men in beneficiary households generally, the empowerment scores were higher. This aligns with Alao (2021), and Agénor and Agénor (2023) who opined that increased access to infrastructure may lead to increase in women’s bargaining power in the family and higher long-run growth rates. Results of the disaggregated 5DE indicators of empowerment are presented in Figures 3 and 4.
While the contributions of other indicators to empowerment can be directly linked to income generation and decision making, membership in a group can provide individuals with access to resources, information, and opportunities they might not have had otherwise. For example, women’s self-help groups often provide access to credit, training, and livelihood opportunities, which can empower members economically. In addition, input in decisions regarding production activities and workload had the highest disempowerment index for men and women in both beneficiary and non-beneficiary households. In 2022 however, inadequacies in all the indicators decreased greatly except for workload indicators whose inadequacy not only remained high but intensified for all the sampled households. The key informant interviews conducted in the study areas further corroborates these findings as stated below:
“With the road intervention in our community, women now take active part in decision making within their households. However, they tend to spend more than 9hours on productive activities which significantly increase in their workload” Ogun State “As a result of the road construction, there is about increase in involvement of women in decision relating to the use of input in production” - Taraba State
| Beneficiaries (2019) | Beneficiaries (2022) | Non-beneficiaries (2019) | Non-beneficiaries (2022) | |||||
|---|---|---|---|---|---|---|---|---|
| 2-3 (lr)4-5 (lr)6-7 (lr)8-9 Indicators | Women | Men | Women | Men | Women | Men | Women | Men |
| Observations | 167 | 255 | 165 | 257 | 88 | 137 | 91 | 134 |
| 5DE Score | 0.66 | 0.64 | 0.79 | 0.80 | 0.66 | 0.64 | 0.69 | 0.72 |
| Disempowerment score | 0.34 | 0.36 | 0.21 | 0.20 | 0.34 | 0.36 | 0.31 | 0.28 |
| % achieving empowerment | 18.29 | 15.02 | 54.05 | 51.52 | 14.12 | 13.97 | 30.26 | 34.23 |
| % not empowered (H) | 81.71 | 84.98 | 45.95 | 48.48 | 85.88 | 86.03 | 69.74 | 65.77 |
| Mean Disemp. Score (Ap) | 0.42 | 0.42 | 0.45 | 0.42 | 0.39 | 0.42 | 0.44 | 0.42 |
| Mean adequacy score | 0.59 | 0.58 | 0.56 | 0.58 | 0.61 | 0.58 | 0.57 | 0.58 |
| Gender Parity Index (GPI) | 0.971 | 0.968 | 0.974 | 0.949 | ||||
| % achieving parity | 31.67 | 24.07 | 38.98 | 11.63 | ||||
| Avg. empowerment gap | 0.138 | 0.293 | 0.141 | 0.256 | ||||
| AWEAI Score | 0.691 | 0.81 | 0.691 | 0.72 | ||||
Source: Authors’ Computation from VCDP Data, 2019 and 2022
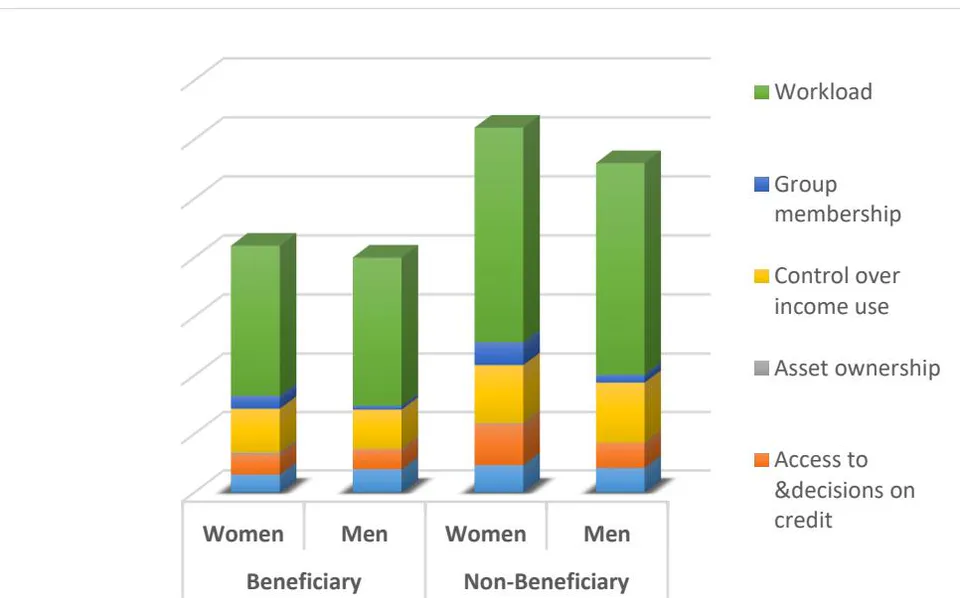
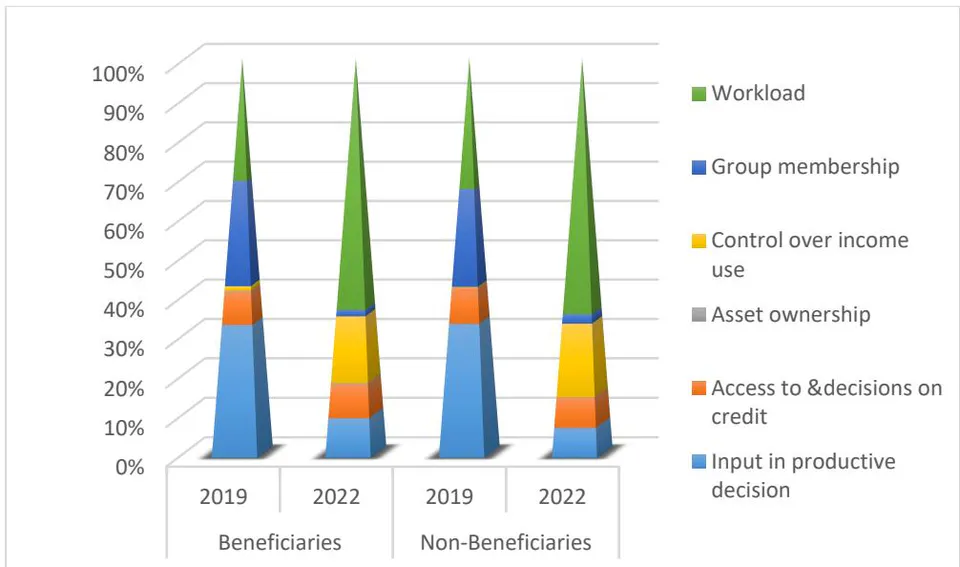
More specifically, about of the women beneficiaries are not yet empowered and overburdened with workload, lack access to credit and do not have adequate control over income use. Thus, the disempowerment index value was highest for workload in all the groups. For visual illustration of the disempowerment index, the proportion of each disempowerment indicator to the disempowerment score of the beneficiaries and nonbeneficiaries are presented in Figures 3 and 4. Taking all the samples together, the number of disempowered women reduced from in 2019 to in 2022 and the proportion achieving gender parity increased only marginally. The level of women empowerment as measured using the AWEAI-score also increased by in 2022. A similar trend in empowerment status was observed for the men, however, on the average, they had fewer inadequacies than women.
Decomposition of women disempowerment by dimensions of empowerment
The percent contributions of the different dimensions of empowerment to women disempowerment are decomposed as shown in Figure 5. The domains contributing the most to disempowerment among women beneficiaries are input in production decisions , workload and group membership . Similarly, these factors are the leading contributors to disempowerment among the non-beneficiaries; the corresponding values are input in production decisions , workload and group membership . The contribution of these domains to women disempowerment was however redistributed in 2022 with workload accounting for the highest share of total disempowerment for beneficiaries and for nonbeneficiaries); income (17.8% versus 16%) and resources (9.0% versus ). The contribution of workload to women’s disempowerment was more than doubled in 2022 and shows that women spent more hours on productive and domestic activities in 2022. By implication, about of women worked for more than 10.5 hours a day, corroborating the studies of Adeyanju and Fadupin (2023) and Musyoka et al. (2025). Interestingly, workload also contributed the most to disempowerment among men, regardless of whether they are beneficiaries or not (see Figure 5). This therefore raises a concern as to what aspect of time poverty contributes to disempowerment among men and women. Is it inadequacy in productive activities or reproductive activities? At this point, the authors argue that the AWEAI measure of women empowerment does not adequately represent the contribution of time domain to individual disempowerment and thus opine that the AWEAI be revised to further disaggregate the time domain into participation in productive activities and reproductive activities, of which the associated adequacy cut-off is equally revised.
Nutritional status of beneficiary and non-beneficiary
Results in Table 3 show the nutritional status of the beneficiaries and non-beneficiaries of the VCDP road infrastructure in 2019 and 2022. In 2019, most of the beneficiary and nonbeneficiary households had low dietary diversity. However, in 2022 after the VCDP intervention, the proportion of beneficiary households with high dietary diversity increased to , while that of the non-beneficiary decreased to . Moreover, the mean household dietary diversity score (HDDS) for the beneficiary households almost doubled between 2019 and 2022, from 3.41 to 6.76. This shows that while beneficiary households experienced more diversity in their diets, their non-beneficiary counterparts experienced less. This suggests that access to rural road infrastructure improves economic opportunities and income among rural households, hence improving nutrition outcomes (Rahman, 2014; Osunmakinde et al., 2022: Fuseini, 2024).
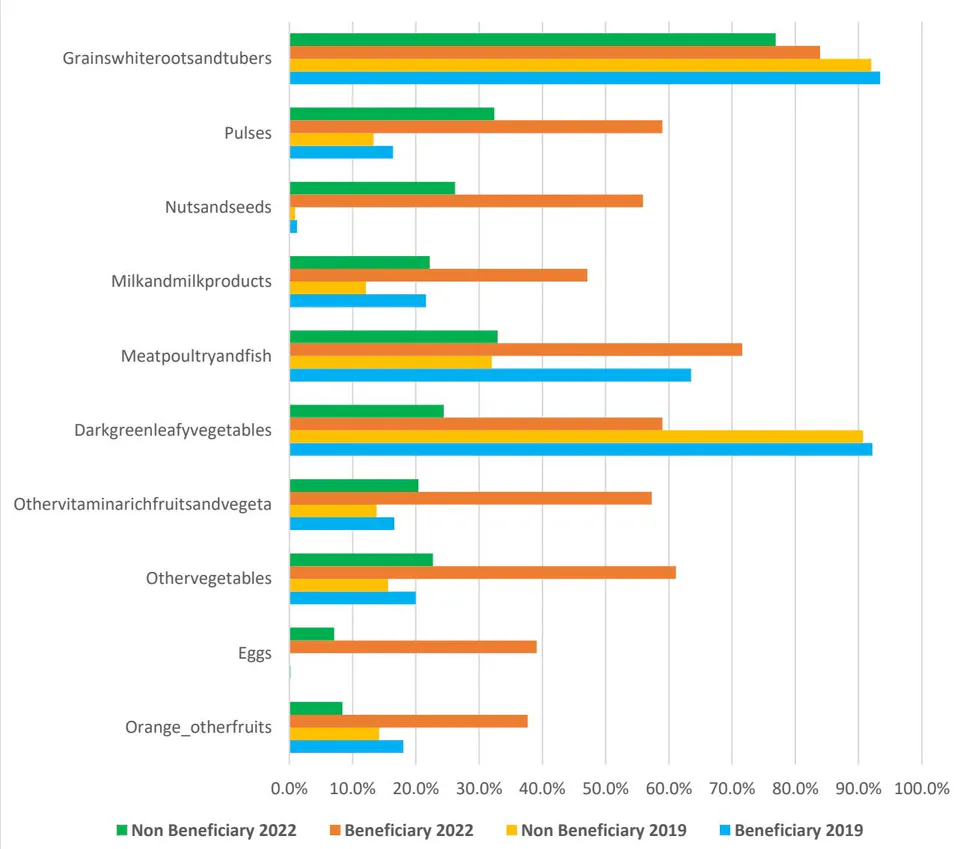
The MDDW estimates showed that in 2019, beneficiary and non-beneficiary households headed by females consumed more than five groups of food. However, in 2022 after the road intervention, the proportion of beneficiary households headed by females who consumed more than five food groups increased to , while that of the non-beneficiary increased to . Overall, the minimum dietary diversity scores also increased from in 2019 to in 2022. This is also evident in the MDDW which increased from to (for beneficiary) compared to to (for non-beneficiaries). Although both categories of households experienced an increase in the number of food groups consumed, the increase experienced by beneficiary households was far higher. Various food groups consumed across the study locations are as shown in Figure 6.
These findings are supported by those of Usman and Haile (2022) and Nyan et al. (2025) that improvement in dietary diversity of rural households often accompany improved physical infrastructure like market improvement. Moreover, the qualitative survey carried out in the communities studied show that more food varieties, fresh and processed, became available after VCDP intervention as food marketers could now come from the town to sell varieties of food items in the rural area. This also aligns with the fact that good roads facilitate the influx of varieties of food commodities which are not locally produced to strengthen the local food system and improve dietary diversity (El-Said, 2025). Furthermore, there was more diversification in livelihood and value addition in the food production. This may have enhanced a household’s income, leading to improved economic access and affordability of nutritious foods, particularly among the beneficiaries. These follows as noted in some of the qualitative interactive sessions:
“New business opportunities like poultry, (promotes) better nutrition, among youth, (there is) reduction in social vices due to empowerment” – Benue FGD
“Women … now process their cassava to garri (value addition) before selling especially during the off-farm season which make them to get higher value for their production” – Ebonyi FGD
“There is increase in production of already available foods like rice, cassava, vegetables, melon, garden egg and sugar cane; and new ones are introduced like Vitamin A cassava, yellow potatoes, diabetic rice, Sesame/benniseed, soya beans, palm fruit, sweet melon, watermelon, and coconut” - Bida, Niger State.
In addition, the road infrastructure saves time, reduces the cost of transportation, and enhances the farming household’s confidence in increasing the cultivation area. This further widens the profit margin of the people in benefitting communities and increases the availability of some indigenous nutritious foods.
“Road intervention makes access to farmland, ……, reduces the cost of transportation …, increases the production and productivity of farmers, makes food more available and reduced the cost. The road construction increased our income, reduced drudgery and reduced hours spent in the farms” – Anambra FGD.
“Farm size has increased, higher productivity and higher income and influx of different food items to the community have occurred…” - Ogun FGD.
| Household Dietary Diversity Score (HDDS) | Minimum Dietary Diversity for Women (MDDW) | |||||
|---|---|---|---|---|---|---|
| 2-4 (lr)5-7 Year | Overall | Beneficiary | Non-Beneficiary | Overall | Beneficiary | Non-Beneficiary |
| 2019 | 3.41 1.70 | 3.47 1.74 | 3.29 1.64 | 3.37 1.7 | 3.43 1.72 | 3.27 1.70 |
| % Met MDD | 64.45 | 62.80 | 67.56 | 20.39 | 22.75 | 15.91 |
| 2022 | 6.74 1.98 | 7.30 1.57 | 5.25 2.16 | 6.44 2.34 | 7.32 1.70 | 3.32 1.46 |
| % Met MDD | 79.08 | 89.57 | 51.65 | 73.75 | 93.60 | 32.72 |
| Pooled | 4.99 2.48 | – | – | 4.35 2.30 | – | – |
Source: Author’s Computation from VCDP Data, 2019 and 2022. Figures in parenthesis indicate the number of households involved.
Impact of rural road infrastructure on household nutrition women nutrition and empowerment
This section therefore focuses on the impact of the rural road infrastructure development component of the VCDP project on household nutrition (HDD), women nutrition (MDDW) and women economic empowerment. Table 5 presents the DiD regression estimates of two models—the restricted and unrestricted models. The restricted model presents the results of the effect of the rural road intervention on the study outcomes excluding the number of bridges and kilometers of roads constructed (and/or rehabilitated), while the unrestricted model extends the interaction analysis to demonstrate how infrastructure improvements in terms of kilometers of roads and numbers of bridges further impact the outcome variables. This helps to understand not only the direct impact of the intervention but also to reveal how project’s effects may vary in the context of changes in infrastructure, specifically through Year treatment*Road*Bridge interaction. The significant F-values of all the models suggest an overall significance of the models, while the Rsquared values depict the proportion of variance in the dependent variables as explained by the models. Prior to the estimations, a multicollinearity diagnostic was performed using Variance Inflation Factors (VIF) to ensure that the individual effects are truly being identified and the variables are not highly correlated. The VIF test results, presented in Table 4, confirm the absence of multicollinearity among the predictors with a mean VIF of 1.67.
The coefficient of the interaction terms (Year*treatment ATT1) in the restricted model captures the effect of the road intervention on the outcome variables. Also, an extra investment in road infrastructure is associated with an increase in household dietary diversity score (HDDS) by 2.806. This simply implies that better infrastructure facilitates improved access to diverse food sources, leading to greater dietary diversity within households. Similar significant positive improvements could be observed to be associated with women nutrition (MDDW) and women empowerment with 0.929 and 0.034 increases respectively. Improved access to roads and infrastructure increases market proximity, a critical factor in improving household well-being and nutrition. In addition to lower transportation costs arising from reduced distance and travel time, rural households with access to improved infrastructure may receive a “double dose” of income growth arising from both farm and non-farm income generated through increased sales and employment opportunities available along the road corridor. While improved markets access offer more diverse foods than can be produced by any given individual household, the multiple income sources further increase their capacities to purchase and consume more diversified food products (Kihiu & Amuakwa-Mensah, 2021; Qaim et al., 2016; Niazi et al., 2025).
| Variable | VIF | 1/VIF |
|---|---|---|
| ter_dum | 2.83 | 0.353549 |
| sec_dum | 2.57 | 0.388840 |
| road1_km | 2.54 | 0.393749 |
| no_bridges | 2.41 | 0.415152 |
| pry_dum | 2.05 | 0.488190 |
| logtinc | 1.51 | 0.663206 |
| logaginc | 1.50 | 0.666293 |
| locsthdum | 1.29 | 0.775168 |
| hhsize | 1.17 | 0.852281 |
| frmsiz | 1.14 | 0.876303 |
| age | 1.13 | 0.886535 |
| acceyes2_ext | 1.12 | 0.891470 |
| asset_index | 1.07 | 0.936129 |
| credtfm_dum | 1.04 | 0.964023 |
| Mean VIF | 1.67 |
Table 4: Variance Inflation Factor Test Results of Variables Experimented with in the DiD
Furthermore, results in Table 5 reveal that the size of household and being resident in the southern part of the country had a positive effect on women empowerment. This positive relationship suggests that larger households and living in the southern region may provide women with greater opportunities for participation in decision-making, resource allocation, or social engagement, which are critical aspects of empowerment. Similarly, farm income expressed as percentage of total household income, total household income and the possession of assets showed a positive significant relationship with MDDW and HDDS. The observed response of MDDW to changes in income may be due to the ability of women to utilize resources available to them significantly in enhancing dietary diversity within the household (Kihiu & Amuakwa-Mensah, 2021; Azeez, 2023).
For the unrestricted model, both the ATT1 and ATT2 (i.e, Year*treatment*Road*Bridge) interaction terms were all positive and significant for the HDD, MDDW and women empowerment outcomes. This indicates that for the three outcomes, the impact of the project is not only related to roads, but it is further enhanced when bridges are included. Also, the same set of significant variables influencing the study outcomes in the restricted model were similarly observed to be significant in the unrestricted model. However, in both models, the credit variable was observed to negatively influence MDDW significantly. This negative effect may stem from the gendered dynamics surrounding access to credit. Accordingly, when women do access credit, gendered control of resources within households may affect how the funds are allocated. Decisions about the use of credit may be dominated by other household members, particularly men, and may not prioritize improving dietary diversity. Also, cultural norms often cast women in sacrificial roles within households, requiring them to prioritize the needs of others over their own, including eating least and last, which may further impair their ability to meet their dietary requirements. There is pro male bias in food consumption at the intrahousehold level with women often receiving lower quantity of food and lower nutritional intake (Harris-Fry et al., 2017; Ghatak et al., 2024).
| Restricted Model I | Unrestricted Model II | |||||
|---|---|---|---|---|---|---|
| 2-4 (lr)5-7 Variables | HDD | MDDW | Empowerment | HDD | MDDW | Empowerment |
| Year dummy | −0.4814* * * | 1.5753* * * | 0.0100** | −0.4518** | 1.5465* * * | 0.0108** |
| (0.1269) | (0.3669) | (0.0041) | (0.2080) | (0.3681) | (0.0051) | |
| Treatment status | 0.1171 | 0.2057 | 0.1092 | 0.1916 | ||
| (0.1633) | (0.2832) | (0.0244) | (0.1619) | (0.2834) | (0.0244) | |
| Year*treatment (ATT1) | 2.8063* * * | 0.9290* * * | 0.0336* * * | 3.1571* * * | 1.1111* * * | 0.0704** |
| (0.2354) | (0.1698) | (0.0071) | (0.3455) | (0.0866) | (0.0063) | |
| Roads (Km) | – | – | – | −0.2531* * * | −0.1561* * * | |
| (0.0690) | (0.0220) | (0.0140) | ||||
| No. Bridges | – | – | – | 0.0110** | ||
| (0.0048) | (0.0055) | (0.0045) | ||||
| Year*treatment*Road*Bridge (ATT2) | – | – | – | 0.0090** | 0.0079* * * | 0.0704* * * |
| (0.0041) | (0.0012) | (0.0069) | ||||
| Sex (1 if male) | −0.6096* * * | – | – | −0.5815* * * | – | – |
| (0.1192) | (0.1184) | |||||
| Age (years) | 0.0028 | 0.0128 | 0.0009 | 0.0018 | 0.0127 | 0.0008 |
| (0.0064) | (0.0150) | (0.0012) | (0.0088) | (0.0155) | (0.0012) | |
| Household size | 0.0038* * * | 0.0038* * * | ||||
| (0.0178) | (0.0164) | (0.0008) | (0.0168) | (0.0139) | (0.0009) | |
| Primary education | 0.0791 | 0.0252 | 0.0502 | |||
| (0.0758) | (0.0735) | (0.0705) | (0.0399) | (0.1002) | (0.0701) | |
| Secondary education | 0.0940 | 0.1147 | 0.0137 | 0.0678 | 0.1008 | 0.0098 |
| (0.0863) | (0.4048) | (0.0345) | (0.0576) | (0.3785) | (0.0381) | |
| Tertiary education | 0.0153 | 0.0130 | ||||
| (0.0475) | (0.0557) | (0.1359) | (0.0647) | (0.1511) | (0.0460) | |
| Farm size (ha) | – | – | – | |||
| (0.0298) | (0.1124) | (0.0240) | ||||
| South location | 0.4655** | 0.6564** | 0.0593* * * | 0.7239* * * | 0.5653* * * | 0.0619* * * |
| (0.1569) | (0.1970) | (0.0205) | (0.1569) | (0.0812) | (0.0210) | |
| Farm income (%) | 0.0005 | 0.0075* * * | 0.0018 | 0.0078* * * | ||
| (0.0043) | (0.0011) | (0.0004) | (0.0035) | (0.0014) | (0.0002) | |
| Log of total income | 0.4737* * * | 0.7004** | 0.0040 | 0.4899* * * | 0.7119** | 0.0033 |
| (0.1440) | (0.2779) | (0.0135) | (0.1429) | (0.2948) | (0.0226) | |
| Extension services | ||||||
| (0.0147) | (0.2598) | (0.0290) | (0.1195) | (0.2551) | (0.0306) | |
| Asset ownership index | 0.0481** | 0.1858* * * | 0.0494** | 0.1851* * * | – | – |
| (0.0169) | (0.0507) | (0.0189) | (0.0525) | |||
| Access to Credit | −0.5665** | −0.5239* | – | – | ||
| (0.2355) | (0.2823) | (0.2212) | (0.2864) | |||
| Constant | 0.8636** | 0.5392* * * | 0.6830* * * | 0.5453* * * | ||
| (0.2963) | (1.1309) | (0.0732) | (0.1735) | (1.2103) | (0.0835) | |
| No. of observations | 1,170 | 403 | 370 | 1,170 | 403 | 370 |
| F-Value | 35.24* * * | 10.82* * * | 3.11** | 31.38* * * | 9.17* * * | 2.88** |
| Prob F | 0.0000 | 0.0000 | 0.0533 | 0.0000 | 0.0000 | 0.0450 |
| R-squared | 0.3284 | 0.2954 | 0.1483 | 0.3415 | 0.3006 | 0.1565 |
| Adjusted R-squared | 0.3191 | 0.2681 | 0.1263 | 0.3306 | 0.2678 | 0.1302 |
Standard errors are in parenthesis; *, ** and *** indicate significance at 10%, 5% and 1% respectively.
The analysis of the impact of rural road infrastructure development on household nutrition and women’s empowerment provides evidence that the provision of road infrastructure has had a substantial positive effect on these key dimensions. Drawing from the VCDP dataset, access to improved road infrastructure has led to increased dietary diversity and empowerment, particularly among beneficiary households. Specifically, the study confirmed that between 2019 and 2022, the proportion of disempowered women reduced more for VCDP beneficiaries with a lesser disempowerment gap compared to the non-beneficiaries. Dietary diversity for most households, particularly female-headed beneficiary households, was also higher relative to their nonbeneficiary counterparts. Based on the empirical evidence, road infrastructure significantly impacts household dietary diversity, women’s dietary diversity and women’s empowerment. These outcomes underscore the crucial role of road infrastructure in fostering well-being, gender equality, and income distribution in rural communities. Therefore, government in conjunction with the private sector and supporting international agencies/organizations should consider the infrastructure provision of roads to communities as part of its nutrition, empowerment, and income inequality policy. Specifically:
Efforts to promote better nutrition outcomes among rural households should incorporate infrastructural development such as roads and culverts construction. Such interventions should be deliberately designed to ensure nutrition sensitivity. Similarly, efforts should be intensified to prevent erosion of healthful practices such as high intake of fruits and vegetables, the consumption of underutilized food crops such as wild vegetables, and unchecked access to poor quality foods. Furthermore, nutrition education should be intensified in agricultural development programme to promote optimal benefits of such programmes to rural households. Most efforts could be championed by local and international agencies, NGOs etc., partnering with the government to improve infrastructure and welfare of the rural populace.
To strategically improve the level of women empowerment in Nigeria, there is a need to focus on workload, income and production dimensions as these factors have been shown to account for about eighty percent of their disempowerment. More rural road infrastructure programmes can help address these inadequacies experienced by women through the reduction in their travel time while creating more access to quality education, job market, economic resources and complementary sources of income.
The authors wish to acknowledge Opeyemi Omotoso and Adeola Adeagbo for their assistance during the research. The project coordinators of the Value chain development project at the Abuja office and the selected project states are also appreciated for their assistance in obtaining the secondary data used for the research and the primary data for validation. ICED is greatly acknowledged for the grant support provided to conduct this research successfully.
APPENDICES
Appendix A