I. INTRODUCTION
The objective of this research is to identify the main influential factors for sanitary sewage care in Brazilian municipalities based exclusively on secondary data from the SNIS, and . It has the purpose, therefore, of better exploring the information contained in these secondary sources of high relevance to the database system of the Brazilian State.
Information collected from the SNIS (Brazil, 2022) confirms the magnitude of the deficit in sanitary sewage service, especially for the north and northeast regions of Brazil. Table 1 below presents the indicator of sanitary sewage service by region of the country, which consists of sanitary sewage service referred to the population that has water supply. The source of this indicator is the SNIS (Brazil, 2022), with 2021 data as the reference year.
| Region | Total Service |
| North | 13,98% |
| Northeast | 30,20% |
| Central-West | 61,88% |
| Southeast | 81,67% |
| South | 48,43% |
| Region | Total Service |
| North | 13,98% |
| Northeast | 30,20% |
| Central-West | 61,88% |
| Southeast | 81,67% |
| South | 48,43% |
It is noted that the percentages of sanitary sewage service remain very low in the North and Northeast regions and still below in the South region. This scenario configures a still very strong demand for sanitary sewage services in the country.
What factors may be most related to this deficit of sanitary sewage in Brazil? Several authors point to causal factors related to the implementation of infrastructures, which requires a degree of concertation between organizations and institutions to materialize. There are four main factors: 1) Availability of sustainable inputs and technologies (John et.al., 2001; John, 2017; Hepburn et.al, 2020; Banhe & Lopes, 2019); 2) Nature and Quality of Institutions (Kelly, 2016; Acemoglu & Robinson, 2012; Eisler, 2008; Zylberstain, 2005; North, 1990; Ostrom, 1990); 3) Human Competencies (Novelli, 2004; Pires, 2004; Lotta & Favareto, 2016) and 4) Socio-environmental governance to be conceived and practiced in a systemic way (Dias & Seixas, 2018; Ferreira & Seixas, 2017; Badalotti & Carmelatto, 2016; Davis, 2005), with the assumption of developing around the concept of generating shared value, based on the coordination of institutional arrangements (Kramer & Pfizer, 2017; Villar, 2016; Pires, 2004; McCain, 2017; Lotta & Favaretto, 2016). For the specific case of sanitary sewage infrastructures, it is worth adding an equally relevant causal factor: sanitary administration, deeply analyzed by Uhr, et.al. (2016).
By evaluating a set of indicators related to the factors pointed out above, all referring to the year 2021, this quantitative research contributes to a more systemic and integrated view of sanitary sewage services in the country and their potential causes, which may subsidize more effective public policies to achieve the universalization goals set for 2033.
II. METHODOLOGY
a) Sample Size
The definition of the sample size followed the methodological guidelines derived from Oliveira (2018), according to which the sample size is given by:
standard deviation of a stratified random sample of 60 values of sanitary sewage service for 60 municipalities. The value obtained was 29.57.
for a significance level of for the results;
maximum allowable percentual error
Substituting these values into the equation, we get an . Thus, a sample size of 100 municipalities will be used.
b) Definition of Sampling
Once the sample size was obtained, the municipalities that will constitute it were defined. For this, the stratified random sampling method was used (Cohen, 1988), which consists of the random selection of municipalities within each Brazilian region and state. This selection followed the proportionality of municipalities according to their population ranges, by state and Brazilian regions, according to data from the SNIS (Brasil, 2022). The specific selection of municipalities according to the criteria defined above was made based on a random function existing in Excel.
Table 2 below presents the definition of the sample of 100 municipalities and the respective values of total sanitary sewage service.
| REIGIAO | ESTADO | MUNICÍPO | Número de habitantes | INDICADORES - SNIS - 2021* |
| Atendimento total (%) | ||||
| SUDESTE | MINAS GERAIS | Itunga | 10 a 20 mil | 33,97 |
| Novo Cruzelo | 20 a 50 mil | 30,40 | ||
| Formiga | 50 a 100 mil | 91,75 | ||
| Lejospalda | 50 a 100 mil | 99,13 | ||
| Betim | 100 a 500 mil | 78,13 | ||
| Ituiúba | 100 a 500 mil | 95,84 | ||
| Nova Serrana | 100 a 500 mil | 73,56 | ||
| Belo Horizonte | Mais de 500 mil | 93,98 | ||
| Contagem | Mais de 500 mil | 81,32 | ||
| Juiz de Fora | Mais de 500 mil | 94,67 | ||
| Uberlândia | Mais de 500 mil | 98,24 | ||
| São Paulo | Araçôaba de Serra | 20 a 50 mil | 92,16 | |
| Piraju | 20 a 50 mil | 99,22 | ||
| Lengobis Paulista | 50 a 100 mil | 97,76 | ||
| Mocambique | 50 a 100 mil | 100,00 | ||
| Adiabis | 100 a 500 mil | 74,10 | ||
| Itatiba | 100 a 500 mil | 85,29 | ||
| Leme | 100 a 500 mil | 97,94 | ||
| Pindamonhangaba | 100 a 500 mil | 100,00 | ||
| Santo | 100 a 500 mil | 99,93 | ||
| Campinas | Mais de 500 mil | 94,77 | ||
| Guarulhos | Mais de 500 mil | 92,29 | ||
| Maiau | Mais de 500 mil | 92,91 | ||
| Osasco | Mais de 500 mil | 100,00 | ||
| Bilbeirão Preto | Mais de 500 mil | 99,31 | ||
| Santo André | Mais de 500 mil | 100,00 | ||
| São Bernardo | Mais de 500 mil | 98,53 | ||
| São José dos Campos | Mais de 500 mil | 99,60 | ||
| São Paulo | Mais de 500 mil | 100,00 | ||
| Sorocaba | Mais de 500 mil | 98,22 | ||
| RIO DE JANEIRO | Arrial do Cabo | 20 a 50 mil | 80,12 | |
| Brio Bonito | 50 a 100 mil | 72,38 | ||
| Resende | 100 a 500 mil | 95,08 | ||
| São Pedro da Aldelia | 100 a 500 mil | 80,12 | ||
| Dusque de Caxias | Mais de 500 mil | 37,49 | ||
| Rio de Janeiro | Mais de 500 mil | 89,95 | ||
| Nova Iguapeu | Mais de 500 mil | 55,93 | ||
| ESPIRITO SANTO | Vitória | 100 a 500 mil | 60,52 | |
| NORDESTE | BAHIA | Itagueçu de Bahia | 10 a 20 mil | 41,36 |
| Camaçu | 20 a 50 mil | 6,26 | ||
| Santa Cruz Cabrília | 20 a 50 mil | 44,84 | ||
| Irecé | 50 a 100 mil | 15,03 | ||
| Alegoinhas | 100 a 500 mil | 36,07 | ||
| Santo Antonio de Jesus | 100 a 500 mil | 21,31 | ||
| Salvador | Mais de 500 mil | 88,36 | ||
| Peira de Santana | Mais de 500 mil | 55,37 | ||
| CEARÁ | Jujoca de Jéricoacoara | 20 a 50 mil | 9,78 | |
| Bos Viagem | 50 a 100 mil | 39,40 | ||
| Iguatu | 100 a 500 mil | 15,63 | ||
| Jusubelo do Norte | 100 a 500 mil | 24,14 | ||
| Fortaleza | Mais de 500 mil | 35,95 | ||
| PERNAMBUCO | Panellas | 20 a 50 mil | 54,45 | |
| Paulista | 100 a 500 mil | 54,21 | ||
| São Lourenço da Mata | 100 a 500 mil | 30,06 | ||
| Labbatão dos Guimarães | Mais de 500 mil | 21,64 | ||
| Beiribe | Mais de 500 mil | 44,99 | ||
| MARANHO | Pedreira | 20 a 50 mil | 30,26 | |
| Bacabal | 100 a 500 mil | 4,60 | ||
| São Luís | Mais de 500 mil | 49,85 | ||
| PIAUI | José de Freitas | 20 a 50 mil | 4,41 | |
| Teresina | Mais de 500 mil | 38,79 | ||
| PARAIBA | São José de Piranhas | 20 a 50 mil | 49,56 | |
| Volão Pessoa | Mais de 500 mil | 83,55 | ||
| ALAGOAS | Igací | 20 a 50 mil | 19,53 | |
| Maceió | Mais de 500 mil | 23,73 | ||
| RIO GRANDO DO NORTE | Curralis Novos | 20 a 50 mil | 63,06 | |
| Neto | Mais de 500 mil | 43,78 | ||
| SERGIPE | Nossa Senhora do Socorro | 100 a 500 mil | 32,32 | |
| NORTE | PARA | Ponta de Pedras | 20 a 50 mil | 15,93 |
| Redação | 50 a 100 mil | 5,34 | ||
| Castanhal | 100 a 500 mil | 0,73 | ||
| Belém | Mais de 500 mil | 17,12 | ||
| AMAZONAS | Carauari | 20 a 50 mil | 20,89 | |
| Manaus | Mais de 500 mil | 25,45 | ||
| RONDOÑIA | Porto Velho | Mais de 500 mil | 5,80 | |
| TOCANTINS | Palmas | 100 a 500 mil | 29,15 | |
| SUL | SANTA CATARINA | Máñá | 50 a 100 mil | 27,66 |
| Itajal | 100 a 500 mil | 28,16 | ||
| Jaraguá do Sul | 100 a 500 mil | 84,97 | ||
| Florianopolis | Mais de 500 mil | 65,71 | ||
| RIO GRANDE DO SUL | Frederico Westphalen | 20 a 50 mil | 34,07 | |
| Ijui | 50 a 100 mil | 19,66 | ||
| Viamão | 100 a 500 mil | 5,97 | ||
| Bigo Grande | 100 a 500 mil | 31,76 | ||
| Santa Maria | 100 a 500 mil | 62,90 | ||
| Caxias do Sul | Mais de 500 mil | 89,10 | ||
| Porto Alegre | Mais de 500 mil | 91,62 | ||
| PARANA | Francesco Beltrão | 50 a 100 mil | 84,63 | |
| Guarapuava | 100 a 500 mil | 94,71 | ||
| Toledo | 100 a 500 mil | 93,68 | ||
| Urumarama | 100 a 500 mil | 99,99 | ||
| Cunitiba | Mais de 500 mil | 99,98 | ||
| Londrina | Mais de 500 mil | 99,98 | ||
| CENTRO-OESTE | GOLIAS | Iperá | 20 a 50 mil | 49,19 |
| Valparaiso de Goias | 100 a 500 mil | 51,80 | ||
| Aparecido de Goiania | Mais de 500 mil | 58,69 | ||
| MATO GROSSO | Peluso de Azuvio | 20 a 50 mil | 48,01 | |
| Coviâbá | Mais de 500 mil | 76,43 | ||
| DISTrito FEDERAL | Brasília | Mais de 500 mil | 91,77 | |
| MATO GROSSO DO SUL | Dourados | 100 a 500 mil | 85,90 |
To arrive at the data presented in Table 2, it was necessary to redo random series as follows:
- Of the 100 municipalities initially selected, 13 did not present data on total sanitary sewage attendance, and of these 13, 9 had no response to this specific item and 4 did not respond to the IBGE questionnaire.
- In the states of Pará and Maranhão, 8 random programs were needed to reach municipalities with the necessary data;
Other states presented a need for 1 to 3 new randomizations to reach municipalities with the necessary data.
c) Definition of the Analytical Model
From the definition of the causal factors described in item 1 - Introduction - the most specific causal components were established, according to the main elements existing in the theoretical framework related to such causal factors. Due to these causal components, we searched among the secondary data existing in the IBGE (Brazil, 2021b) and ANA (Brazil, 2021a), the indicators that could best measure such causal components. The correspondence between the indicators used from the IBGE and ANA and the causal factors is presented in Chart 1 below. Among all the indicators, the only indicator obtained from ANA (Brasil, 2021a) was the one described in the causal factor "Governance", in the causal component "Coordination Capacity", called "Entity providing the service (State, municipality, private)".
| TARGET | CAUSAL FACTORS | CAUSAL COMPONENTS | INDICATORS (IBGE) | |
| DESCRIPTION | CODE | |||
| ACCESS TO SUSTAINABLE SANITATION | INSTITUTIONS | Regulation and Legal Security | Existence of Master Plan | MLEG01 |
| Year of the creation of the law | MLEG011 | |||
| Revised Plan | MLEG012 | |||
| Year of the last revision | MLEG013 | |||
| Plan in preparation | MLEG014 | |||
| Existence of Legislation - area and/or special zone of social interest (ZEIS) | MLEG02 | |||
| Year of the law | MLEG021 | |||
| Existence of Legislation - zoning or land use and occupation (ZUOS) | MLEG06 | |||
| Year of the law | MLEG061 | |||
| Existence of Legislation - environmental/economical/ecological zoning | MLEG12 | |||
| Year of the law | MLEG121 | |||
| HUMAN SKILLS | Interpersonal and interinstitutional relationships of trust | Existence of Education Municipal Council | MEDU22 | |
| Year of creation | MEDU221b | |||
| Education council: number of meetings in the last 12 months | MEDU24 | |||
| Existence of Cultural Municipal Council | MCUL19 | |||
| Year of creation | MCUL191b | |||
| Cultural council: number of meetings in the last 12 months | MCUL21 | |||
| Existence of local radio | MCUL373 | |||
| Existence of local communitary radio | MCUL375 | |||
| Existence of Sport Municipal Council | MESP10 | |||
| Year of creation | MESP101b | |||
| Sport council: number of meetings in the last 12 months | MESP12 | |||
| Existence of Health Municipal Council | MSAU10 | |||
| Year of creation | MSAU101b | |||
| Health council: number of meetings in the last 12 months | MSAU12 | |||
| Managerial and technical training | Number of training programs for Education Council (last 2 years) | MEDU26a | ||
| Frequent training for Health Council | MSAU141 | |||
| Management of Intersectoral Partnerships | Existence of Health Communitary Agents Program | MSAU28 | ||
| Number of Health Communitary Agents | MSAU281 | |||
| Existence of Family Health Program | MSAU29 | |||
| Existence of similar program as Family Health Program | MSAU31 | |||
| FINANCING | Attractiveness to the investors | Existence of Construction Code | MLEG11 | |
| Year of the law | MLEG111 | |||
| SUSTAINABLE INPUTS/TECHNOLOGIES | Technologies and Inputs | Existence of Internet Provider | MCUL378 | |
| Sanitary Administration | Health surveillance | MSAU541 | ||
| Epidemiological surveillance | MSAU542 | |||
| Endemic disease control | MSAU543 | |||
| GOVERNANCE | Coordination Capacity | Service provider entity (Estate, Private, Municipal) | Prest.Serv. | |
| The public healthy sector takes part in some Regional Management Meeting | MSAU19 | |||
| Number of Regional Management Meetings in the last 12 months | MSAU191 | |||
The relationships between the indicators from the IBGE and ANA with the components and causal factors of the analytical model adopted are as follows:
- Regulation and Legal Certainty: This component will be measured through the existence of legislation relevant to the subject of sanitary sewage, such as those related to the Master Plan, Special Zones of
Social Interest (ZEIS), Zoning or Land Use and Occupation (ZUOS) and Ecological-Economic Zoning (ZEE).
- Interpersonal and Inter-institutional Relationships of Trust: this component will be measured through data on the existence and functioning of Municipal Councils of Education, Health, Culture and Sport, in addition to local radio stations. The existence and functioning of such councils and local radios are related to the social capital that exists in the municipality, to the extent that they are spaces for social participation where connections are established and developed. The relationship between social capital and trust follows, in turn, the orientation of Putnam (2006) who demonstrates that "stocks of social capital, such as trust, norms and systems of participation, tend to be cumulative and mutually reinforcing" (Putnam, 2006, p. 186). From this perspective, a virtuous development would result from high levels of cooperation, trust and reciprocity, built from the capacity of society to organize itself with a view to collective well-being (Ortega & Matos, 2013).
- Managerial and Technical Training: This component will be measured through the data on the existence of training in the municipalities, especially in the areas of education and health. Such areas tend to have greater influences on the development of local infrastructures.
- Management of Intersectoral Partnerships: This component will be measured through data on the existence and operation of City Hall Programs that require the concertation of alliances between members of the government and organized civil society, as is the case of Family Health Programs and Community Health Agents.
- Attractiveness for the Investor: This component will be measured through the existence and operation of the municipality's Construction Code, considering that this procedure is fundamental for the attraction and consolidation of housing and sanitation investments in the municipalities.
- Technology and Inputs: This component will be measured through the existence and operation of a minimum technological infrastructure for the organization of information, which, in this case, refers to the municipality having an internet provider available for the platform of its services.
- Sanitary Administration: This component will be measured through the existence of adequate controls for sanitary surveillance, epidemiology and endemic control.
- Coordination Capacity: This component will be measured through the existence and functioning of the type of entity providing sanitary sewage service present in the municipality and the existence of
interdisciplinary discussion spaces such as the Regional Management Collegiate.
d) Statistical Procedures
Based on the data regarding sanitary sewage present in the SNIS, by municipality - sewage collection, treated sewage, urban sanitary sewage service and total sanitary sewage service - it was decided to define the dependent variable as only the total sanitary sewage service, as it expresses the desired final result regarding the implementation of the service. The independent variables were collected from the IBGE and ANA and presented in Chart 1. The following statistical procedures were necessary to prepare the database relating the dependent variable to the independent variables, by municipality in the sample:
- Transformations of categorical variables into numerical variables. Chart 2 below shows the transformation of categorical variables into numerical variables. After these transformations, the assigned values were entered into the database.
Chart 2: Coding of the Categorical Variables of the Model
| Codificacao variaveis categoricas | |||
| Variavel | Cóhetto variavel | Valores | Descrição |
| Faixa de popULAção | Faixa_pop | 0 | 10000 a 20000 |
| 1 | 20001 a 50000 | ||
| 2 | 50001 a 100000 | ||
| 3 | 100001 a 500000 | ||
| 4 | Maior que 500000 | ||
| Região | Região | 0 | Norte |
| 1 | Nordeste | ||
| 2 | Centro-oeste | ||
| 3 | Sudeste | ||
| 4 | Sul | ||
| Prestador do service | Prestador | 0 | Estatal |
| 1 | Prefeitura | ||
| 2 | Privada | ||
| Existência Plano Diretor | MLEG01 | 0 | Sim |
| 1 | Não | ||
| Plano Diretor revisto | MLEG012 | 0 | Sim |
| 1 | Não | ||
| Existência ZEIS | MLEG02 | 0 | Sim, legisção especialica |
| 1 | Não | ||
| 2 | Sim, parte Plano Diretor | ||
| Existência ZUOS | MLEG06 | 0 | Sim, legisção especialica |
| 1 | Não | ||
| 2 | Sim, parte Plano Diretor | ||
| Existência:Códio de Obras | MLEG11 | 0 | Sim, legisção especialica |
| 1 | Não | ||
| 2 | Sim, parte Plano Diretor | ||
| Existência ZEE | MLEG12 | 0 | Sim, legisção especialica |
| 1 | Não | ||
| 2 | Sim, parte Plano Diretor | ||
| Existência Conselho Municipal Educação | MEDU22 | 0 | sim |
| 1 | não | ||
| Existência Conselho Municipal Cultura | MCUL19 | 0 | sim |
| 1 | não | ||
| Existência Radio AM local | MCUL373 | 0 | sim |
| 1 | não | ||
| Existência Rádio Comunitária local | MCUL375 | 0 | sim |
| 1 | não | ||
| Existência provedor de internet | MCUL378 | 0 | sim |
| 1 | não | ||
| Existência Conselho Municipal Esportes | MESP10 | 0 | sim |
| 1 | não | ||
| Existência Conselho Municipal Saude | MSAU10 | 0 | sim |
| 1 | não | ||
| Realização periodica de capacação para o Conselho da Saude | MSAU141 | 0 | sim |
| 1 | não | ||
| Organo gestor saude parte Colegiado Regional | MSAU19 | 0 | sim |
| 1 | não | ||
| Existência Agentes Comunitários Saude | MSAU28 | 0 | sim |
| 1 | não | ||
| Existência Programa da Saude da Família | MSAU29 | 0 | sim |
| 1 | não | ||
| Vigilança Sanitária | MSAU541 | 0 | sim |
| 1 | não | ||
| Vigilança Epidemiológica | MSAU542 | 0 | sim |
| 1 | não | ||
| Contrôle de endemias | MSAU543 | 0 | sim |
| 1 | não | ||
- Application of Correlations between Variables in the R Programming Language: From the first application of the correlations between variables of the model, the following removal of indicators was made:
a. Indicators without Correlation: indicators that had a correlation very close to zero were removed. The correlation tool itself eliminates the variables without any correlation.
b. Indicators of Dependent Variables with Correlation between them - Collinearity Test: Dependent indicators that present a strong correlation with each other were removed. c. Outlier Present in the Variable Msau191: After removing this outlier, this variable no longer showed correlation and was eliminated from the model.
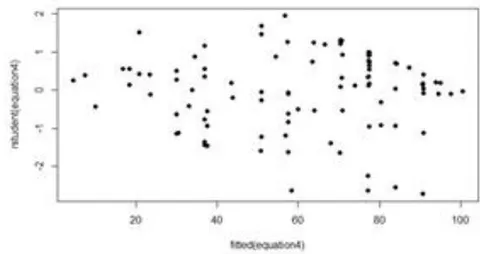
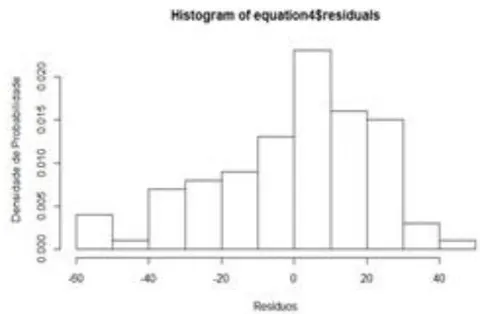
After adjustments to the database reported in items 1 and 2 above, a multivariate regression analysis was performed with the remaining dependent and independent variables. Figure 1 below presents the main results of the regression analysis, normality tests and respective graphs that support the feasibility of using the proposed model:
Aplicacao de Modelo de Regressao Linear
lm(formula = Atendimento.total ~ Faixapop + Regiao + Mleg11 + Mesp10 + Msa28 + Msa543, data = datas6)
| lm(formula = Atendimento.total ~ Faixapop + Regiao + Mleg11 + Mesp10 + Msa28 + Msa543, data = datas6) | ||||
| Residuals: | ||||
| Min | 10 | Median | 30 | Max |
| -58.885 | -12.580 | 3.276 | 16.473 | 42.566 |
| Coefficients: | ||||
| Intercept | 10.006 | 7.580 | 1.320 | 0.190035 |
| Faixapop | 6.887 | 1.794 | 3.838 | 0.000226 *** |
| Regiao | 13.330 | 1.979 | 6.734 | 1.35e-09 *** |
| Mleg11 | -16.189 | 5.158 | -3.138 | 0.002277 ** |
| Mesp10 | 6.660 | 5.207 | 1.279 | 0.204079 |
| Msa28 | 9.705 | 7.923 | 1.225 | 0.223658 |
| Msa543 | 17.295 | 14.494 | 1.193 | 0.235813 |
| signif. codes: 0 *** 0.001 *** 0.01 ** 0.05... 0.1... 1 | ||||
| Residual standard error: 23.04 on 93 degrees of freedom | ||||
| Multiple R-squared: 0.5344, Adjusted R-squared: 0.5043 | ||||
| F-statistic: 17.79 on 6 and 93 DF, p-value: 1.248e-13 | ||||
Teste de Normalidade - Kolmogorov-Smirnov: equation4$residuals; D = 0.11254; p-value = 0.1587. Como p-value > 0,05 (0,1587), não devemos rejeitar a H0, de que a distribuição é normal. Concluindo, o modelo parece se ajustar bem aos dados e cumpre com os requisitos.
| Teste de Normalidade - Kolmogorov-Smirnov: equation4$residuals; D = 0.11254; p-value = 0.1587. Como p-value > 0,05 (0,1587), não devemos rejeitar a H0, de que a distribuição é normal. Concluindo, o modelo parece se ajustar bem aos dados e cumpre com os requisitos. |
III. RESULTS AND DISCUSSION
a) Analysis of Correlations
All the results obtained in the correlation analyses are presented in Table 3 – which shows the most representative correlation coefficients between the variables of the model. In view of the selection of only the dependent variable "total sanitary sewage attendance" as representative, Figure 2 consolidates the possible causal relationships between this dependent variable and the independent variables. It was decided to consider correlations to identify significant and explanatory relationships for the phenomenon of total sanitary sewage attendance. According to Cohen (1988), values between 0.10 and 0.29 can be considered small; values between 0.30 and 0.49 can be considered moderate; and values between 0.50 and 1 can be interpreted as strong. Dancey and Reidy (2005) point to a more rigorous classification: to 0.30 (weak); to 0.6 (moderate); to 1 (strong). Considering that we are facing an integrated and interdisciplinary phenomenon, correlations between variables were defined as significant for the analysis, which for both authors frame the correlations obtained in this study as between moderate and strong.
| Correlações | Pearson |
| Coleta de esgoto X Atendimento Total | 0,8549 |
| Coleta de esgoto X Região | 0,4122 |
| Coleta de esgoto X Atendimento Urbano | 0,8960 |
| Atendimento Urbano X Atendimento Total | 0,9363 |
| Atendimento Urbano X Região | 0,5828 |
| Atendimento Total X Faixapop | 0,4464 |
| Atendimento Total X Região | 0,6226 |
| Atendimento Total X Mleg06 | -0,3171 |
| Faixapop X Msau13 | 0,5045 |
| Faixapop X Mleg06 | -0,3262 |
| Faixapop X Medu24 | 0,3487 |
| Mleg02 X Mleg06 | 0,3630 |
| Mleg02 X Mleg12 | 0,4143 |
| Mleg06 X Mleg12 | 0,3684 |
| Mleg11 X Medu22 | 0,3994 |
| Mleg11 X Msau10 | 0,3994 |
| Mesp10 X Região | 0,3192 |
| Mesp10 X Msau13 | -0,3459 |
| Msau191 X Msau28 | 0,3282 |
| Msau191 X Msau29 | 0,5964 |
| Msau28 X Msau543 | 0,3129 |
| Msau541 X Msau542 | 0,7035 |
| Msau542 X Msau543 | 0,3936 |
Based on these main Pearson correlation coefficients, it was possible to establish a graph of possible causal relationships between the dependent variable "total sewage attendance" and the independent variables with the highest correlation.
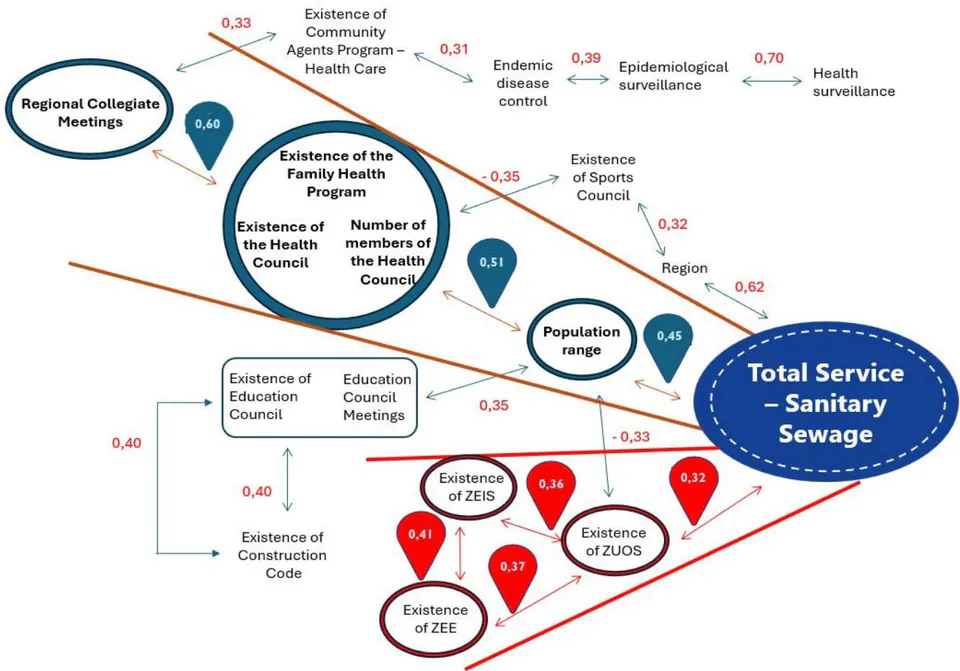
Figure 2 shows two causal analytical propositions (green and red paths identified) of the phenomenon of total sanitary sewage service in Brazilian municipalities.
The first (green), with positive correlations, attests to a direct positive relationship between the population groups and the total sanitary sewage service, which points in the direction that more populous municipalities tend to have better sanitary sewage service. The population ranges also have a positive correlation with existing health structures in operation in the municipalities. The existence of the Family Health Program, the existence of the Health Council, with the number of its respective members, denote, in turn, a certain degree of social capital in the health area. Finally, this health structure in the municipalities has a strong correlation with the participation of these professionals and their institutions in territorial collegiate meetings, which may be related to a more adequate design of intersectoral governance.
A second analytical proposition (red), with a negative correlation, presents a negative relationship between the total sanitary sewage service and the existence and operation of the Land Use and Occupation Zoning. This legislation, in turn, has positive planning (Special Zones of Social Interest and Ecological-Economic Zoning). This may be related to the fact that, although the municipalities have been evolving from the institutional point of view, regarding the enactment of zoning laws and building codes, this evolution does not seem to be integrated into effective sanitary sewage projects in the municipalities.
b) Multivariate Linear Regression Analysis
After the methodological procedures described, it was possible to propose a linear regression model, with the following equation, to estimate the Total Sanitary Sewage Service (ATES):
Region = Region of Brazil to which the municipality belongs
Mleg11 = Existence of the Construction Code in the municipality
Mesp10 = Existence of a Municipal Sports Council in the municipality
Msau28 = Existence of a Community Health Agents Program in the municipality
It should be noted that the proposed equation can explain about of the variation in the total sewage service, but it was presented, in the Kolmogorov-Smirnov normality test, as adjusted to the data and complying with the requirements of normality in the distribution of variances.
IV. CONCLUSIONS
Specifically dealing with total sanitary sewage care in Brazilian municipalities, it is appropriate to frame the analysis of its causes in a theoretical-conceptual framework that provides a systemic, integrated and interdisciplinary view. In the end, it is not only good sanitary sewage infrastructure projects that are missing to achieve universalization in the care of the Brazilian population. There is a need to evaluate variables of the institutional spectrum, attractiveness for investment, human relations, availability of inputs/technologies and governance standards.
The present study aimed to make a quantitative analysis of interdisciplinary variables in order to identify the main factors that contribute to the effective implementation of sanitary sewage in Brazilian municipalities. The results confirm a positive correlation with variables associated with social capital and trust relationships in the municipalities, especially in the areas of health and education. This demonstrates that the municipality's capacity to implement sanitary sewage is also associated with the physical and human structure of related areas such as health, where sanitary administration plays an important role in endemic controls, which are directly related to the lack of basic sanitation. The data, therefore, indicate that adequate health infrastructures can support the implementation of sanitary sewage.
On the other hand, negative correlations between total sanitary sewage service and legislation aimed at the ecological, economic and social zoning of localities may signal how much these laws are failing to be integrated into sanitation infrastructures and, thus, guarantee, in fact, better living and housing conditions for the populations.
In view of the indication that human relations variables are influential in the process, it is suggested that future referrals of this research include a quantitative study with a larger number of municipalities and, mainly, that the quantitative studies be complemented with qualitative analyses that can deepen the understanding of the relationships involved. In addition, it is necessary to investigate more deeply the theoretical-conceptual framework of trust relationships in order to have a greater and more accurate understanding of their influence on the process.
Despite the limitations of the models used - as well as relative imprecision in the measurement of some causal components, such as trust/social capital relations, managerial and technical training, partnership management, inter-institutional coordination capacity and data availability/processing - the research presented here represents a kick-off in the holistic and integrated understanding of the phenomenon of sanitary sewage in the country and its causes.