Purpose: The objective of this work is to propose a business process management maturity model (BPMMM), prescriptive and with multicriteria decision-making approach (MCDM). Design/Methodology/Approach: The relevant literature was examined to develop BPMMM. The Analytic Hierarchy Process (AHP) method was chosen to evaluate the weight of the capabilities. The Fuzzy Technique for Order Preference by Similarity to Ideal Solution (TOPSIS) method measured the maturity level. The model was applied in property divisions (DIPAT) of two federal universities (public institutions) with comparative and prescriptive purpose: Reference DIPAT and Real DIPAT. Findings: The AHP method allowed the analysis and weighting of capabilities. Fuzzy-TOPSIS has enabled the determination of maturity level effectively. As a result, Reference DIPAT and Real DIPAT obtained maturity level 3 (defined). Through comparative analysis, the critical factors for improvements in Real DIPAT were: strategic alignment, culture and people.
## I. INTRODUCTION
Business Process Management (BPM) has been extensively addressed and refers to a combination of modeling, automation, execution, control, measurement, and optimization of activities applied to corporate objectives, encompassing systems, human resources, customers, and partners (Mahendrawathi et al., 2019). Therefore, BPM aims to assist organizations in the continuous improvement of their processes, describing how organizations operate, which directly impacts their performance (van Looy et al., 2013; Boer et al., 2015).
The measurement of processes in organizations is carried out through maturity models (MM). MM is an essential tool for improvement in organizations (van Looy et al., 2013) and an instrument capable of continuously evaluating and improving their processes (Tarhan et al., 2015). Additionally, process maturity refers to the assessment of its overall conditions, analyzed through different sets of multidimensional criteria. In this process, maturity levels range from an initial state to a more mature state (Froger et al., 2019). Generally, processes with a high level of maturity are associated with better performance, meaning that the output products and services have higher quality (Dijkman et al., 2015).
Despite its significance, the widespread adoption of maturity models in the BPM field has not materialized in organizations (Tarhan et al., 2016). Numerous maturity models proposed in the literature (Aragão et al., 2023; Chiroli et al., 2022; Mello et al., 2022; Soares et al., 2020) have been criticized in studies citing problems such as application complexity, limited flexibility, lack of empirical evidence presentation, and restricted prescriptive characteristics (Alshathry, 2016; Röglinger et al., 2012; Tarhan et al., 2015; Tarhan et al., 2016). Moreover, the measurement of maturity is often performed through qualitative methods, introducing limitations and high subjectivity to the models.
Röglinger et al. (2012) consider that the development of Business Process Management Maturity Models (BPMMM) should be based on integrating and consolidating an existing model, such as Tarhan et al. (2016), emphasizing the consolidation of BPMMM, focusing strongly on prescriptive properties, as the direction for future work.
Based on this, the objective of this study is to propose a BPMMM based on relevant models from scientific literature, with prescriptive characteristics and a multi-criteria decision-making approach (MCDM). The proposed model considers the capabilities of the Business Process Management Capability Framework (BPM-CF) model, including strategic alignment, governance, methods, information technology, people, and culture (Froger et al., 2019; Niehaves et al., 2013; Zwicker et al., 2010; Rosemann et al., 2006). After selecting these capabilities, we proceeded to analyze the factors within the BPM-CF and Process Execution Maturity Model (PEMM).
The relevance of this study is highlighted by its practical and managerial contribution to asset management, as well as its theoretical and methodological contribution to the scientific community. Due to the growing demand and expansion of asset control activities, the search for new tools and management strategies becomes crucial for public institutions. The application of a maturity model to measure the maturity of asset management processes aligns with these needs.
Through this research, it becomes possible to diagnose and evaluate the degree of maturity of processes and tools within the Property Divisions of public universities. This evaluation offers tangible improvement opportunities not only within these institutions but also within other public sector organizations sharing the same goal of enhancement.
The significance of this research also lies in its ability to assist researchers, experts, and public servants in understanding, evaluating, and selecting maturity models that best represent their organizational goals. This is achievable through the systematic literature review conducted, maximizing the results of its application. Furthermore, the proposal of a prescriptive maturity model, utilizing a multi-criteria approach and presenting ease of application, promises to be a valuable tool in facilitating the practical implementation of these models.
## II. LITERATURE REVIEW
### a) Business Process Management Maturity Models (BPMMM)
Maturity models are tools that assist in the measurement of general process conditions. Business process management capabilities are used to propose maturity models as measurement instruments (van Looy, 2019). Maturity levels are assessed by the desired phases, from an initial state to a more mature state (Froger et al., 2019), characterized as a set of criteria or standards, used by organizations, to evaluate the level of efficiency and compliance in the process management (Alshathy, 2016).
The main objective of maturity models is to describe the stages of the maturation path, including the characteristics of each stage and the logical relationship between them (Röglinger et al., 2012). As for practical application, the classic purposes of use are: descriptive, prescriptive, and comparative (BRUIN et al., 2005). The model with a descriptive goal is applied to assess the current state of the process. Although, the prescriptive model is applied to identify desirable maturity future levels and provide guidance on implementing these improvements base on improvement measures. The model with a comparative purpose allows internal or external benchmarking (Röglinger et al., 2012).
According to BPMMM analysis studies (Alshathry, 2016; Froger et al., 2019; Röglinger et al., 2012; Tarhan et al., 2015; Tarhan et al., 2016) and BPMMM selection study (Lima et al., 2017), the BPM-CF model (Rosemann and Bruin, 2005) is the most referenced in the literature, with extensive studies of its application. The PEMM model (Hammer, 2007) is the only one that can be applied to a single or a set of processes, and its simplicity in design allows for self-assessment, with no need for external specialists. Therefore, the proposed model of this study is based on the BPM-CF and PEMM models, considering that Röglinger et al. (2012) points out that the development of BPMMM must be based on the integration and consolidation of an existing model; as well as Tarhan et al. (2016), who states that the consolidation of existing BPMMM, with a strong emphasis on prescriptive ability, should be the direction for future studies.
### b) Capabilities and Maturity Levels
The BMM-CF model, by Rosemann and Bruin (2005), comprises six assessment capacities: Strategic Alignment, Governance, Methods, Information Technology, People, and Culture. The PEMM model (Hammer, 2007) encompasses the so-called facilitators, who attribute to the process the potential to offer high performance, namely: Design, Executors, Responsible, Infrastructure, and Metrics. This model also addresses the so-called capacities, which guarantee the process needs to change and support, which are: Leadership, Culture, Knowledge, and Governance.
The BPM-CF model, regarding the maturity levels, covers five levels: initial, repetitive, defined, managed, and optimized. The PEMM model covers four levels: P1 (reliable, predictable, and stable), P2 (superior results), P3 (ideal performance), and P4 (best in class).
## III. METHODOLOGY
### a) Selection of the Maturity Model
The maturity model proposed in this study is based on the BPM-CF and PEMM models, because in addition to being relevant models in the literature, according to Froger et al. (2019), the performance of the processes depends not only on their individual characteristics but also on business skills, such as culture and knowledge. In this context, the BPM-CF and PEMM models are the only ones that evaluate these capacities among the models presented in reviews studies of BPMMM analysis (Alshathry, 2016; Froger et al., 2019; Röglinger et al., 2012; Tarhan et al., 2015; Tarhan et al., 2016).
The capacities and evaluative factors of the proposed model are based on the BPM-CF model. In addition, some evaluative factors are based on the PEMM model because its comprehensiveness in a certain item and/or language more appropriate to the user. The capacities and factors assessed, as well as the model questions, are described in Appendix 1.
The maturity levels are based on the BPM-CF model (Rosemann and Bruin (2005) since it is the most cited in the literature (Tarhan et al. 2016) and the main model used concerning the proposal of the new model. Table I presents the levels and descriptions of the proposed maturity model, based on the BPM-CF model.
Table I: Maturity Levels
<table><tr><td>MaturityLevel</td><td>Description</td></tr><tr><td>Level 1 – Initial</td><td>It does not have process management initiatives or has uncoordinated and unstructured initiatives.</td></tr><tr><td>Level 2 – Repetitive</td><td>It is progressing beyond the first process management initiatives and is looking for management improvements.</td></tr><tr><td>Level 3 – Defined</td><td>It has growing quests to build and develop the capacity for process management and expand individuals who analyze the organization from a process perspective.</td></tr><tr><td>Level 4 – Managed</td><td>It has a management process firmly implanted in the composition of improvement strategies.</td></tr><tr><td>Level 5 – Optimized</td><td>It has a management process firmly implanted in strategic and operational management.</td></tr></table>
### b) Model Maturity Level Evaluation
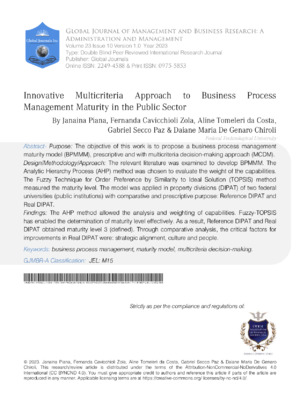
After defining the model maturity levels, the next step is to define the ways for the proposed model to deliver the final result, presenting the maturity level of the sectors surveyed. To achieve this goal, we decided to use a qualitative model to measure the maturity level, in order make it easier for users. For this, figure 1 illustrates the followed procedures.
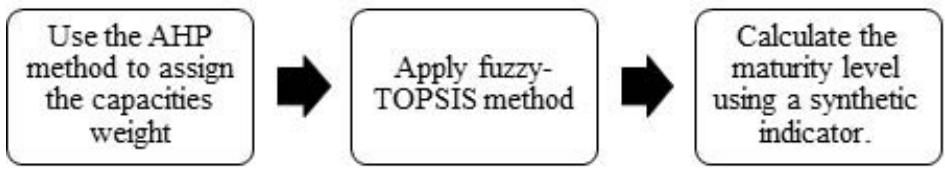 Figure 1: Calculation for the Maturity Level
The evaluation model proposed here is based on the MDCM methodology of Aragão (2020) and Zola et al. (2019).
## i. AHP Method
The AHP is a MCDM based proposed by Saaty (1994), where the decision-maker can express his preferences (Serrano et al., 2011). It can be applied to rank the alternatives or to weigh the criteria, being the second option the most used one (Zola et al., 2019). In this study, the AHP method is used to weigh the criteria. In the AHP weighting process, an individual or a group of decision-makers do pairwise comparisons of each of the criteria, using the Saaty scale (Saaty, 1980) as a reference, as shown in Table II.
Table II: Saaty Scale
<table><tr><td>Number</td><td>Linguistic Variable</td><td>Meaning</td></tr><tr><td>1</td><td>Equalpreference</td><td>The two criteria contribute identically to the objective.</td></tr><tr><td>3</td><td>Moderatepreference</td><td>One criterion is a little more preferable than the other.</td></tr><tr><td>5</td><td>Strong preference</td><td>One criterion is clearly preferable to the other.</td></tr><tr><td>7</td><td>Verystrongpreference</td><td>One criterion is predominant for the objective.</td></tr><tr><td>9</td><td>Extreme preference</td><td>Without any doubt, one of the criteria is absolutely predominant for the objective.</td></tr><tr><td>2,4,6,8 Reciprocal Valuesofprevious</td><td>Intermediatevalues</td><td>When looking for a compromise condition between the two definitions.</td></tr></table>
From the comparison matrix, the priority vector is calculated using the eigenvector method. With the eigenvector $w$ of the matrix $A$, $AW = \lambda_{maxW}$, considering that $\lambda_{maxW}$ is the maximum eigenvector of the $A$ matrix, it is possible to estimate the priority of the criteria (Saaty, 1994). It is also necessary to calculate the consistency rate (CR) that aims to capture whether decision-makers were consistent in their opinions, through the equation:
$$
C R = \frac {C I}{R I} \tag {1}
$$
where $CI$ is the consistency index and $RI$ is the random index. $CI$ and $RI$ values depend on the number of criteria $(n)$. The $CI$ is calculated by using the formula:
$$
C I = \frac {\lambda - n}{n - 1} \tag {2}
$$
where $\lambda$ is the average value of the consistency vector. For comparisons to be consistent, the CR value must be less than 0.1 (Saaty, 1994).
In order to calculate the weighting of a series of criteria weights base on more than one decision-maker, the method of entropy of Zeleny (1976) is used. The entropy method is considered a measure of the uncertainty of the information, where the first step consists of normalized the decision matrix through the equations:
$$
x _ {i j} = \frac {a _ {i j}}{\operatorname* {m a x} \left\{a _ {i j} \right\}} \tag {3}
$$
$$
r _ {i j} = \frac {x _ {i j}}{\sum_ {i = 1} ^ {m} x _ {i j}} \tag {4}
$$
where $r_{ij}$ represents the normalized performance of the alternative $i$ ( $i = 1, \dots, m$ ) in relation to the criterion $j$ ( $j = 1, \dots, n$ ). After the normalization process, the following equations are used:
$$
E _ {j} = - k \sum_ {i = 1} ^ {m} r _ {i j} I n (r _ {i j}) \tag {5}
$$
$$
k = 1 / \ln (m)
$$
$$
D _ {j} = 1 - E _ {j} \tag {7}
$$
$$
\lambda_{i} = \frac{D_{j}}{\sum_{j=1}^{n} D_{j}}
$$
where $E_{j}$ means the entropy of the set of alternatives for the criterion $j$; $D_{j}$ means the degree of diversification of the information provided by the results of the criterion $j$; and $\lambda_{i}$ is the weight of the criterion $j$.
## ii. Fuzzy-TOPSIS Method
After defining the capacity weights, the Aragão methodology (2020) is used to generate a synthetic indicator that makes it possible to measure the maturity level of the model.
Aragão's (2020) proposes the use of the so-called "evaluation alternatives", being the basis to compose a synthetic indicator, which determines the level of final maturity. The evaluation alternatives are: (i) the Utopian alternative $(A^{+})$, with the data considered ideal for the highest level of maturity; (ii) the Reference alternative $(A_{r})$, with the data obtained from a maturity reference to the user (sector, processes, department, etc.) for possible comparison with the data from where the model will be applied (sector, process, department, etc.); and the Real Alternative (A), which is the data where the model will be applied (sector, process, department, etc.); and the alternative Limit $(A_{0})$ which has the minimum values among the main references. From these definitions, the evaluation alternatives of this study are composed by the variables: Utopian DIPAT $(A^{+})$; Reference DIPAT $(A_{r})$ and Real DIPAT (A). The alternative Limit $(A_{0})$ was not used in this study, as we chose to use only the values of the Utopian alternative $(A^{+})$ to calculate the priorities for applying improvements.
Aragão (2020) used the TOPSIS method to generate a synthetic indicator. In this study, the method was changed to Fuzzy-TOPSIS, since the proposed maturity model has only qualitative variables. The Fuzzy methodology allows the transformation of qualitative variables into numerical variables. The Fuzzy-TOPSIS method was created by Chen (2000) and consists of a version of the TOPSIS method to be used when the decision-maker needs to use linguistic values based on a scale. The Fuzzy-TOPSIS method was created by Chen (2000) and consists of a version of the TOPSIS method to be used when the decision-maker needs to use linguistic values based on a scale. The methodology allows the decision-maker to identify the best alternatives concerning its approximation with the positive ideal solution (PIS) and greater distance from the negative ideal solution (NIS).
Here, the maturity model is applied to the evaluation alternatives. Reference DIPAT $(A_r)$, Real DIPAT $(A)$, and Utopian DIPAT $(A^+)$. The Utopian DIPAT is the ideal DIPAT, that is, the best possible alternative.
Subsequently, the decision matrix must be filled by the decision-maker, who chooses a linguist variable for each criterion. This linguistic variable is used to represent the importance of the criteria and the classifications of the alternatives regarding the qualitative criteria. All linguistic variable options are expressed by positive trapezoidal fuzzy numbers, where the weight of the importance of each criterion is attributed directly or indirectly using the paired comparison (CHEN; LIN; HUANG, 2006; COOK, 1992), as expressed in Table III (Chen, 2000).
Tabela III: Linguistic Variables
<table><tr><td>Linguistic Variables</td><td>Fuzzy Numbers (a_ij, b_ij, c_ij, d_ij)</td></tr><tr><td>Verylow(VL)</td><td>(0,0,1,2)</td></tr><tr><td>low(L)</td><td>(1,2,2,3)</td></tr><tr><td>Mediumlow(ML)</td><td>(2,3,4,5)</td></tr><tr><td>Medium(M)</td><td>(4,5,5,6)</td></tr><tr><td>Medium high (MH)</td><td>(5,6,7,8)</td></tr><tr><td>high (H)</td><td>(7,8,8,9)</td></tr><tr><td>Very high (VH)</td><td>(8,9,10,10)</td></tr></table>
Therefore, the decision matrix is building by transforming linguistic variables into fuzzy trapezoidal numbers, using Table III as a reference. When there is more than one decision-maker, everyone should build their decision matrix, and a simple arithmetic average should be applied to obtain a single fuzzy result for each criterion, base on Tan et al. (2010) methodology.
Subsequently, the next step consists of determining the maximum numerical variable $(d_j^*)$ of the evaluation alternatives for each factor through the equation:
$$
d _ {j} ^ {*} = \begin{array}{l} m a x \\i \end{array} d _ {i j} \tag {9}
$$
The numerical decision matrix is normalized to obtain the matrix with fuzzy data through the equation:
$$
\tilde {r} _ {i j} = \left(\frac {a _ {i j}}{d _ {j} ^ {*}}, \frac {b _ {i j}}{d _ {j} ^ {*}}, \frac {c _ {i j}}{d _ {j} ^ {*}}, \frac {d _ {i j}}{d _ {j} ^ {*}}\right) \tag {10}
$$
The normalization method mentioned above is designed to preserve the property in which the elements $\tilde{r}_{ij},\forall i,j$ are standardized (normalized) trapezoidal fuzzy numbers(Chen et al., 2006). Then, considering the different importance of each criterion evaluated, the normalized fuzzy matrix should be weighted using the equations:
$$
\tilde {R} = \left[ \tilde {r} _ {i j} \right] _ {m x n} \tag {11}
$$
$$
\tilde {v} _ {i j} = \tilde {r} _ {i j} (.) \widetilde {w} _ {j} \tag {12}
$$
In the sequence, the next step in the TOPSIS method consists of calculating the positive ideal solution $(\mathsf{A}^*)$ and negative ideal $(\mathsf{A}^{-})$ for each criterion. In this study, the positive ideal solution is the maximum weight, considering that the ideal scenario is to reach the highest score of each criterion; and the negative ideal solution is 0 since the un-ideal scenario is the minimum score.
Then it is necessary to calculate the distance between each alternative from the positive ideal solution $(d_i^*)$ and the negative ideal solution $(d_i^-)$, through the equations:
$$
d _ {i} ^ {*} = \sum_ {j = 1} ^ {n} d _ {v} \left(\tilde {v} _ {i j}, \tilde {v} _ {j} ^ {*}\right) \tag {13}
$$
$$
d _ {i} ^ {-} = \sum_ {j = 1} ^ {n} d _ {v} \left(\tilde {v} _ {i j}, \tilde {v} _ {j} ^ {-}\right) \tag {14}
$$
where $d_v(.,.)$ is the distance measured between the two fuzzy numbers (Chen et al., 2006).
With the values of the distances of each alternative, the proximity coefficient $(CC_{i})$ can be calculated. The $CC_{i}$ The CCI determines the classification order of all alternatives, representing the distances from $A^{*}$ and $A^{-}$ simultaneously, bringing relative proximity to the positive ideal fuzzy solution. It is calculated by the equation:
$$
C C _ {i} = \frac {d _ {i} ^ {-}}{d _ {i} ^ {*} + d _ {i} ^ {-}} \tag {15}
$$
It is observed that $CC_{I} = 1$ if $A_{I} = A^{*}$ and $CC_{i} = 0$ if $A_{i} = A^{-}$. In other words, $CC_{I} = 1$ when the alternative is closer to $A^{*}$ and further away from $A^{-}$. Thus, once the set of alternatives is classified, it is possible to select the best among a set of viable alternatives (Chen et al., 2006).
Base on this result, the maturity level can be calculated using the synthetic indicator proposed by Aragão (2020), through the equation:
$$
I _ {\text{maturity}} = \frac{A _ {n}}{A _ {+}} \tag{16}
$$
where $A_{n}$ is the $CC_{i}$ value of the alternative to be evaluated (Reference DIPAT and Real DIPAT), and $A^{+}$ is the $CC_{i}$ of the Utopian alternative.
From the synthetic indicator, it is possible to determine the maturity level (Table II). Table IV shows the values of each maturity level base on the methodology proposed by Aragão (2020).
Table IV: Maturity Level Values
<table><tr><td>Level</td><td>Values</td><td>Qualitative Evaluation</td></tr><tr><td>5</td><td>>0,90</td><td>Optimized</td></tr><tr><td>4</td><td>0,90 - 0,75</td><td>Managed</td></tr><tr><td>3</td><td>0,75 - 0,50</td><td>Defined</td></tr><tr><td>2</td><td>0,50 - 0,25</td><td>Repetitive</td></tr><tr><td>1</td><td><0,25</td><td>Initial</td></tr></table>
Finally, to identify which capabilities should be treated with priority by Real DIPAT (A), the proximity index is calculated using the equation:
$$
I _ {\text{proximity}} = A _ {R} * - A _ {A} * \tag{17}
$$
where $A_R^*$ represents the value of the ideal solution from Reference DIPAT ( $A_r$ ) and $A_A^*$ represents the ideal solution of Real DIPAT (A).
The maturity index determines how close to Real DIPAT it is to Reference DIPAT concerning its process management capabilities. Base on this, the methodology proposes improvements to the process to reach a higher maturity level, which makes the model prescriptive.
### c) Model Prescription
To determine the model prescription, it is analyzed the characteristics of each capacity and factors of the BPM-CF model, presented by Rosemann et al. (2006), the PEMM model described by Hammer (2007), and the characteristics of the maturity levels, according to Rosemann et al. (2006). For more details on the prescriptiveness of the proposed model, one can see Appendix 2 (prescriptions for reaching levels 2 and 3) and section 5.2 (prescription for reaching levels 4 and 5).
## IV. APPLICATION
### a) Determining the Weight of the Criteria
Table V: Consistency of AHP Results <table> <tr><td>Decisors</td><td>Consistency Rate</td><td>Result</td></tr> <tr><td>Decisionmaker 1</td><td>0,02980</td><td>Consistent</td></tr> <tr><td>Decisionmaker 2</td><td>0,06825</td><td>Consistent</td></tr> <tr><td>Decisionmaker 3</td><td>0,08296</td><td>Consistent</td></tr> <tr><td>Decisionmaker 4</td><td>0,09780</td><td>Consistent</td></tr> <tr><td>Decisionmaker 5</td><td>0,05995</td><td>Consistent</td></tr> <tr><td>Decisionmaker 6</td><td>0,07847</td><td>Consistent</td></tr> <tr><td>Decisionmaker 7</td><td>0,08344</td><td>Consistent</td></tr> <tr><td>Decisionmaker 8</td><td>0,08183</td><td>Consistent</td></tr> <tr><td>Decisionmaker 9</td><td>0,09472</td><td>Consistent</td></tr> <tr><td>Decisionmaker 10</td><td>0</td><td>Consistent</td></tr> <tr><td>Decisionmaker 11</td><td>0,50702</td><td>inconsistent</td></tr> </table>
<table> <tr><td>Decisors</td><td>Consistency Rate</td><td>Result</td></tr> <tr><td>Decisionmaker 1</td><td>0,02980</td><td>Consistent</td></tr> <tr><td>Decisionmaker 2</td><td>0,06825</td><td>Consistent</td></tr> <tr><td>Decisionmaker 3</td><td>0,08296</td><td>Consistent</td></tr> <tr><td>Decisionmaker 4</td><td>0,09780</td><td>Consistent</td></tr> <tr><td>Decisionmaker 5</td><td>0,05995</td><td>Consistent</td></tr> <tr><td>Decisionmaker 6</td><td>0,07847</td><td>Consistent</td></tr> <tr><td>Decisionmaker 7</td><td>0,08344</td><td>Consistent</td></tr> <tr><td>Decisionmaker 8</td><td>0,08183</td><td>Consistent</td></tr> <tr><td>Decisionmaker 9</td><td>0,09472</td><td>Consistent</td></tr> <tr><td>Decisionmaker 10</td><td>0</td><td>Consistent</td></tr> <tr><td>Decisionmaker 11</td><td>0,50702</td><td>inconsistent</td></tr> </table>
This was followed by the application of the entropy method by filling in the decision matrix with the priority vectors of each decision maker, resulting in Table VI.
Table VI: AHP Decisionmatrix
<table><tr><td></td><td>StrategicAlignment</td><td>Governance</td><td>Methods</td><td>IT</td><td>People</td><td>Culture</td></tr><tr><td>Decisionmaker1</td><td>0,153618968</td><td>0,17818011</td><td>0,1946722</td><td>0,1946722</td><td>0,22785679</td><td>0,05099973</td></tr><tr><td>Decisionmaker2</td><td>0,081897082</td><td>0,49901384</td><td>0,06111282</td><td>0,11213032</td><td>0,12292297</td><td>0,12292297</td></tr><tr><td>Decisionmaker3</td><td>0,22024</td><td>0,23683</td><td>0,18233</td><td>0,04453</td><td>0,23229</td><td>0,08378</td></tr><tr><td>Decisionmaker4</td><td>0,040505325</td><td>0,28220836</td><td>0,13075129</td><td>0,16244427</td><td>0,35509583</td><td>0,02899493</td></tr><tr><td>Decisionmaker5</td><td>0,184814832</td><td>0,21711734</td><td>0,1569437</td><td>0,24941985</td><td>0,10291097</td><td>0,0887933</td></tr><tr><td>Decisionmaker6</td><td>0,154532553</td><td>0,26187292</td><td>0,04423887</td><td>0,28042254</td><td>0,10630691</td><td>0,15262621</td></tr><tr><td>Decisionmaker7</td><td>0,062808121</td><td>0,05382998</td><td>0,20030112</td><td>0,21747771</td><td>0,4096101</td><td>0,05597297</td></tr><tr><td>Decisionmaker8</td><td>0,093849867</td><td>0,10615536</td><td>0,33528473</td><td>0,27381347</td><td>0,12011584</td><td>0,07078074</td></tr><tr><td>Decisionmaker9</td><td>0,397100587</td><td>0,16655904</td><td>0,15180675</td><td>0,1086708</td><td>0,103581</td><td>0,07228183</td></tr><tr><td>Decisionmaker10</td><td>0,192307692</td><td>0,19230769</td><td>0,19230769</td><td>0,19230769</td><td>0,19230769</td><td>0,03846154</td></tr></table>
Subsequently, the decision matrix was normalized using equations (3) and (4), obtaining the results shown in Table VII.
Table VII: Normalization of the AHP Decision Matrix <table> <tr> <td></td> <td>Strategic Alignment</td> <td>Governance</td> <td>Methods</td> <td>IT</td> <td>People</td> <td>Culture</td> </tr> <tr> <td>Decisionmaker 1</td> <td>0,097</td> <td>0,081</td> <td>0,118</td> <td>0,106</td> <td>0,115</td> <td>0,067</td> </tr> <tr> <td>Decisionmaker 2</td> <td>0,052</td> <td>0,227</td> <td>0,037</td> <td>0,061</td> <td>0,062</td> <td>0,161</td> </tr> <tr> <td>Decisionmaker 3</td> <td>0,139</td> <td>0,108</td> <td>0,111</td> <td>0,024</td> <td>0,118</td> <td>0,109</td> </tr> <tr> <td>Decisionmaker 4</td> <td>0,026</td> <td>0,129</td> <td>0,079</td> <td>0,088</td> <td>0,180</td> <td>0,038</td> </tr> <tr> <td>Decisionmaker 5</td> <td>0,117</td> <td>0,099</td> <td>0,095</td> <td>0,136</td> <td>0,052</td> <td>0,116</td> </tr> <tr> <td>Decisionmaker 6</td> <td>0,098</td> <td>0,119</td> <td>0,027</td> <td>0,153</td> <td>0,054</td> <td>0,199</td> </tr> <tr> <td>Decisionmaker 7</td> <td>0,040</td> <td>0,025</td> <td>0,121</td> <td>0,118</td> <td>0,208</td> <td>0,073</td> </tr> <tr> <td>Decisionmaker 8</td> <td>0,059</td> <td>0,048</td> <td>0,203</td> <td>0,149</td> <td>0,061</td> <td>0,092</td> </tr> <tr> <td>Decisionmaker 9</td> <td>0,251</td> <td>0,076</td> <td>0,092</td> <td>0,059</td> <td>0,052</td> <td>0,094</td> </tr> <tr> <td>Decisionmaker 10</td> <td>0,122</td> <td>0,088</td> <td>0,117</td> <td>0,105</td> <td>0,097</td> <td>0,050</td> </tr> </table>
<table> <tr> <td></td> <td>Strategic Alignment</td> <td>Governance</td> <td>Methods</td> <td>IT</td> <td>People</td> <td>Culture</td> </tr> <tr> <td>Decisionmaker 1</td> <td>0,097</td> <td>0,081</td> <td>0,118</td> <td>0,106</td> <td>0,115</td> <td>0,067</td> </tr> <tr> <td>Decisionmaker 2</td> <td>0,052</td> <td>0,227</td> <td>0,037</td> <td>0,061</td> <td>0,062</td> <td>0,161</td> </tr> <tr> <td>Decisionmaker 3</td> <td>0,139</td> <td>0,108</td> <td>0,111</td> <td>0,024</td> <td>0,118</td> <td>0,109</td> </tr> <tr> <td>Decisionmaker 4</td> <td>0,026</td> <td>0,129</td> <td>0,079</td> <td>0,088</td> <td>0,180</td> <td>0,038</td> </tr> <tr> <td>Decisionmaker 5</td> <td>0,117</td> <td>0,099</td> <td>0,095</td> <td>0,136</td> <td>0,052</td> <td>0,116</td> </tr> <tr> <td>Decisionmaker 6</td> <td>0,098</td> <td>0,119</td> <td>0,027</td> <td>0,153</td> <td>0,054</td> <td>0,199</td> </tr> <tr> <td>Decisionmaker 7</td> <td>0,040</td> <td>0,025</td> <td>0,121</td> <td>0,118</td> <td>0,208</td> <td>0,073</td> </tr> <tr> <td>Decisionmaker 8</td> <td>0,059</td> <td>0,048</td> <td>0,203</td> <td>0,149</td> <td>0,061</td> <td>0,092</td> </tr> <tr> <td>Decisionmaker 9</td> <td>0,251</td> <td>0,076</td> <td>0,092</td> <td>0,059</td> <td>0,052</td> <td>0,094</td> </tr> <tr> <td>Decisionmaker 10</td> <td>0,122</td> <td>0,088</td> <td>0,117</td> <td>0,105</td> <td>0,097</td> <td>0,050</td> </tr> </table>
Then, entropy was calculated using equations (5), (6), (7) and (8). Table VIII presents the results.
Table VIII: Capacity Weight
<table><tr><td></td><td>Strategic Alignment</td><td>Governance</td><td>Methods</td><td>IT</td><td>People</td><td>Culture</td></tr><tr><td>Ej</td><td>1,186</td><td>1,213</td><td>1,222</td><td>1,234</td><td>1,213</td><td>1,226</td></tr><tr><td>Dj</td><td>-0,186</td><td>-0,213</td><td>-0,222</td><td>-0,234</td><td>-0,213</td><td>-0,226</td></tr><tr><td>λi(weight)</td><td>0,144</td><td>0,165</td><td>0,171</td><td>0,181</td><td>0,164</td><td>0,174</td></tr></table>
According to the decision makers, the most important capacities for assessing maturity in process management in the sectors that perform their functions (DIPAT) are, respectively: information technology, culture, methods, governance, people and strategic alignment. From the weights of capacities, the weights of the respective factors were assigned with a simple arithmetic mean, as shown in Table IX
<table><tr><td>Capabilities Andfactors</td><td>Weights</td></tr><tr><td>StrategicAlignment</td><td>0,144</td></tr><tr><td>Factors1,2,3 e 4</td><td>0,036</td></tr><tr><td>Governance</td><td>0,165</td></tr><tr><td>Fator 5,6,7 e 8</td><td>0,041</td></tr><tr><td>Methods</td><td>0,171</td></tr><tr><td>Factors9,10,11,12 e 13</td><td>0,034</td></tr><tr><td>IT</td><td>0,181</td></tr><tr><td>Factors14,15,16 e 17</td><td>0,045</td></tr><tr><td>People</td><td>0,164</td></tr><tr><td>Factors18,19,20,21 e 22</td><td>0,033</td></tr><tr><td>Culture</td><td>0,174</td></tr><tr><td>Factors23,24,25,26 e 27</td><td>0,035</td></tr></table>
<table><tr><td>Capabilities Andfactors</td><td>Weights</td></tr><tr><td>StrategicAlignment</td><td>0,144</td></tr><tr><td>Factors1,2,3 e 4</td><td>0,036</td></tr><tr><td>Governance</td><td>0,165</td></tr><tr><td>Fator 5,6,7 e 8</td><td>0,041</td></tr><tr><td>Methods</td><td>0,171</td></tr><tr><td>Factors9,10,11,12 e 13</td><td>0,034</td></tr><tr><td>IT</td><td>0,181</td></tr><tr><td>Factors14,15,16 e 17</td><td>0,045</td></tr><tr><td>People</td><td>0,164</td></tr><tr><td>Factors18,19,20,21 e 22</td><td>0,033</td></tr><tr><td>Culture</td><td>0,174</td></tr><tr><td>Factors23,24,25,26 e 27</td><td>0,035</td></tr></table>
### b) Application of the Maturity Model
First, the model's qualitative variables (factors) were converted to linguistic variables, based on Table III. The linguistic variables used in the model are described in Table X.
Table X: Linguistic Variables of the Proposed BPMMM
<table><tr><td>Linguistic Variables</td><td>Code</td><td colspan="4">FUZZY Number</td></tr><tr><td>Veryrare</td><td>VR</td><td>0</td><td>0</td><td>1</td><td>2</td></tr><tr><td>Rare</td><td>R</td><td>1</td><td>2</td><td>2</td><td>3</td></tr><tr><td>Mediumrare</td><td>MR</td><td>2</td><td>3</td><td>4</td><td>5</td></tr><tr><td>Medium</td><td>M</td><td>4</td><td>5</td><td>5</td><td>6</td></tr><tr><td>Frequentmedium</td><td>FM</td><td>5</td><td>6</td><td>7</td><td>8</td></tr><tr><td>Frequent</td><td>F</td><td>7</td><td>8</td><td>8</td><td>9</td></tr><tr><td>Veryfrequent</td><td>VF</td><td>8</td><td>9</td><td>10</td><td>10</td></tr></table>
The linguistic variables were obtained and the result was transferred to the decision matrix represented by Table XI. For Utopian DIPAT $A^{+}$, os values correspond to the best alternatives for each factor, considering that $A^{+}$ would be an ideal DIPAT (maximum level of maturity).
Table XI: Decision Matrix of Linguistic Variables
<table><tr><td>Factors</td><td>A+</td><td>Ar</td><td>A(D1)</td><td>A(D2)</td><td>A(D3)</td><td>A(D4)</td><td>A(D5)</td></tr><tr><td>Factor 1</td><td>VF</td><td>MR</td><td>R</td><td>FM</td><td>MR</td><td>FM</td><td>M</td></tr><tr><td>Factor 2</td><td>VF</td><td>M</td><td>M</td><td>M</td><td>FM</td><td>M</td><td>VR</td></tr><tr><td>Factor3</td><td>VF</td><td>FM</td><td>M</td><td>M</td><td>FM</td><td>M</td><td>M</td></tr><tr><td>Factor4</td><td>VF</td><td>VF</td><td>M</td><td>M</td><td>MR</td><td>FM</td><td>F</td></tr><tr><td>Factor5</td><td>VF</td><td>R</td><td>MR</td><td>M</td><td>MR</td><td>MR</td><td>F</td></tr><tr><td>Factor6</td><td>VF</td><td>F</td><td>F</td><td>FM</td><td>F</td><td>FM</td><td>VF</td></tr><tr><td>Factor7</td><td>VF</td><td>FM</td><td>M</td><td>M</td><td>FM</td><td>FM</td><td>VF</td></tr><tr><td>Factor8</td><td>VF</td><td>FM</td><td>M</td><td>MR</td><td>FM</td><td>M</td><td>F</td></tr><tr><td>Factor9</td><td>VF</td><td>M</td><td>M</td><td>MR</td><td>FM</td><td>F</td><td>F</td></tr><tr><td>Factor10</td><td>VF</td><td>F</td><td>F</td><td>FM</td><td>VF</td><td>FM</td><td>VF</td></tr><tr><td>Factor11</td><td>VF</td><td>FM</td><td>F</td><td>FM</td><td>F</td><td>MR</td><td>FM</td></tr><tr><td>Factor12</td><td>VF</td><td>VR</td><td>R</td><td>F</td><td>M</td><td>FM</td><td>F</td></tr><tr><td>Factor13</td><td>VF</td><td>M</td><td>R</td><td>FM</td><td>R</td><td>MR</td><td>F</td></tr><tr><td>Factor14</td><td>VF</td><td>M</td><td>F</td><td>FM</td><td>F</td><td>F</td><td>VF</td></tr><tr><td>Factor15</td><td>VF</td><td>M</td><td>M</td><td>F</td><td>FM</td><td>FM</td><td>FM</td></tr><tr><td>Factor16</td><td>VF</td><td>M</td><td>MR</td><td>F</td><td>FM</td><td>F</td><td>M</td></tr><tr><td>Factor17</td><td>VF</td><td>MR</td><td>MR</td><td>F</td><td>FM</td><td>FM</td><td>VF</td></tr><tr><td>Factor18</td><td>VF</td><td>F</td><td>F</td><td>F</td><td>FM</td><td>F</td><td>FM</td></tr><tr><td>Factor19</td><td>VF</td><td>F</td><td>FM</td><td>M</td><td>R</td><td>VF</td><td>VF</td></tr><tr><td>Factor20</td><td>VF</td><td>F</td><td>FM</td><td>M</td><td>F</td><td>F</td><td>F</td></tr><tr><td>Factor21</td><td>VF</td><td>F</td><td>FM</td><td>M</td><td>F</td><td>F</td><td>F</td></tr><tr><td>Factor22</td><td>VF</td><td>F</td><td>F</td><td>F</td><td>F</td><td>F</td><td>F</td></tr><tr><td>Factor23</td><td>VF</td><td>F</td><td>F</td><td>FM</td><td>R</td><td>R</td><td>F</td></tr><tr><td>Factor24</td><td>VF</td><td>FM</td><td>F</td><td>VF</td><td>MR</td><td>MR</td><td>F</td></tr><tr><td>Factor25</td><td>VF</td><td>FM</td><td>F</td><td>F</td><td>MR</td><td>M</td><td>M</td></tr><tr><td>Factor26</td><td>VF</td><td>FM</td><td>F</td><td>FM</td><td>VF</td><td>F</td><td>F</td></tr><tr><td>Factor27</td><td>VF</td><td>F</td><td>F</td><td>F</td><td>MR</td><td>F</td><td>FM</td></tr></table>
The next step consisted of transforming linguistic variables into trapezoidal fuzzy numbers, taking Table III as a reference. With the fuzzy decision matrix completed, the methodology of Tan et al. (2010) to obtain the arithmetic mean of the data of the decision makers (D1, D2, D3, D4 and D5). Then, equation (9) was applied to determine the maximum numerical variable of the evaluation alternatives in each factor, and then equation (10) was applied to normalize it. Then, the matrix was normalized and weighted using equations (11) and (12), resulting in Table XII.
Table XII: Standardized and Weighted Fuzzy Decision Matrix
<table><tr><td>Factors</td><td>Weights</td><td>A+</td><td>Ar</td><td>A</td></tr><tr><td>Factor 1</td><td>0,036</td><td>(0,029; 0,032; 0,036; 0,036)</td><td>(0; 0,011; 0,014; 0,018)</td><td>(0; 0,016; 0,018; 0,022)</td></tr><tr><td>Factor 2</td><td>0,036</td><td>(0,029; 0,032; 0,036; 0,036)</td><td>(0,014; 0,018; 0,018; 0,022)</td><td>(0,012; 0,015; 0,017; 0,02)</td></tr><tr><td>Factor 3</td><td>0,036</td><td>(0,029; 0,032; 0,036; 0,036)</td><td>(0,018; 0,022; 0,025; 0,029)</td><td>(0,015; 0,019; 0,019; 0,023)</td></tr><tr><td>Factor 4</td><td>0,036</td><td>(0,029; 0,032; 0,036; 0,036)</td><td>(0,029; 0,032; 0,036; 0,036)</td><td>(0,016; 0,019; 0,021; 0,024)</td></tr><tr><td>Factor 5</td><td>0,041</td><td>(0,033; 0,037; 0,041; 0,041)</td><td>(0,004; 0,008; 0,008; 0,012)</td><td>(0,014; 0,018; 0,021; 0,025)</td></tr><tr><td>Factor 6</td><td>0,041</td><td>(0,033; 0,037; 0,041; 0,041)</td><td>(0,029; 0,033; 0,033; 0,037)</td><td>(0,026; 0,031; 0,033; 0,036)</td></tr><tr><td>Factor 7</td><td>0,041</td><td>(0,033; 0,037; 0,041; 0,041)</td><td>(0,021; 0,025; 0,029; 0,033)</td><td>(0,021; 0,026; 0,028; 0,031)</td></tr><tr><td>Factor 8</td><td>0,041</td><td>(0,033; 0,037; 0,041; 0,041)</td><td>(0,021; 0,025; 0,029; 0,033)</td><td>(0,018; 0,022; 0,024; 0,28)</td></tr><tr><td>Factor 9</td><td>0,034</td><td>(0,027; 0,031; 0,034; 0,034)</td><td>(0,014; 0,017; 0,017; 0,021)</td><td>(0,017; 0,021; 0,022; 0,025)</td></tr><tr><td>Factor 10</td><td>0,034</td><td>(0,027; 0,031; 0,034; 0,034)</td><td>(0,024; 0,027; 0,027; 0,031)</td><td>(0,023; 0,026; 0,029; 0,031)</td></tr><tr><td>Factor 11</td><td>0,034</td><td>(0,027; 0,031; 0,034; 0,034)</td><td>(0,017; 0,021; 0,024; 0,027)</td><td>(0,018; 0,021; 0,023; 0,027)</td></tr><tr><td>Factor 12</td><td>0,034</td><td>(0,027; 0,031; 0,034; 0,034)</td><td>(0; 0,003; 0,007)</td><td>(0,016; 0,02; 0,021; 0,024)</td></tr><tr><td>Factor 13</td><td>0,034</td><td>(0,027; 0,031; 0,034; 0,034)</td><td>(0,014; 0,017; 0,017; 0,021)</td><td>(0,011; 0,014; 0,016; 0,019)</td></tr><tr><td>Factor 14</td><td>0,045</td><td>(0,036; 0,041; 0,045; 0,045)</td><td>(0,018; 0,023; 0,023; 0,027)</td><td>(0,024; 0,028; 0,031; 0,035)</td></tr><tr><td>Factor 15</td><td>0,045</td><td>(0,036; 0,041; 0,045; 0,045)</td><td>(0,018; 0,023; 0,023; 0,027)</td><td>(0,023; 0,027; 0,029; 0,034)</td></tr><tr><td>Factor 16</td><td>0,045</td><td>(0,036; 0,041; 0,045; 0,045)</td><td>(0,018; 0,023; 0,023; 0,027)</td><td>(0,024; 0,029; 0,033; 0,036)</td></tr><tr><td>Factor 17</td><td>0,045</td><td>(0,036; 0,041; 0,045; 0,045)</td><td>(0,009; 0,014; 0,018; 0,023)</td><td>(0,024; 0,029; 0,033; 0,036)</td></tr><tr><td>Factor 18</td><td>0,033</td><td>(0,036; 0,030; 0,033; 0,033)</td><td>(0,023; 0,026; 0,026; 0,03)</td><td>(0,02; 0,024; 0,025; 0,028)</td></tr><tr><td>Factor 19</td><td>0,033</td><td>(0,036; 0,030; 0,033; 0,033)</td><td>(0,023; 0,026; 0,026; 0,03)</td><td>(0,017; 0,02; 0,022; 0,024)</td></tr></table>
Therefore, the ideal and anti-ideal distance was calculated using equations (13) and (14). For the ideal solution, we considered the factor weights and, for the anti-ideal solution, weight 0 was considered.
In the final step, the proximity coefficient $CC_{i}$ was calculated using equation (15). From the proximity coefficient, the maturity level of each evaluation alternative was also calculated using equation (16), as shown in Table XIII.
Table XIII: Proximity Coefficient and Maturity Level
<table><tr><td>Evaluation Alternatives</td><td>d*</td><td>d-</td><td>CCi</td><td>Maturity Index</td></tr><tr><td>Utopian DIPAT A+</td><td>0,141</td><td>1,723</td><td>0,924</td><td>1</td></tr><tr><td>Reference DIPAT Ar</td><td>0,677</td><td>1,154</td><td>0,630</td><td>0,68</td></tr><tr><td>Real DIPAT A</td><td>0,627</td><td>1,199</td><td>0,657</td><td>0,71</td></tr></table>
## V. ANALYSIS OF RESULTS
### a) Analysis of the Maturity Level
Based on Table IV, Real DIPAT A presented a maturity level 3. Therefore, it presents a "defined" maturity, with actions in search of building and developing the capacity of process management and expanding the individuals who analyze the organization of a company. process perspective.
Generally, the sector with a level 3 maturity has the combination of the following characteristics (Rosemann et al., 2006): (i) use of elaborate tools (for example, process redesign, workflow management and risk management based on in processes); (ii) combination of different process management methods and tools; (iii) wider use of technology for delivery and communication about processes (for example, process designs available to users via the intranet); and (iv) comprehensive and formal training.
Reference DIPAT $A_{r}$ also presented maturity level 3 and Utopian DIPAT $A^{+}$ presented maturity level 5 (optimized), as this alternative serves as the basis for calculating the maturity index. Figure 2 shows the graph on the maturity level of each analyzed DIPAT.
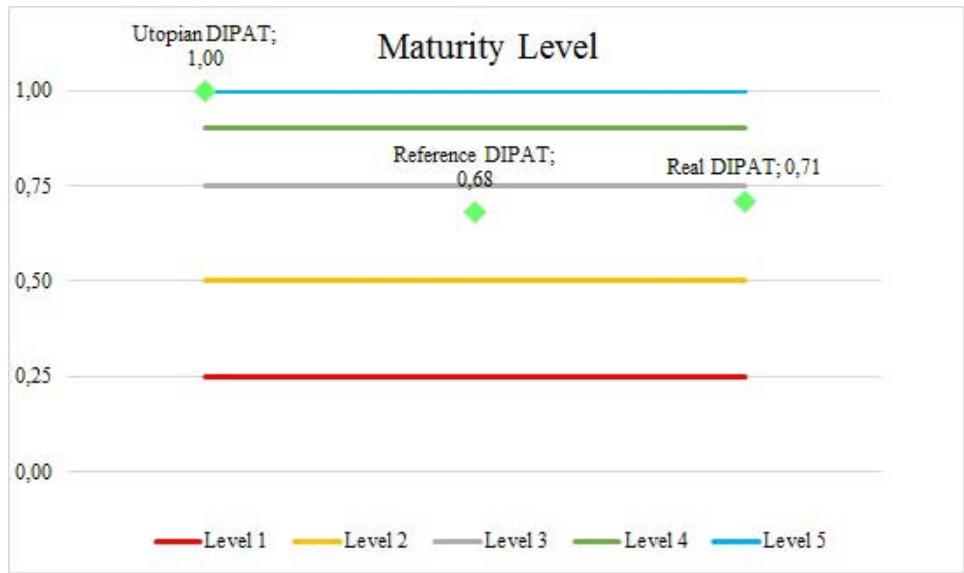 Figure 2: Maturity Level
### b) Improvement Prescriptions
For the proposed maturity model to be considered prescriptive, it is necessary to drive improvements so that the researched sector is able to reach higher maturity levels.
For this purpose, equation (17) was used to identify which capacities should be prioritized for the improvement of the Real DIPAT, in comparison with the Reference DIPAT. For the interpretation of the proximity index, it is considered: (i) for capacities with values equal to 0, the Reference DIPAT and Real DIPAT have the same performances; (ii) for capacities with values $>0$, Real DIPAT outperforms Reference DIPAT; and (iii) for capacities with values $<0$, Real DIPAT has lower performances than Reference DIPAT.
With the application of the proximity index, the results of Table XIV were obtained.
Table XIV: Proximity Index
<table><tr><td></td><td>Strategic Alignment</td><td>Governance</td><td>Methods</td><td>IT</td><td>People</td><td>Culture</td></tr><tr><td>Reference DIPAT</td><td>0,098</td><td>0,121</td><td>0,148</td><td>0,169</td><td>0,055</td><td>0,086</td></tr><tr><td>Real DIPAT</td><td>0,126</td><td>0,110</td><td>0,112</td><td>0,097</td><td>0,063</td><td>0,105</td></tr><tr><td>Proximity index</td><td>-0,028</td><td>0,011</td><td>0,036</td><td>0,072</td><td>-0,008</td><td>-0,019</td></tr></table>
After the results, it was possible to observe that the strategic alignment, culture and people capacities showed lower performances in the Real DIPAT compared to the Reference DIPAT, with indexes of -0.028, -0.019 and -0.008, respectively. In contrast, the governance, methods and information technology capabilities performed better at Real DIPAT compared to Reference DIPAT, with rates of 0.011, 0.036 and 0.072, respectively.
The Figure 3 illustrates the proximity indexes and the performance of the assessed capacities of Real DIPAT compared to Reference DIPAT.
 Figure 3: Proximity Index
The results of the proximity indexes made it possible to create an order of priority for the application of improvements, making it possible to continuously improve performance and increase the level of maturity in DIPAT Real's process management. Following are the descriptions of continuous improvement in process management for Real DIPAT, so that it progressively raises its maturity level.
To reach maturity level 4 (managed), the requirements for each capacity follow the order of priority:
Strategic Alignment: measure all processes and monitor their performance, even if in isolation;
discuss plans for process improvement in conjunction with other sectors; model processes taking into account executors and other stakeholders and; support improvement plans for process management.
Culture: management must be prepared for major multidimensional changes; stakeholders in the processes must accept the changes and initiate an increasing adaptation to them; management must seek actions for process management, seeking to exaggerate its benefits; all stakeholders in the processes must contribute to the smooth running of the processes; the leadership must seek more actions in the management of the processes, adopting a holistic (global) view of the institution.
- People: The sector must have skilled employees in the execution and management of its processes; provide training courses to civil servants for new knowledge and skills relevant to the processes, when possible; work as a team in the execution and in the process improvement projects, in order to achieve the desired results; the employees and the management must be responsible for the results of the processes, and the management must also propose improvements to achieve the desired results and; the head of the sector must delegate control and authority to the executors of the processes.
- Governance: Discuss some strategies that can contribute to the improvement of processes; formalize the role of each server in the process, with the attribution of autonomy to act; model processes at the sectoral level and extend to other stakeholders and; exercise formal control over all processes in the sector.
- Methods: Design the processes so that they fit with other processes of the institution; document the processes in an electronic and standardized manner; implement and execute the documented processes in a standardized manner; control and measure critical processes and; establish methods to be used in the improvement of processes.
- Information Technology: Using an integrated IT system, designed with the processes and adhering to industry standards to support the processes; make equipment and software available that provide specific reports to support the processes; control and measure industry processes with independent IT systems and; apply process improvement and innovation projects supported by an independent IT system.
To reach level 5 of maturity (optimized), the requirements for each capacity follow the order of priority:
- Strategic Alignment: Measure all processes, monitor their performance and align them between the sector's operational and strategic team; make process improvement plans part of the sector's strategic cycle; model processes based on the expectations of all stakeholders and; carry out the integration between management and executors, so that the improvement plans are defined together.
- Culture: Management must recognize that changes are inevitable for the improvement of processes, provide their support and adopt them whenever necessary; management must recognize the importance and benefits of processes, so that their management actions must be process-oriented; all
parts of the processes must be interested in its good progress, proposing improvements and contributing to them and; the leadership must act oriented by the processes and have a holistic (global) view of the institution.
- People: The sector must have servers skilled in the execution and management of large-scale processes; provide training to servers to maintain knowledge and skills relevant to the processes, making them skilled in their execution and management; work as a team with other sectors/departments in order to achieve the desired results of the processes; employees and management must be responsible for the results of the processes, proposing improvements to achieve increasingly better results and; leadership must delegate authority to process executors through leadership based on vision and influence, rather than command and control.
- Governance: Discuss strategies and action plans to improve the critical processes in the sector; each servant must exercise his responsibility and assume roles, have autonomy to act, while the head.
### c) Practical Implications
From the results, the AHP method was considered efficient for the analysis and weighting of capacity weights. The fuzzy-TOPSIS method was able to generate a synthetic indicator for the measurement of the maturity level from the data of the alternatives Utopian DIPAT, Reference DIPAT and Real DIPAT.
The scientific literature (BRUIN et al., 2005) points out that a maturity model can be applied for descriptive, prescriptive and comparative purposes. The results obtained in this study, shows that there is a possibility of application for the three purposes, since it enabled the assessment of the current state of maturity of the process management (descriptive); enabled the identification of desirable levels of future maturity, providing guidance for the implementation of improvements (prescriptive); and allowed a comparative analysis between two sectors of different campuses of a federal public university (comparative). In addition, the model can be used in practice as a guide for advances in the performance of processes by any sector and/or institution, public and private; because its generic structure allows its use for the measurement of any process or set of processes.
The quantitative evaluation of the model to obtain the result of the maturity level and prescription of improvements also contributes to its periodic application in practice; as it allows for agile and reliable results, as it is an evaluation with methodological rigor, and allows anyone to apply it, eliminating the need for application by professionals in the process area.
Its prescription in order of priority allows managers to analyze which capacities are in a critical state of performance, making it possible to take better targeted actions, according to the reality of each organization.
## VI. CONCLUSIONS
This study offers a maturity model in BPM, whose main objective is to fill the gaps found in the literature: proposal of maturity models based on the consolidation of existing models, scarcity of BPMMM with prescriptive properties, over-complexity in the application and low flexibility existing models.
The objective of the study was accomplished, the model was structured based on two models of maturity in BPM consolidated from the literature: BPM-CF and PEMM. The model was built to propose continuous improvement actions that enable the achievement of higher levels of maturity gradually, showing a high prescriptive property. In addition, its quantitative assessment, using the methodology of Zola (2019) and Aragão (2020), allowed agility in the results and low complexity in the application, which makes the model applicable by any interested party, without the need of specialists in the area of processes or evaluators external. The proposal for quantitative evaluation gave methodological rigor to the model, minimizing possible subjectivities that could be qualitative models.
The use of the AHP method allowed decision-makers to analyze and consider the importance of each process management capacity, according to the reality of the assessed equity sector. Thus, assigning weights to the model's capabilities becomes a strong point; because each process has its peculiarities; that is, it is possible that each capacity has a different weight for the management of certain processes, as was the case with DIPAT, determining that the most important capacities for its processes, respectively: information technology, culture, methods, governance, people and strategic alignment.
As a result of its application, Real DIPAT presented a maturity level 3 (defined), characterized by actions in search of building and developing the capacity for process management and expansion of individuals who analyze the organization in a process perspective. In addition to the diagnosis of the level of maturity provided to the sector, the model also provided prescriptions for improving the performance of its process management.
The application of the Reference DIPAT maturity model was the basis for the comparison with the maturity of the management of Real DIPAT's processes. This enabled the comparative analysis of critical improvement factors and their prescription in order of priority.
In view of this comparison, the critical improvement capacities, when compared with Reference DIPAT, in order of priority, were: strategic alignment, culture and people. The information technology, methods and governance capabilities performed better at Real DIPAT when compared to Reference DIPAT.
The proposed BPMMM proved to be efficient for measuring the maturity of the processes of the property divisions in the two federal public universities. In addition, the model was able to be applied to assess the current state of maturity of process management (descriptive purpose); for the identification of desirable levels of future maturity, providing guidelines for the implementation of improvements (prescriptive purpose); and for the comparative analysis between two sectors of different campuses (comparative purpose).
Finally, this research contemplates both practical and managerial aspects, as well as theoretical and methodological aspects of process management; considering the construction of a prescriptive maturity model in process management with a multicriteria approach and proposal of prescriptions for continuous performance improvement. The model contributes to the analysis of the performance of processes, allowing their continuous improvement; it can be used in different processes, set of processes, sector and institutions, public or private, due to its flexibility.
As a suggestion for future research involving the theme, the effective application of the model's prescriptions and measurement of results in the impact of the maturity level would be an important complement to the study. In addition, it is also suggested to apply the model in other sectors or institutions, both public and private, to test its effectiveness when applied in processes other than those in the property sector.
Generating HTML Viewer...
References
29 Cites in Article
Omar Alshathry (2016). Business process management: a maturity assessment of Saudi Arabian organizations.
Tao Jiang,Yeyi Liu,Andyka Agassi (2003). Consumer’s Responses towards Online Review in Emerging Market: Evidence from Indonesia.
F Aragão (2020). Maturity model for smart cities: a multicriteria approach.
T Bruin,M Rosemann,R Freeze,U Kaulkarni (2005). Understanding the main phases of developing a maturity assessment model.
D Chiroli,É Solek,R Oliveira,B Barboza,R Campos,J Kovaleski,. Trojan,F (2022). Using multi-criteria analysis for smart city assessment.
C Chen (2000). Extensions of the TOPSIS for group decision making under fuzzy environment.
Chen-Tung Chen,Ching-Torng Lin,Sue-Fn Huang (2006). A fuzzy approach for supplier evaluation and selection in supply chain management.
Robert Cook (1992). Expert Systems in Purchasing: Applications and Development.
Fernanda De Boer,Cláudio Müller,Carla Ten Caten (2015). Assessment model for organizational business process maturity with a focus on BPM governance practices.
R Dijkman,S Lammers,A De Jong (2015). Properties that influence business process management maturity and its effect on organizational performance.
Manon Froger,Frederick Bénaben,Sébastien Truptil,Nicolas Boissel-Dallier (2019). A non-linear business process management maturity framework to apprehend future challenges.
M Hammer (2007). The process audit.
Eliana Lima,Renan Viegas,Ana Costa (2017). A multicriteria method based approach to the BPMM selection problem.
E Mahendrawathi,B Hanggara,H Astuti (2019). Model for BPM implementation assessment: evidence from companies in Indonesia.
Vinicius Mello,João Kovaleski,Fernanda Zola,Francisco Lima Junior,Franciely Aragão,Daiane Chiroli (2022). Proposal of a Fuzzy-QFD model for startup selection.
Maximilian Röglinger,Jens Pöppelbuß,Jörg Becker (2012). Maturity models in business process management.
M Rosemann,T Bruin (2005). Towards a business process managment maturity.
T Saaty (1980). the analytic hierarchy process.
T Saaty (1994). Fundamentals of decision making.
M Serrano,F Peral,F Casas,M Lozano (2011). Una revisión crítica para la construcción de indicadores sintéticos.
A Soares,J Kovaleski,S Gaia,D Chiroli (2020). Building sustainable development through technology transfer offices: An approach based on levels of maturity.
Yong‐tao Tan,Li‐yin Shen,Craig Langston,Yan Liu (2010). Construction project selection using fuzzy TOPSIS approach.
Ayca Tarhan,Oktay Turetken,Fadime Ilisulu (2015). Business Process Maturity Assessment: State of the Art and Key Characteristics.
Ayca Tarhan,Oktay Turetken,Hajo Reijers (2016). Business process maturity models: A systematic literature review.
Amy Van Looy,Manu De Backer,Geert Poels,Monique Snoeck (2013). Choosing the right business process maturity model.
Amy Van Looy (2019). Capabilities for managing business processes: a measurement instrument.
Milan Zeleny (1976). The Attribute-Dynamic Attitude Model (Adam).
Fernanda Zola,João Colmenero,Franciely Aragão,Thaisa Rodrigues,Aldo Junior (2019). Multicriterial model for selecting a charcoal kiln.
No ethics committee approval was required for this article type.
Data Availability
Not applicable for this article.
How to Cite This Article
Janaina Piana. 2026. \u201cInnovative Multicriteria Approach to Business Process Management Maturity in the Public Sector\u201d. Global Journal of Management and Business Research - A: Administration & Management GJMBR-A Volume 23 (GJMBR Volume 23 Issue A10): .
Explore published articles in an immersive Augmented Reality environment. Our platform converts research papers into interactive 3D books, allowing readers to view and interact with content using AR and VR compatible devices.
Your published article is automatically converted into a realistic 3D book. Flip through pages and read research papers in a more engaging and interactive format.
Purpose: The objective of this work is to propose a business process management maturity model (BPMMM), prescriptive and with multicriteria decision-making approach (MCDM). Design/Methodology/Approach: The relevant literature was examined to develop BPMMM. The Analytic Hierarchy Process (AHP) method was chosen to evaluate the weight of the capabilities. The Fuzzy Technique for Order Preference by Similarity to Ideal Solution (TOPSIS) method measured the maturity level. The model was applied in property divisions (DIPAT) of two federal universities (public institutions) with comparative and prescriptive purpose: Reference DIPAT and Real DIPAT. Findings: The AHP method allowed the analysis and weighting of capabilities. Fuzzy-TOPSIS has enabled the determination of maturity level effectively. As a result, Reference DIPAT and Real DIPAT obtained maturity level 3 (defined). Through comparative analysis, the critical factors for improvements in Real DIPAT were: strategic alignment, culture and people.
Our website is actively being updated, and changes may occur frequently. Please clear your browser cache if needed. For feedback or error reporting, please email [email protected]
Thank you for connecting with us. We will respond to you shortly.