
I. INTRODUCTION
The tire is a critical component of a vehicle. It is the only part that makes contact with the road surface and enables the engine's rotation to be converted into axial motion. The most commonly used type of tire is the pneumatic tire, which is filled with pressurized air to produce a certain level of stiffness that can be adjusted to meet the vehicle's needs. However, pneumatic tires have a well-known weakness: they can lose pressure due to air leaks or bursting, rendering the tire unusable. To address this issue, researchers have developed non-pneumatic tires (NPTs), which have been extensively studied since their introduction in 2005 [1].
Several spoke geometries had been proposed for NPTs, including the tweel, honeycomb, and Bridgestone designs [2]. According to previous research, the honeycomb structure provides more evenly distributed contact pressure, low rolling resistance, and high load capacity, making it a promising option for NPTs [3] and [4]. However, it is still unclear how NPTs will perform under dynamic loads, such as hard braking, and what types of stresses the spokes will experience [5]. In addition, maintaining a safe distance between vehicles is crucial for safe driving, especially during sudden braking. Vehicle weight, the center of gravity, coefficient of friction, wheelbase length, and other factors all play a role in determining the stopping distance of a vehicle [6]. The standard safe distance between cars at a given speed can be found in traffic safety guidelines [7]. Overall, the development of NPTs holds great potential for overcoming the weaknesses of conventional pneumatic tires. Further research is needed to obtain the benefits and potential drawbacks of NPTs, particularly under dynamic load conditions.
Recent studies have further emphasized the importance of maintaining a safe distance between vehicles. Muslim and Itoh (2019) investigated driver behavior during overtaking maneuvers, which can be particularly dangerous for drivers who fail to maintain a safe following distance. Benterki et al. (2021) developed a method for estimating driver intention to facilitate autonomous vehicles' safe and comfortable operation.
Fountas et al. (2020) found that visibility-related weather conditions can significantly affect the severity of crashes, highlighting the importance of maintaining a safe following distance in adverse weather conditions. Bunn et al. (2003) reviewed area-wide traffic calming measures for preventing traffic-related injuries, highlighting the importance of reducing speeds and providing clear signage and road markings to help drivers maintain a safe following distance.
The study by Feng et al. (2010) provides an in-depth exploration of the factors involved in calculating following safe distances and offers a new approach to addressing this important aspect of traffic safety. Tang (2017) investigates the impact of different vehicle operating parameters on braking distance, such as speed, brake force, road surface conditions, and vehicle load, which significantly impact braking distance.
Overall, the literature highlights the continued importance of maintaining a safe following distance for driving safety and suggests further research on the topic to understand better the impact of various factors on driving behavior and safety.
III. CALCULATION AND SIMULATION
Hard braking occurs when a vehicle is forced to stop at a shorter distance than it is safe. Hard braking can cause the vehicle to tip forward. Hard braking is done by pressing the brake pedal to the maximum, forcing the wheels to slide on the road. During hard braking, the position of the vehicle's center of gravity (CG), the friction coefficient between the road and the wheels, the wheelbase's length, and the vehicle's weight are essential factors that affect the stopping distance.
To calculate the CG and longitudinal load transfer, standard references such as Milliken and Milliken's (1995), Wong's (2002), and Kiencke and Nielsen's (2005) can be consulted. The simulation method and analysis can be based on Kohnke (2013), Bathe (2006), and Zienkiewicz et al. (2005). The equation for the center of gravity and longitudinal load transfer are shown in equations 1-3.
where,
: center of the mass point of an object in the -axis (m); : center of the mass point of an object in the -axis (m); : center of the mass point of an object in the -axis (m); : weight of the object (N).
Several variables, such as vehicle wheelbase length and weight, also affect the value of longitudinal load transfer, as shown in Figure 1 [20]. Equation 4 uses to calculate the amount of load transferred.
where, g: deceleration (g); w: vehicle weight (kg); h: height of the vehicle's center of gravity (mm); L: wheelbase length of the vehicle (mm).
![Figure 1: Free body Diagram Applied on the Vehicle During Braking [20]](https://doc.globaljournals.org/csnd11_55655/ocr/images/derivatives/a3/a3e928123a74c139170ca72d91206ca17fa07b2f93fd13e89b8f99ef13aa840e.webp)
The value of in calculating the longitudinal load transfer is the ratio of deceleration to acceleration due to gravity, which is . The variable that most affects the vehicle's deceleration value is the coefficient of friction between the tire and the road, as shown in equations 5-7.
where, m is the vehicle's mass (kg), a is the deceleration , g is the acceleration due to gravity , and is the coefficient of kinetic friction.
The NPT design with a honeycomb spokes model and 5 mm thickness by Sriwijaya and Hamzah (2019) is used as a reference for the study. The materials used for each component of the NPT are detailed in Table 1. A static simulation was performed on the NPT with a vehicle weight of 8000 N. The simulation's output was then compared to the results of previous research to achieve an accuracy rate of over by adjusting the actual spoke deformation and von Mises stress values as a validation step (Figure 2). The validated simulation results were then subjected to various longitudinal loads caused by a moment of force in the same direction as the vehicle's speed.
| Property Material | Polyurethane (spokes) | Rubber (tread) | Structuralsteel (ringhub) |
| Density (kg/m3) | 1.200 | 1.150 | 7.800 |
| Poisson's ratio | 0,49 | 0,49 | 0,2 |
| Yield stress (MPa) | 145 | 16 | 1240 |
| Young's modulus (MPa) | 32 | 11,9 | 210.000 |
![Figure 2: Validation Process [21]](https://doc.globaljournals.org/csnd11_55655/ocr/images/derivatives/61/61d655152e11053dbd21a08d8a6a00e742c260806cbada5001a6a24043f01d16.webp)
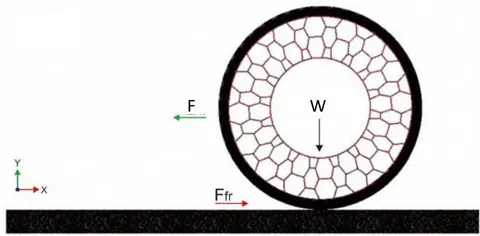
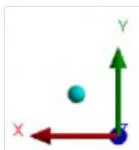
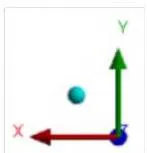
For determining the friction force (Ffr), the actual value is 0.8, which is the coefficient of friction between the asphalt and the tire[22]. However, due to limitations of the constraints, a simplification process was carried out, resulting in the contact between the NPT and the road being considered fixed. The simulation scheme can be seen in Figure 3, with W as the vertical load acting on the Y-axis. The value of W is divided by the number of wheels on the vehicle. On the X-axis, there is F which is the force generated by the car during braking, and the value of force F is opposite to the friction force Ffr.
On the underside of the asphalt, it is constrained to be a fixed component. Calculations from equations 4 and 5 can obtain the value of the force on the X-axis. However, a specific vehicle model is needed to obtain the CG value so that the value of longitudinal load transfer can be known. An SUV was used as a reference model for calculating the CG. The CG of each part is plotted and then calculated by the weight of each piece to get the CG of the vehicle without passengers (Table 2).
| No. | Components | Mass (kg) | CG Height (mm) | M x CG (kg mm) |
| 1 | Front tire* | 40,2 | 362 | 14552,4 |
| 2 | Steering | 16,2 | 362 | 5864,4 |
| 3 | Front brake* | 32,4 | 362 | 11728,8 |
| 4 | Front suspension* | 27,7 | 609 | 16869,3 |
| 5 | Rear tire* | 40,2 | 362 | 14552,4 |
| 6 | Rear brake* | 32,4 | 362 | 11728,8 |
| 7 | Rear suspension* | 49,3 | 482 | 23762,6 |
| 8 | Spare wheel | 20,1 | 476 | 9567,6 |
| 9 | Electrical system | 48,6 | 745 | 36207 |
| 10 | HVAC | 48,6 | 745 | 36207 |
| 11 | Engine | 210,5 | 562 | 118301 |
| 12 | Axle | 76,1 | 362 | 27548,2 |
| 13 | Transmission | 80 | 462 | 36960 |
| 14 | Driveshaft | 25,4 | 385 | 9779 |
| 15 | Body structure + closure + exterior | 631,4 | 529 | 334010,6 |
| 16 | Control system | 24,3 | 963 | 23400,9 |
| 17 | Fuel | 52,2 | 460 | 24012 |
| 18 | Fuel tank | 21 | 460 | 9660 |
| 19 | Exhaust system | 23,8 | 385 | 9163 |
| 20 | Driver and 1st-row seat | 30 | 706 | 21180 |
| 21 | 2nd-row seat | 25 | 751 | 18775 |
| 22 | 3rd-row seat | 0 | 0 | 0 |
| 23 | Airbag | 9 | 963 | 8667 |
| 24 | Knee airbag | 10 | 1602 | 16020 |
| 25 | Front interior | 21,5 | 963 | 20704,5 |
| 26 | Upper interior | 9,2 | 1602 | 14738,4 |
| 27 | Extra curbs weight | 14 | 462 | 6468 |
| 28 | Driver | 0 | 896 | 0 |
| 29 | Passenger 1 | 0 | 896 | 0 |
| 30 | Passenger 2 | 0 | 940 | 0 |
| 31 | Passenger 3 | 0 | 940 | 0 |
| 32 | Passenger 4 | 0 | 940 | 0 |
| 33 | Passenger 5 | 0 | 0 | 0 |
| 34 | Passenger 6 | 0 | 0 | 0 |
| 35 | Baggage | 0 | 846 | 0 |
| Total | 1619,1 | - | 880427,9 | |
| CG (mm) | 543,7 |
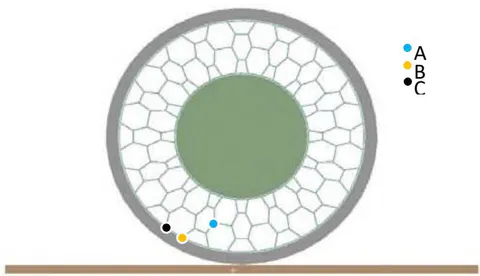
Based on Table 2, the column shows the mass values for each passenger. The weight of passengers affects the CG because the vehicle has a suspension system with a specific spring coefficient (Kf), so each load variation has a different CG height. The suspension's spring coefficient (Kf) is assumed to be 73750 N/m. The process of taking von Mises stress data is by reviewing the von Mises stress contour on the spokes section as a whole, while displacement data is taken from points A, B, and C, as shown in Figure 4.
IV. RESULT AND DISCUSSION
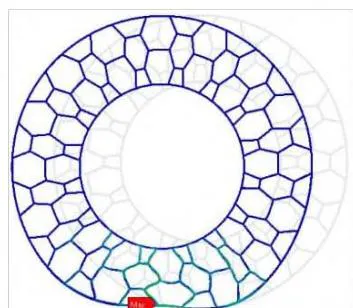
The A and B results on the NPT were analyzed using a finite element method. The deformation behavior was examined based on the Von Mises stress distribution on the NPT. Figure 5 shows the contour of the Von Mises stress on loading A, indicating that the NPT is deformed in the direction of the load. The maximum Von Mises stress position appears in the middle column supporting the loading condition, as noted in [24], due to stress concentration focused on one elbow.
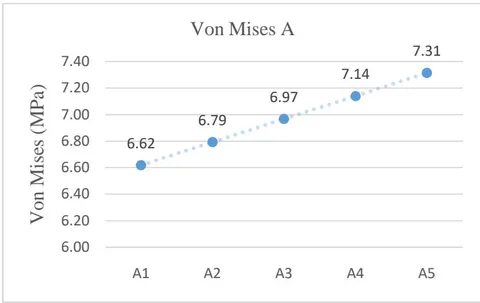
The value of Von Mises stress in all loading A models appears to have increased compared to the validation model, as reported in [21], where the weight supported by the tire in the validation model, which is equivalent to , becomes a variation of weights with values between 480-530 kilograms or equal to 4700-5200N. The increase in the value of Von Mises stress is in the range of from the original value of 4.759 MPa to 6.62 MPa to 7.31 MPa, as reported in [17] and [18](Figure 6).
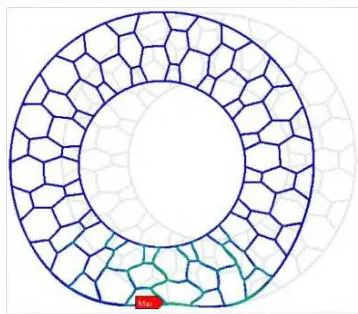
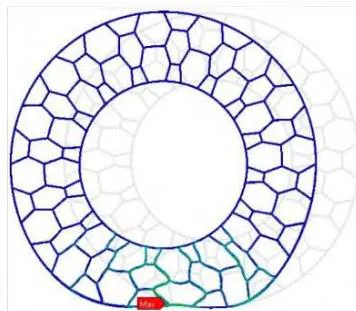
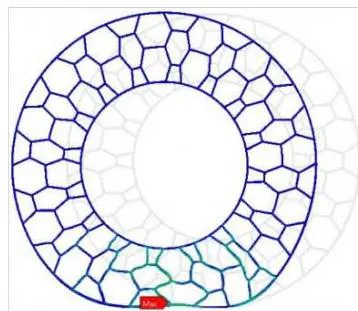
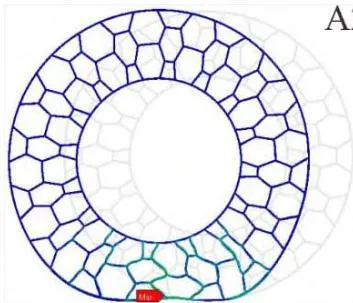
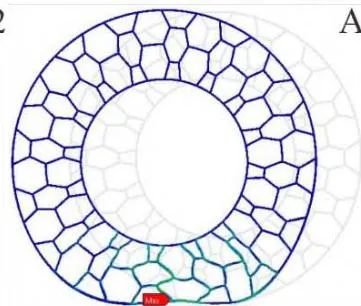
The results show that loading B on the NPT results in a deformation contour similar to loading A, as shown in Figure 7. Increasing the value of G in the loading B model causes a significant increase in the Von Mises stress value. Comparing the stress value in B1 with the validation model reveals a decrease of
from the original value of to , as reported by [17] and [18]. In contrast, the stress value in B2 to B5 increases by to , as reported in [21](Figure 8). The increasing linear trend of loading B can be observed in the graph, where every increase of
results in an increase in the stress value by , as described in [24].
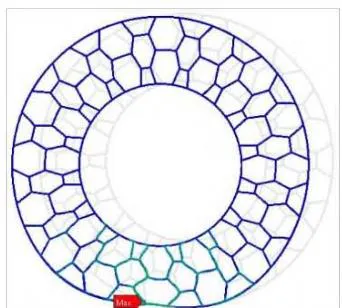
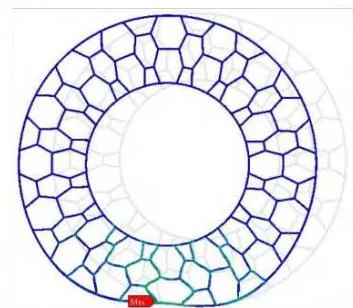
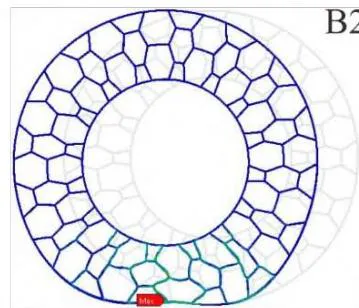
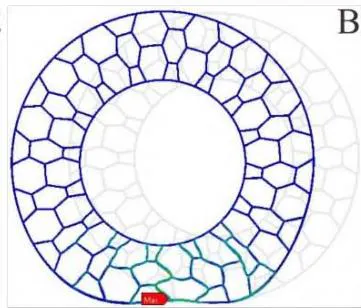
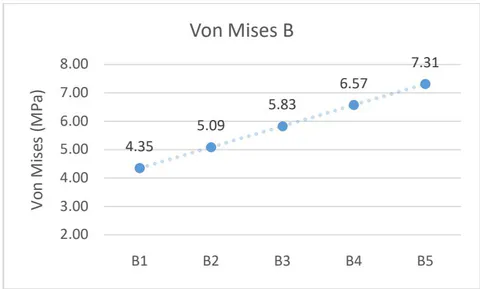
The results indicate that loading A and B produce a similar deformation contour. However, the stress value on the spokes with loading A increases less steeply than with loading B. This is because packing A only involves a 50 kg increase in passenger weight, equivalent to of the vehicle weight. At the same time, loading B has an independent deceleration variable where a rise of 0.1G has a value of . To compare the variables that affect loading A and B, the forces acting on the tire are calculated and presented in Table 3. The data in the table show that the detail working on the tire is much higher in loading B than in loading A.
The deceleration variable in loading B is the primary cause of the higher forces. The values in Table 3 also reveal that the vertical load on the tire is higher in loading B, as is the friction force, which is a function of the coefficient of friction between the tire and the road surface. Based on the data in Table 3, it can be seen that loading B has a more significant effect on the NPT than loading A due to the higher forces acting on the tire. These forces, in turn, lead to higher levels of Von Mises stress in the spokes. The difference in stress values between the two loadings highlights the need for further research to explore the effects of different types of loads on the NPT.
| Load Variations | The total weight (kg) | Deceleration (G) | Longitudinal Load Transfer (Kg) | FX (N) | FY (N) |
| A1 | 1919 | 0,8 | 333,7 | 3765,3 | 6343,6 |
| A2 | 1969 | 0,8 | 343,9 | 3863,4 | 6516,1 |
| A3 | 2019 | 0,8 | 353,9 | 3961,5 | 6687,5 |
| A4 | 2069 | 0,8 | 363,6 | 4059,6 | 6857,9 |
| A5 | 2119 | 0,8 | 373,1 | 4157,7 | 7027,4 |
| B1 | 2119 | 0,4 | 186,6 | 2078,8 | 6112,3 |
| B2 | 2119 | 0,5 | 233,2 | 2598,6 | 6341,0 |
| B3 | 2119 | 0,6 | 279,9 | 3118,3 | 6569,8 |
| B4 | 2119 | 0,7 | 326,5 | 3637,9 | 6798,6 |
| B5 | 2119 | 0,8 | 373,1 | 4157,7 | 7027,4 |
V. CONCLUSION
Based on the study's results, it can be concluded that the non-pneumatic tire (NPT) experiences increased stress and deformation as the load and deceleration values increase. Loading B was found to have a more significant effect on the NPT than loading A due to the higher forces acting on the tire, which resulted in higher levels of Von Mises stress in the spokes. The difference in stress values between the two loadings highlights the need for further research to explore the effects of different types of loads on the NPT. The study provides valuable insights into NPT performance under dynamic loads, which is critical for developing NPTs for commercial use.
ACKNOWLEDGEMENT
The authors thank the Laboratory Dynamics and Department of Mechanical and Industrial Engineering members at the Faculty of Engineering, Universitas Gadjah Mada, for their assistance, opportunities, and provision of facilities.