I. INTRODUCTION
Landuse and landcover (LULC) changes in reservoir catchments around the globe have significant environmental implications and consequences, which may include distresses in hydrological cycles, loss of biodiversity, increase in soil erosion, sediment loads and reservoir sedimentation (Lambin and Geist, 2006). Changes in LULC in a reservoir catchment can be categorized by the complex interaction of structural and behavioral factors associated with technological capacity, demand and social relations that affect both environmental capacity and the demand, along with the nature of the environment of interest (Verburg et al., 2004). Changes in LULC are primarily associated with anthropogenic activities such as deforestation, bush burning, urbanization, construction of dams and agriculture (Yigzaw and Hossain, 2016). Anthropogenic activities have been identified as the main cause of landuse/landcover changes and sedimentation in the Shiyang Reservoir in China with of woodland areas converted into agricultural land (Zhou, 2002). Mzuza et al. (2017) reported that the Nkula Dam in the Middle Shire River Catchment in Malawi had been threatened with massive sedimentation and this was attributed to increased human population and agricultural activities in the reservoir catchment. In Ghana, a similar study conducted by Boakye et al. (2008) to assess the impact of landuse changes in the Barekese catchment on its associated reservoir revealed a loss in reservoir storage capacity of due to sedimentation over a period of six years. The causes for the rapid rate of sedimentation of the reservoir were attributed to deforestation, population growth and lack of proper education of the communities in catchment management.
Increased demands on available resources mainly due to expanding population globally have led to the clearing of marginal lands for agricultural production and for settlement purposes. This has resulted in increased erosion, more rapid rates of sediment loading in reservoirs and reduced socio-economic benefits which they were constructed for (Mavima et al., 2011). In northern Ghana, the estimated mean annual soil loss in reservoir catchments ranged from 3.71 - 8.17 t/ha/yr and this could potentially contribute to sedimentation of their associated reservoirs (Adongo et al., 2019a). Spatial and temporal data on landuse and landcover changes is required to arrive at informed decisions in integrated water management (Mavima et al., 2011). LULC Change detection involves applying multitemporal remote sensing information to analyze the historical effects of an occurrence quantitatively and thus helps in determining the changes associated with land cover and landuse properties with reference to the multi-temporal datasets (Ahmad, 2012; Seif and Mokarram, 2012).
In recent years, a variety of LULC change detection techniques and algorithms have been developed that make use of remotely sensed images. The most commonly used techniques include; Unsupervised classification, Supervised classification, Principal Component Analysis, Hybrid classification, Fuzzy classification, image overlay, classification comparisons of land cover statistics, change vector analysis, image rationing and the differencing of Normalized Difference Vegetation Index (NDVI) (Duadze, 2004). With proper understanding of the spatial and temporal variations occurring in a reservoir catchment over time and the interaction of the hydrological components of a reservoir catchment with each other, better water conservation strategies can be formulated (Ashraf, 2013). The question regarding information on landuse and landcover changes over time, and their driving forces in the reservoir catchments in northern Ghana are not known. Such knowledge is critical to the development of policies and action plans necessary for controlling sediment accumulation in reservoirs. Therefore, this study was carried out using GIS and Remote Sensing applications to analyze the extent of changes in nine (9) reservoir catchments over a period of 30 years in northern Ghana.
II. MATERIALS AND METHODS
a) Study Area
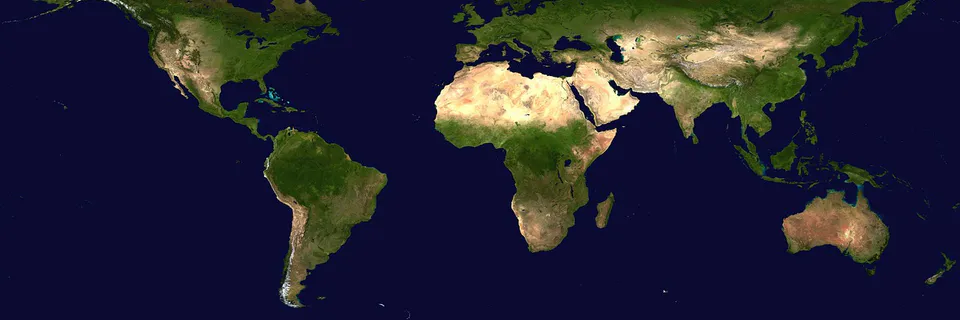
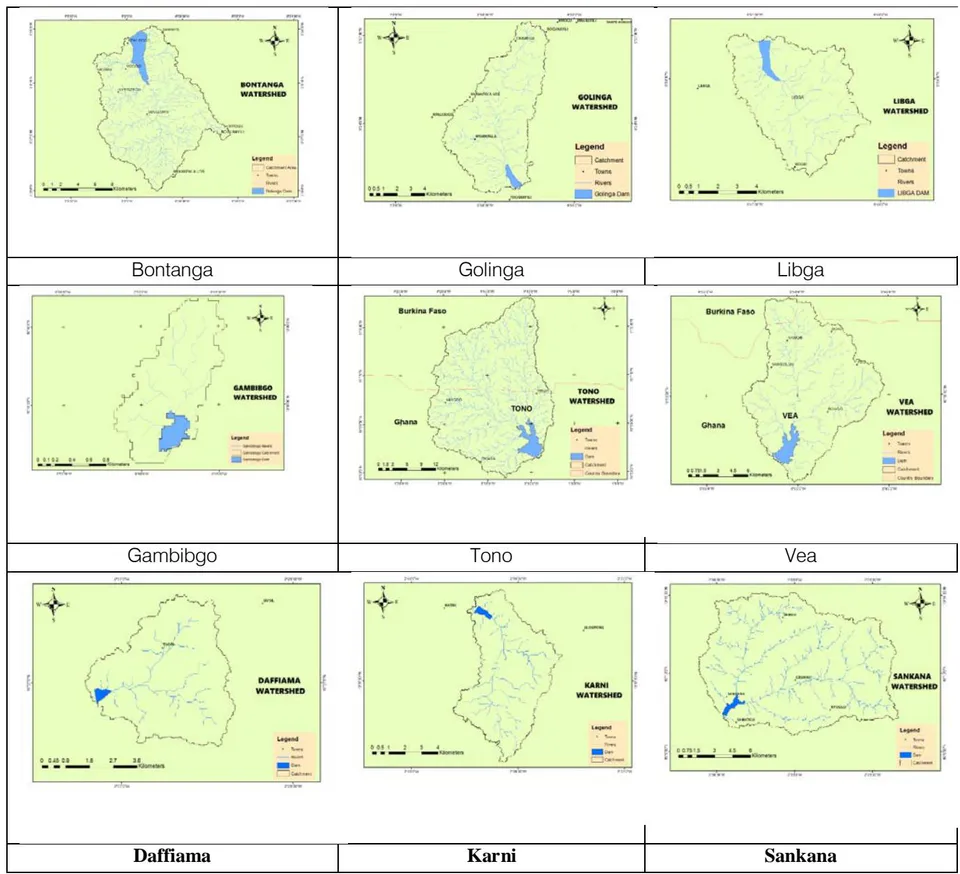
The study was carried out in nine (9) reservoir catchments in northern Ghana as presented in Table 1 which also contains their principal characteristics and with Fig. 1 being the maps of the study sites.
| Region | Northern | Upper East | Upper West | |||||||
| Reservoir | Bontanga | Golinga | Libga | Gambib go | Tono | Vea | Daffiama | Karni | Sankana | |
| District/Municipality | Kumbungu | Tolon | Savelugu | Bolgatan ga | Kassena - Nankana | Bongo | Daffiama-Bussie-Issa | LambuSSie-Karni | Nadowli-Kaleo | |
| Location Coordinates | 9° 57'N1° 02'W | 9° 22'N0° 57'W | 9°59'N0° 85'W | 10° 45'N0° 50'W | 10° 52'N1° 08'W | 10°52'N0° 51'W | 10° 27'N02° 34'W | 10°40'N02° 38'W | 10° 11'N02° 36'W | |
| Catchment Area (km2) | 165 | 53 | 31 | 1.70 | 650 | 136 | 21 | 35 | 141 | |
| Rainfall System | Type | Uni-modal | Uni-modal | Uni-modal | ||||||
| Annual Mean(mm) | 1,000 – 1,300 | 700 – 1,010 | 800 – 1,100 | |||||||
| Duration(months) | 5 – 6 | 5 – 6 | 5 – 6 | |||||||
| Temperat ure (°C) | Day | 33 – 39 | 20 – 22 | 29.0 | ||||||
| Night | 35 – 45 | 23 – 28 | 32.2 | |||||||
| Mean | 33 – 45 | 36 – 55 | 35 - 50 | |||||||
| Relative Humidity(%) | Dry Season | 50 | 10 | 20 | ||||||
| Wet Season | 80 | 65 | 70 | |||||||
| Agro-ecological Zone | Guinea Savannah | Guinea/Sudan Savannah | Guinea Savannah | |||||||
| Geology | Precambrian basement rocks and Paleozoic rocks from the voltaian sedimentary basin | Metamorphic and igneous rocks with gneisss, granodiorite and sandstone | Precambrian, granite and metamorphic rocks | |||||||
| Soil Classes | Acrisols, plinthosols, planosols, luvisols, gleysols and fluvisols | Plinthosols, luvisols, vertisols, leptosols, lixisols, and fluvisols | Lixisols, fluvisols, leptosols, vertisols, acrisols and plinthosols | |||||||
b) Methodology
The study used multi-temporal and multi-sensor Landsat satellite imageries to establish the landuse and landcover (LULC) changes in the study reservoir catchments for the years of 1986, 1996, 2006 and 2016. A summary of the flow chart of the methodology of LULC change detection analysis of the reservoir catchments is presented in Fig. 2.
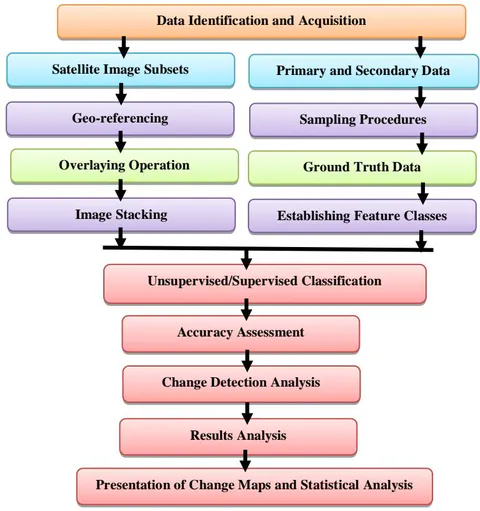
The satellite images were derived from an open source Satellite Imagery Database from the United States Geological Survey (USGS) website. Detailed characteristics of the Landsat images of the various catchments is presented in Table 2.
| Catchment | Sensors | Date of Acquisition | Spatial Resolution (m) | Spectral Bands | Path/Row | Source |
| Gambibgo, Tono | Landsat TM | 05/10/1986 | 30 x 30 | 4,3,2 | 195/52 | |
| Landsat TM | 05/10/1996 | 30 x 30 | 4,3,2 | 195/52 | USGS | |
| Landsat TM | 05/10/2006 | 30 x 30 | 4,3,2 | 195/52 | GloVis | |
| Landsat 8 OLI | 05/10/2016 | 30 x 30 | 5,4,3 | 195/52 | ||
| Vea | Landsat TM | 05/10/1986 | 30 x 30 | 4,3,2 | 194/52 | |
| Landsat TM | 05/10/1996 | 30 x 30 | 4,3,2 | 194/53 | USGS | |
| Landsat TM | 05/10/2006 | 30 x 30 | 4,3,2 | 194/53 | GloVis | |
| Landsat 8 OLI | 05/10/2016 | 30 x 30 | 5,4,3 | 194/52 | ||
| Bontanga, Golinga, Libga | Landsat TM | 05/10/1986 | 30 x 30 | 4,3,2 | 194/53 | |
| Landsat TM | 05/10/1996 | 30 x 30 | 4,3,2 | 194/53 | USGS | |
| Landsat TM | 05/10/2006 | 30 x 30 | 4,3,2 | 194/53 | GloVis | |
| Landsat 8 OLI | 07/10/ 2016 | 30 x 30 | 5,4,3 | 195/53 | ||
| Daffiama, Karni, Sankana | Landsat TM | 05/10/1986 | 30 x 30 | 4,3,2 | 195/53 | |
| Landsat TM | 05/10/1996 | 30 x 30 | 4,3,2 | 195/53 | USGS | |
| Landsat TM | 05/10/2006 | 30 x 30 | 4,3,2 | 195/53 | GloVis | |
| Landsat 8 OLI | 05/10/ 2016 | 30 x 30 | 5,4,3 | 195/53 |
Two software; ERDAS Imagine version 10.4 and ArcGIS version 10.4 were used to process the satellite images for layer stacking, mosaicking, geo-referencing,subseting and training of the images according to the
Area of Interest (AOI). In ERDAS Imagine, image band combinations were manipulated from the default natural colour band combination in the image drape viewer to effectively identify different land use types in the study area, and the findings were later verified by ground truthing (gathered information/image material related to real features on the ground) to generate an appropriate training sample dataset for supervised classification. To improve the visual interpretability of the satellite data for a particular application, image enhancement was performed on all the acquired scenes. A classification
scheme was then developed of which the following five (5) landuse and landcover classes were distinguished; cropland, water body, built-up land/bare land/rocky ground, closed savannah woodland and open savannah woodland. Description of the various LULC classification schemes used in this study is presented in Table 3.
| Serial Number | Landuse/Landcover Class | Description |
| 1 | Cropland | Lands used for the cultivation of crops, i.e., crop fields. |
| 2 | Waterbodies | Waterbodies in the catchment area that empty into the reservoirs. These include; streams, lakes, ponds and rivers. |
| 3 | Built-up land/rocky ground/bare land | Areas with intense infrastructural developments and exposed surfaces due to human activities or natural factors. These include; residential areas, industrial areas, commercial areas, recreational grounds, farmsteads, schools, lorry parks, roads and rocks. Bare land is land covered with sand or gravel. It has limited ability to support life and therefore uncultivated. |
| 4 | Closed savannah woodland | Thick forest lands, groves, thick plantations. |
| 5 | Open savannah woodland | Shrublands, grasslands and fallow lands. |
Enhancement techniques were used together with classification techniques to extract features for the study reservoir catchments, locating areas and objects on the ground and deriving useful information from the images. Furthermore, use of enhancement techniques to visually interpret the images helped optimise the complementary capabilities of the processing. Classification was done for 1986, 1996, 2006 and 2016 images to identify the various LULC types and changes occurring over the years. Accuracy assessment of the classified imagery was performed to establish the level of accuracy of the classification. A non-parametric Cohen's Kappa test was performed to measure the extent of classification accuracy. Cohen's Kappa tries to measure the agreement between predefined producer-ratings and user assigned-ratings (Butt et al., 2015). It is computed using Equation 1 developed by Viera and Garrett (2005):
Where: P (A) - Number of times the k raters agree and P (E) - Number of times the k raters are expected to agree only by chance. The P(A) and P(E) were generated in ArcGIS using the ground coordinates of the ground truth samples.
The classification comparison of LULC statistics method was used for the change detection analysis. This method was adapted because the study sought to determine quantitative changes in the areas of the various LULC categories. Using the post-classification procedure, the area statistics for each of the LULC classes was derived from the classifications of the images for each date (1986, 1996, 2006 and 2016) separately, using functions in the ERDAS-Imagine-Software 10.4. The areas covered by each LULC type for the various time intervals were compared. The percentage landuse and landcover change (% LULCC) at the catchments was computed using the formula developed by Lambin(2001) and presented in Equation 2.
ArcGIS 10.4 was used for map composition as it increases the level of accuracy of the LULC change determined from the image.
c) Key-Informant Interviews
Key-informant interviews were conducted with key stakeholders such as local traditional leaders in the communities of the catchments and the management of the irrigation dams from January to March, 2018. The key-informant interviews were conducted so as to augment the data that was obtained from Landsat images and field measurements. A total of 81 respondents (9 from each catchment) were interviewed. To ensure the acquisition of comprehensive information, the respondents were people of age 45 to 60 years, who are longtime residents (i.e years) of the selected communities. They were selected based on their experience and knowledge on landuse and landcover changes in the catchments.
III. RESULTS AND DISCUSSION
a) Areal Extent of Landuse and Landcover Classes in the Reservoir Catchments
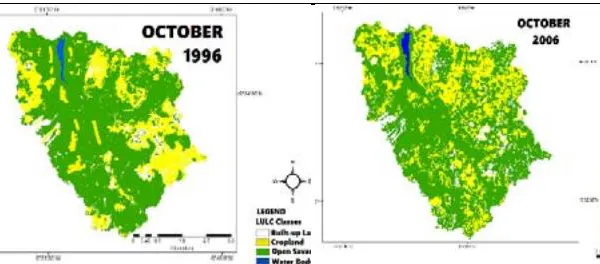
Four (4) major landuse/landcover (LULC) categories namely; cropland, waterbodies, built-up land and open savannah woodland were identified and classified in the reservoir catchments, except Tono catchment where closed savannah woodland was identified as the fifth major LULC class (Figure 3 and Table 4). The LULC maps of the catchments clearly showed that there were variations in the LULC types in the last 30 years (1986-2016).
In 1986, except the Tono catchment, open savannah woodland was the predominant LULC class, occupying an area of at Bontanga to at Golinga. At Tono catchment, the predominant LULC was closed savannah woodland with a coverage area of 233.89 ha , followed by open savannah woodland with area occupancy of . Except Tono catchment, the second most predominant class was cropland with coverage area of at Golinga to at Bontanga, followed by built-up area with a coverage of at Bontanga to at Gambibgo. Across all the catchments, water body occupied the least area with values ranging from at Sankana to at Vea (Table 4).
The 1996 Landsat images of the catchments showed a reduction of LULC change compared with 1986 for the different LULC classes, except cropland and built-up areas. Open savannah woodland occupied a significant portion of the catchments with an area coverage of at Gambibgo to at Golinga, followed by cropland which was randomly distributed within the catchments with an area of at Tono to
52.78% at Bontanga. Built-up area occupied a minor area of 2.39% at Bontanga to 15.29% at Gambibgo. Water bodies occupied the least area of 0.40% at Sankana to 5.85% at Vea (Table 4).
From the 2006 image classification it was noted that both water bodies and open savannah woodland were reduced from their coverage in 1996 (Table 4). Water bodies were reduced by at Sankana to at Gambibgo whilst open savannah woodland reduced by at Vea to at Golinga. Closed savannah woodland also reduced by at Tono. On the other hand, cropland coverage increased by at Tono to at Golinga, and built-up areas coverage also increased by at Golinga to at Gambibgo catchment.
The 2016 Landsat map showed substantial changes relative to the previous 20-year period with croplands occupying the greatest area of the catchments with values ranging from at Tono to at Golinga, followed by open savannah woodland with at Golinga to at Tono catchment. However, at the Libga and Gambibgo catchments, built-up areas were noted to be the second largest LULC class occupying and of their areas respectively. Patches of closed savannah woodland with a total area coverage of were found in the northern zone of the Tono catchment. Except Libga and Gambibgo catchments, built-up areas occupied an area of at Bontanga to at Daffiama catchment. The remaining parts of the catchments were composed of water bodies with the least area of at Sankana to at Bontanga (Table 4).







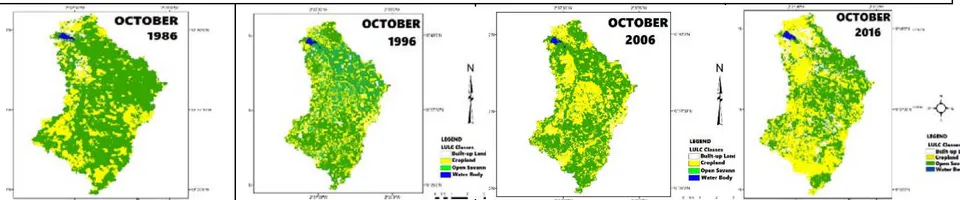
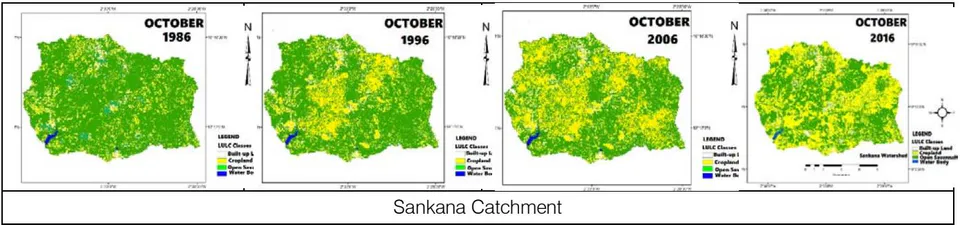
Bontanga Catchment Landuse/ Landcover Class 1986 1996 2006 2016 km2 % km2 % km2 % km2 % Cropland 75.19 45.57 87.09 52.78 97.67 59.19 111 67.27 Built-up land 2.80 1.70 3.94 2.39 5.86 3.55 8.23 4.99 Water body 11.13 6.75 9.67 5.86 8.76 5.31 7.41 4.49 Open SW 75.88 45.99 64.30 38.97 52.71 31.95 38.36 23.25 Closed SW 0.0 0.0 0.0 0.0 0.0 0.0 0.0 0.0 Total 165 100 165 100 165 100 165 100 Golinga Catchment Landuse/ Landcover 1986 1996 2006 2016 km2 % km2 % km2 % km2 % Cropland 8.25 15.57 15.45 29.15 25.37 47.87 39.46 74.45 Built-up land 1.12 2.11 1.77 3.34 1.96 3.70 3.77 7.11 Water body 0.59 1.11 0.51 0.96 0.44 0.83 0.40 0.75 Open SW 42.78 80.72 35.27 66.55 25.23 47.60 9.37 17.68 Closed SW 0.26 0.49 0.0 0.0 0.0 0.0 0.0 0.0 Total 53 100 53 100 53 100 53 100 Libga Catchment Landuse/ Landcover 1986 1996 2006 2016 km2 % km2 % km2 % km2 % Cropland 10.37 33.45 14.53 46.87 16.15 52.10 16.95 54.68 Built-up land 1.96 6.32 3.08 9.94 4.92 15.87 7.04 22.71 Water body 0.52 1.68 0.35 1.13 0.28 0.90 0.23 0.74 Open SW 18.15 58.55 13.04 42.06 9.65 31.13 6.78 21.87 Closed SW 0.0 0.0 0.0 0.0 0.0 0.0 0.0 0.0 Total 31 100 31 100 31 100 31 100 Gambibgo Catchment Landuse/ Landcover 1986 1996 2006 2016 km2 % km2 % km2 % km2 % Cropland 0.35 20.59 0.66 38.82 0.8 47.06 0.70 41.18 Built-up land 0.14 8.24 0.26 15.29 0.42 24.71 0.63 37.06 Water body 0.37 21.76 0.22 2.94 0.18 1.59 0.11 0.47 Open SW 0.84 49.41 0.56 32.94 0.30 17.65 0.26 15.29 Closed SW 0.0 0.0 0.0 0.0 0.0 0.0 0.0 0.0 Total 1.7 100 1.7 100 1.7 100 1.7 100 Tono Catchment Landuse/ Landcover 1986 1996 2006 2016 km2 % km2 % km2 % km2 % Cropland 156.17 24.03 180.32 27.74 200.55 30.85 245.86 37.82 Built-up land 41.54 6.39 50.75 7.81 65.86 10.13 79.43 12.22 Water body 19.78 3.04 18.82 2.90 17.81 2.74 16.19 2.49 Open SW 198.62 30.56 234.94 36.14 255.02 39.23 218.60 33.63 Closed SW 233.89 35.98 165.17 25.41 110.76 17.05 89.92 13.84 Total 650 100 650 100 650 100 650 100 Vea Catchment Landuse/ Landcover 1986 1996 2006 2016 km2 % km2 % km2 % km2 % Cropland 53.46 39.31 59.33 43.63 65.74 48.34 74.86 55.04 Built-up land 4.17 3.07 5.71 4.20 7.92 5.82 10.38 7.63 Water body 8.71 6.40 7.95 5.85 7.15 5.26 5.59 4.11 Open SW 69.66 51.22 63.01 46.33 55.19 40.58 45.17 33.21 Closed SW 0.0 0.0 0.0 0.0 0.0 0.0 0.0 0.0 Total 136 100 136 100 136 100 136 100 Daffiama Catchment Landuse/ Landcover 1986 1996 2006 2016 km2 % km2 % km2 % km2 % Cropland 4.08 19.43 6.95 33.10 8.51 39.10 10.58 50.38 Built-up land 0.68 3.24 1.16 5.52 2.74 13.05 3.91 18.62 Water body 0.43 2.05 0.35 1.67 0.26 1.24 0.11 0.52 Open SW 15.81 75.29 12.54 59.71 9.79 46.62 6.40 30.48 Closed SW 0.0 0.0 0.0 0.0 0.0 0.0 0.0 0.0 Total 21 100 21 100 21 100 21 100 Karni Catchment Landuse/ Landcover 1986 1996 2006 2016 km2 % km2 % km2 % km2 Cropland 10.99 31.40 14.26 40.74 17.84 50.97 23.25 66.43 Built-up land 1.46 4.17 1.75 5.0 2.22 6.34 3.01 8.60 Water body 0.46 1.31 0.42 1.20 0.33 0.94 0.20 0.57 Open SW 22.09 63.11 18.57 53.06 14.61 41.74 8.54 24.40 Closed SW 0.0 0.0 0.0 0.0 0.0 0.0 0.0 0.0 Total 35 100 35 100 35 100 35 100 Sankana Catchment Landuse/ Landcover 1986 1996 2006 2016 km2 % km2 % km2 % km2 Cropland 41.18 29.21 57.63 40.87 76.64 54.35 96.52 68.45 Built-up land 4.34 3.08 5.11 3.62 6.43 4.56 8.80 6.24 Water body 0.62 0.44 0.56 0.40 0.49 0.35 0.38 0.27 Open SW 94.86 67.28 77.70 55.11 57.44 40.74 35.30 25.04 Closed SW 0.0 0.0 0.0 0.0 0.0 0.0 0.0 0.0 Total 141 100 141 100 141 100 141 100
b) Landuse and Landcover Classification Accuracy Assessment for 2016
According to Owojori and Xie (2005), it is crucial to perform accuracy assessment for LULC classification if the classification data are to be used for change detection analysis. Accuracy assessment establishes the level of accuracy of the classification. Coppin and Bauer (1996) reported that a classification accuracy of 0 - 69% indicates low accuracy whereas 70 - 100% indicates high accuracy, and a kappa coefficient and indicates low and high accuracies respectively. As presented in Table 5, an accuracy assessment elaborated for the 2016 image classification revealed an overall classification accuracy of 80% and overall Kappa coefficient (statistic) of 0.75. The highest user accuracy of all the LULC classes was obtained for water bodies of 92.5% whilst cropland recorded the lowest user accuracy of 72.2%. Also, for producer accuracies, water bodies and cropland recorded the highest and lowest values of and respectively. Based on the assertion of Coppin and Bauer (1996), the classification accuracy for the study was high. In a similar study in Ghana, Antwi-Agyei et al. (2019) obtained high overall classification accuracy of and overall Kappa statistic of 0.77 in Owabi reservoir catchment.
| LULC Class | Reference Totals | Classified Totals | Correct Number | Producer's Accuracy (%) | User's Accuracy (%) | Kappa Coefficient |
| Cropland | 45 | 40 | 29 | 64.4 | 72.2 | 0.68 |
| Built-up land | 34 | 40 | 30 | 88.2 | 75.0 | 0.71 |
| Water body | 37 | 40 | 37 | 100.0 | 92.5 | 0.87 |
| Open SW | 43 | 40 | 35 | 81.4 | 87.5 | 0.82 |
| Closed SW | 41 | 40 | 29 | 70.7 | 72.5 | 0.68 |
| Total | 200 | 200 | 160 | - | - | - |
| Overall classification accuracy = 80.0% and overall kappa coefficient (statistic) = 0.75 | ||||||
c) Landuse and Landcover Changes Detection Analysis with the Reservoir Catchments from 1986 to 2016
Substantial changes in LULC categories were observed to have taken place in the reservoir catchments from 1986 to 2016, mainly through the conversion of large areas of closed and open savannah woodlands to cropland and built-up areas. Across all the catchments, cropland and built-up land saw a consistent and significant increased whilst water bodies, open savannah woodland and closed savannah woodland experienced a declined over the past 30-years (Table 6). Between 1986 and 1996, cropland increased by at Karni to at Gambibgo. Also, built-up land increased by at Karni to at Gambibgo. Water bodies decreased by at Sankana to at Gambibgo whilst open savannah woodland declined by at Vea to at Libga. At Tono catchment, however, open savannah woodland increased by and closed savannah woodland saw a decrease of to other LULC classes.
The study also found that between 1996 and 2006, cropland increased by at Tono catchment to at Golinga catchment, whilst built-up land increased by at Golinga to at Gambibgo catchment. However, water bodies recorded a marginal declined by at Sankana catchment to at Gambibgo catchment. Open savannah woodland experienced a declined by at Vea catchment to at Golinga catchment as presented in Table 6.
Between 2006 and 2016, cropland significantly increased by at Libga catchment to at Golinga catchment, whilst at Gambibgo catchment, it decreased by probably to settlement built-up areas. Also, built-up land increased by at Sankana catchment to at Gambibgo catchment. However, water bodies decreased marginally by at Golinga and Sankana catchments to very high of at Gambibgo catchment. Open savannah woodland also saw a decline of at Tono catchment to at Golinga catchment (Table 6). It was also noted that the closed savannah woodland at Tono catchment decreased by to probably other LULC categories such as cropland and built-up land.
| Catchment | Bontanga | Golinga | ||||||||||
| Landuse/ Landcover Change | 1986-1996 | 1996-2006 | 2006-2016 | 1986-1996 | 1996-2006 | 2006-2016 | ||||||
| km2 | % | km2 | % | km2 | % | km2 | % | km2 | % | km2 | % | |
| Cropland | 11.21 | 6.79 | 10.58 | 6.41 | 13.33 | 8.08 | 7.20 | 13.58 | 9.92 | 18.72 | 14.09 | 26.59 |
| Built-up land | 1.14 | 0.69 | 1.92 | 1.16 | 2.37 | 1.68 | 0.65 | 1.23 | 0.19 | 0.36 | 1.81 | 3.42 |
| Water body | -1.46 | -0.88 | -0.91 | -0.55 | -1.35 | -0.82 | -0.08 | -0.15 | -0.07 | -0.13 | -0.04 | -0.08 |
| Open SW | -10.89 | -6.60 | -11.59 | -7.02 | -14.35 | -8.70 | -7.51 | -14.17 | -10.04 | -18.94 | -15.86 | -29.92 |
| Closed SW | 0.0 | 0.0 | 0.0 | 0.0 | 0.0 | 0.0 | -0.26 | -0.49 | 0.0 | 0.0 | 0.0 | 0.0 |
| Catchment | Libga | Gambibgo | ||||||||||
| Cropland | 4.16 | 13.42 | 1.62 | 5.23 | 0.8 | 2.58 | 0.31 | 18.24 | 0.14 | 8.24 | -0.1 | -5.88 |
| Built-up land | 1.12 | 3.61 | 1.84 | 5.94 | 2.12 | 6.84 | 0.12 | 7.06 | 0.16 | 9.41 | 0.21 | 12.35 |
| Water body | -0.17 | -0.55 | -0.07 | -0.23 | -0.05 | -0.16 | -0.15 | -8.82 | -0.04 | -2.35 | -0.07 | -4.12 |
| Open SW | -5.11 | -16.48 | -3.39 | -10.94 | -2.87 | -9.26 | -0.28 | -16.41 | -0.26 | -15.29 | -0.04 | -3.35 |
| Closed SW | 0.0 | 0.0 | 0.0 | 0.0 | 0.0 | 0.0 | 0.0 | 0.0 | 0.0 | 0.0 | 0.0 | 0.0 |
| Catchment | Tono | Vea | ||||||||||
| Cropland | 24.15 | 3.72 | 20.23 | 3.11 | 45.31 | 6.97 | 5.87 | 4.32 | 6.41 | 4.71 | 9.12 | 6.71 |
| Built-up land | 9.21 | 1.42 | 15.11 | 2.32 | 13.57 | 2.09 | 1.54 | 1.13 | 2.21 | 1.63 | 2.46 | 1.81 |
| Water body | -0.96 | -0.15 | -1.01 | -0.16 | -1.62 | -0.25 | -0.76 | -0.56 | -0.80 | -0.59 | -1.56 | -1.15 |
| Open SW | 36.32 | 5.59 | 20.08 | 3.09 | -36.42 | -2.21 | -6.65 | -4.89 | -7.82 | -5.75 | -10.02 | -7.37 |
| Closed SW | -68.72 | -10.57 | -54.41 | -8.37 | -20.84 | -5.60 | 0.0 | 0.0 | 0.0 | 0.0 | 0.0 | 0.0 |
| Catchment | Daffiama | Kami | ||||||||||
| Cropland | 2.87 | 13.67 | 1.56 | 7.43 | 2.07 | 9.86 | 3.27 | 9.34 | 3.58 | 10.23 | 5.41 | 15.46 |
| Built-up land | 0.48 | 2.29 | 1.58 | 7.52 | .01.17 | 5.57 | 0.29 | 0.83 | 0.47 | 1.34 | 0.79 | 2.26 |
| Water body | -0.08 | -0.38 | -0.09 | -0.43 | -0.15 | -0.71 | -0.04 | -0.11 | -0.09 | -0.26 | -0.13 | -0.37 |
| Open SW | -3.27 | -15.57 | -2.75 | -13.10 | -3.39 | -16.14 | -3.52 | -10.06 | -3.96 | -11.31 | -6.07 | -17.34 |
| Closed SW | 0.0 | 0.0 | 0.0 | 0.0 | 0.0 | 0.0 | 0.0 | 0.0 | 0.0 | 0.0 | 0.0 | 0.0 |
| Catchment | Sankana | |||||
| Cropland | 16.45 | 11.67 | 19.01 | 13.48 | 19.88 | 14.10 |
| Built-up land | 0.77 | 0.55 | 1.32 | 0.94 | 2.37 | 1.44 |
| Water body | -0.06 | -0.04 | -0.07 | -0.05 | -0.11 | -0.08 |
| Open SW | -17.16 | -12.17 | -20.26 | -14.37 | -22.14 | -15.70 |
| Closed SW | 0.0 | 0.0 | 0.0 | 0.0 | 0.0 | 0.0 |
- indicates increase; and
- indicates decrease
d) Causes of the Landuse and Landcover Changes in Reservoir Catchments
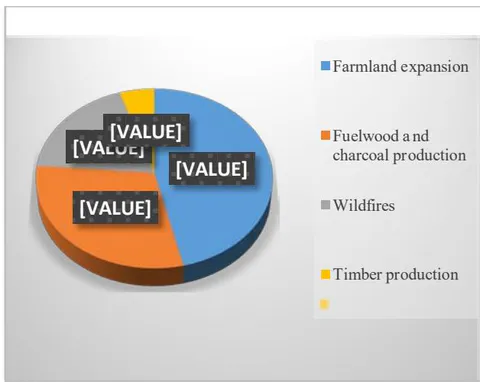
The driving forces for LULC changes in the study reservoir catchments resulted from direct and indirect causes. The direct causes constituted human activities that originated from intended landuse and directly affect LULC. The results from key informant interviews in communities located in the catchments during the study indicated that there is a significant evidence of LULC change resulting from farmland expansion (37%); clearing trees for fuelwood and charcoal for domestic consumption and for sale (24%); clearing of forest for human settlement development (20%); wildfires (15%) and illegal harvesting of forests for timber production (4%) (Fig. 4). The most significant indirect drivers behind the LULC changes noticed on the catchments were related to human population increase (demographic factors) (43%); economic, technological and cultural factors among the land ownership (27%); climate variability in the catchment (19%) and institutional factors (11%) (Fig. 5).
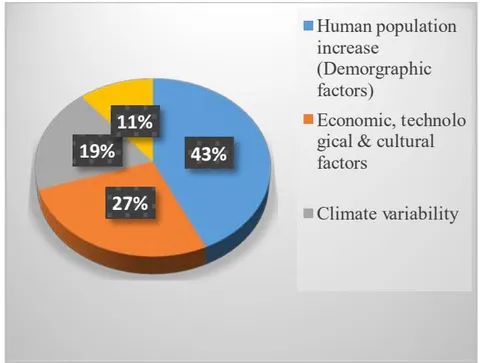
The increased in human population in the catchments over the years has accelerated the demand for agricultural land and settlement development which had led to deforestation and thus reduced the forest cover. The results of the study showed a massive reduction in forested areas in the Tono catchment which was noted to correspond to the results of other studies suggesting that forest areas in Ghana have undergone massive reduction (Adade and Oppelt, 2019). Census data showed that between 1986 and 2016, human population in the five (5) regions of northern Ghana increased with an average growth rate of per annum (GSS, 2014), implying an expansion of agricultural land and built-up areas to meet demand. According to Attua and Fisher (2011) and Antwi et al. (2014), human population growth is widely recognized as a main driver of environmental and LULC change, especially in developing countries. The changes observed in the study reservoir catchments are consistent with those observed in many studies conducted at national and regional levels in Ghana such as Antwi et al. (2014), Kleeman et al. (2017) Asubonteng et al. (2018), Shoyama et al. (2018), Adade and Oppelt (2019) and Antwi-Agyei et al. (2019). For example, using a mixed-method approach, Kleeman et al. (2017) identified population growth as a major driver of LULC changes in Ghana's Upper East Region. Various anthropogenic activities, including agriculture, have led to encroachment of human settlements on forest lands, with devastating consequences for biodiversity (Antwi et al., 2014). In Namibia and Kenya, studies have identified agricultural expansion, human population growth increase and illegal logging as the key drivers of landuse and landcover changes in catchments, with serious debilitating effects on their associated reservoirs and peoples' livelihood activities (Ogechi and Waithaka, 2017). Overall, a large population entails a higher demand for fuelwood and conversion of more agricultural land to human settlements to meet the growing feeding needs (Kassa et al., 2017). With the projected steady increase of the global human population at a rate of per annum (UN-DESA, 2017), the fragile reservoir catchments of northern Ghana will without doubt continue to suffer from anthropogenic pressures.
e) Potential Consequences of the Landuse and Landcover Changes in the Study Catchments
The trend of landuse and landcover changes detected in the study has shown general conversion of the closed and open savannah woodland to cropland and built-up and open areas. These conversions have potential consequences on the catchments' characteristics and hydrology. According to Weiss and Milich (1997), landcover is a function of rainfall regime, soil conditions and geomorphology. This indicates that the conversion of the closed and open savannah woodlands to croplands, grasslands and settlements would definitely lead to changes in the soil conditions and the geomorphology of the catchments.
Similarly, Costa et al. (2003) reported that the conversion of forest to grassland disrupts the hydrological cycle of the catchment by altering the balance between rainfall and evaporation and, consequently, the runoff response of the area. With less litter due to wildfires and clear/burn practices in the catchments, the capacity of surface detention is decreased, and a greater proportion of the rainfall runs off as overland flow. The shift from sub-surface flow to overland storm flows accompanying deforestation, expansion of croplands and built-up areas may produce dramatic changes in the catchment peak flows as well and make the land more vulnerable to erosion leading to sedimentation of the reservoirs. Adongo et al. (2019b) reported that the estimated mean annual soil loss in the reservoir catchments ranged from 3.71 to 8.17 t/ha/yr. Lack of enforcement of environmental by-laws by the local rural district council regarding deforestation has led to uncontrolled cutting down of trees within the catchment and much of the woodland has now become grassland area.
Also, Boakye et al. (2008) noted that practices relating to farming and urbanization such as construction and soil compaction during logging can reduce the infiltration capacity of the soil and in turn the flow of water through the soil profile in Barekese catchment in Ghana. Moreover, the increase in farming activities in the catchments coupled with increasing runoff could also increase erosion and sedimentation of the reservoirs thus, transporting more sediment into the river leading to the gradual sedimentation of the reservoirs. Therefore, these LULC changes detected could be the cause of the sedimentation in the reservoirs at a rate of 0.26 to , as reported by Adongo et al. (2019b). A similar study conducted in Ghana noted a similar trend whereby sedimentation of reservoirs was mainly attributed to deforestation and lack of proper education of the communities in catchment management (Boakye et al., 2008).
IV. CONCLUSIONS
The study identified and classified cropland, water bodies, built-up land, open savannah woodland and closed savannah woodland as the five major landuse and landcover categories in the various sites. Over the 30 year period, substantial areas of closed and open savannah woodlands were noted to have been converted into croplands and built-up areas with water bodies declining mainly due to anthropogenic activities. Closed savannah woodland was only identified in the Tono reservoir catchment although its area decreased overtime.
Farmland expansion, domestic and commercial fuelwood and charcoal production, construction activities, wildfires/bushfires, and illegal harvesting of forests for timber production were observed as casual factors for these changes. These factors were influenced by human population increase, economic, climate variability in the catchment, etc. These changes observed in the various catchments have an effect on catchment hydrological characteristics thus affecting water flows and increasing the level of vulnerability to erosion and its attendant effect on reservoir sedimentation. Strategies such as afforestation, ban on illegal harvesting of forest products, etc and involving local communities for effective and sustainable management of the catchments to reduce the effect of landuse and landcover change on catchment characteristics are recommended.