This paper explores the integration of lean six sigma and AI technologies and how they can enhance each other’s value. The paper introduces AI technologies such as Big Data Analytics, Data Mining and Machine Learning and explains how they can be applied within Lean Six Sigma frameworks. The paper also proposes a synergetic framework that combines AI tools and Lean Six Sigma methodologies. The paper is structured as follows. Section 1 is the introduction. Section 2 gives a brief overview of Lean Methodologies and their frameworks. Section 3 and 4 describe AI technologies, focusing on Big Data Analytics and Machine Learning (ML). Section 5 presents the synergetic framework that embeds AI tools into Lean Six Sigma (LSS) frameworks.
## I. INTRODUCTION
In today's fast-paced and complex business environment, organizations need to find new ways to optimize their operations and stay ahead of the competition. Technology and innovation are key drivers of this transformation, and they require new management methods to leverage their potential. The convergence of Lean, Six Sigma, and AI technologies like Machine Learning and Big Data Analytics promises to revolutionize the way we approach strategy execution and propel organizations into a new era of operational excellence [1].
LSS aims at a capability level of 3.4 defects per million opportunities. Many businesses have attempted to implement LSS, but not everyone has succeeded in improving the business processes to achieve expected outcomes. [9]
The potential to integrate Lean Manufacturing to Industry 4.0 has been debated [3], and, more specifically, Lean Six Sigma has been investigated in its applications to accelerate the process of extracting key insights from Big Data, and how Big Data processing can help to innovate and cast a new light on the projects requiring the use of Lean Six Sigma [3].
In the context of Big Data Analytics, the law of large numbers is critical for understanding the selection of training datasets, test datasets, and in the evaluation of model skill. It supports the intuition that the sample becomes more representative of the population as its size is increased.
For instance, if we collect more data, our sample of data will be more representative of the problem domain. As the size of the sample increases, the mean value of the sample will better approximate the mean or expected value in the population. As the sample size goes to infinity, the sample mean will converge to the population mean.
Analysis of massive data generated by IR4.0 technologies can't be done with usual Six Sigma statistical techniques. A more advanced Data Analytics algorithms and advanced statistical Machine Learning (ML) Models would produce more valuable information to support optimal decision making. New ML tools will not replace good LSS tools like DMAIC, PDCA, Pareto or fishbone diagrams, but will enhance them with more accurate inferential methods. Basic data mining techniques such as clustering, association, prediction, classification and process mining help organizations reach correct and optimal decisions at various stages of LSS projects.
Lean Six Sigma and Big Data Analytics are two complementary approaches that can enhance each other's capabilities and outcomes. Lean Six Sigma is a methodology that focuses on eliminating waste and variation in processes, while Big Data Analytics is a term that refers to the collection, analysis, and use of large and complex data sets. By combining Lean Six Sigma and Big Data Analytics, organizations can achieve powerful integration of data-driven insights and process improvement techniques. This can lead to improved quality, efficiency, innovation, and customer satisfaction.
Big Data Analytics can enhance Lean Six Sigma by providing tools for data analysis, process optimization, voice of customer, anomaly detection, predictive maintenance and more. Also, it can help to automate some of the tasks that are repetitive or tedious for humans, such as data collection, measurement and reporting [3].
However, such AI technologies also poses some challenges for Lean Six Sigma practitioners. For example, AI may require new skills and competencies to understand and interpret the results of machine learning models. AI may also introduce new sources of variation or bias that need to be identified and controlled [3].
The synergy between Lean, Six Sigma, and Big Data Analytics manifests itself in several ways, some of which are listed below [1]:
1. Enhanced Decision-Making: With AI's ability to process vast amounts of data and identify patterns,
organizations can make more informed decisions that align with Lean and Six Sigma principles. For instance, AI can help interpret trends in data and identify outliers, enabling targeted improvements to eliminate waste and reduce variation.
2. Predictive Analytics and Scenario Planning: AI-driven predictive analytics can empower organizations to foresee potential issues and address them proactively. By leveraging AI in scenario planning, organizations can develop a playbook of potential issues and pre-planned responses, ensuring they are prepared for any eventuality.
3. Continuous Improvement: By integrating AI into Lean and Six Sigma initiatives, organizations can create a continuous improvement loop that constantly refines processes and performance.
## II. LSS METHODOLOGIES
Lean Six Sigma methodologies are designed to eliminate waste, bottlenecks, and achieve total customer satisfaction. They combine the principles of lean manufacturing/lean enterprise and Six Sigma to optimize processes and improve quality [2].
Some of the techniques and tools used to implement Lean Six Sigma methodologies include:
1. Kanban: Workflow management practices, such as work visualization and limited work in progress,
which maximize efficiency and promote continuous improvement [3].
2. Kaizen: Practices that engage employees and promote a work environment that emphasizes self-development and ongoing improvement [3].
3. Value Stream Mapping: Analyze places to eliminate waste and optimize process steps [3].
4. DMAIC: A data-driven five-phase problem-solving framework to six sigma projects. DMAIC is an acronym for five interconnected phases: Define, Measure, Analyze, Improve, and Control [3] [6].
5. DMADV: A five-phase framework for designing new products or processes that stands for Define, Measure, Analyze, Design, and Verify [3].
Lean Six Sigma methodologies (Table 1) follow a data-driven approach that relies on statistical analysis and measurement to identify root causes of problems and implement solutions. They also focus on delivering value to customers by understanding their needs and expectations. Approximately $95\%$ of LSS projects follow to improve quality so-called define-measure-analyze-improve-control (DMAIC) approach [2].
DMAIC has proven to be one of the most effective problem-solving methods used up to now, because it forces the teams to heavily utilize the data [2]. Table 2 lists the DMAIC approach steps and sample activities. Table 3 lists all the tools utilized in the DMAIC five steps of which AI models are part of.
Table 1: LSS Methodologies Characteristics [4]
<table><tr><td rowspan="2">Characteristics</td><td colspan="4">Methodologies</td></tr><tr><td>Lean</td><td>Six Sigma</td><td>Lean Six Sigma</td><td>Kaizen</td></tr><tr><td>Scope</td><td>Eliminating unwanted activities</td><td>Reducing variance</td><td>Waste elimination and variation reduction</td><td>Small and incremental changes</td></tr><tr><td>Objective</td><td>Reduction in workflow time</td><td>Process standardisation</td><td>Process standardisation and waste reduction</td><td>Incremental continuous improvements</td></tr><tr><td>Use of information technology tools</td><td>Very high</td><td>Very high</td><td>Very high</td><td>Intermediate</td></tr><tr><td>Relying on data in decisions making</td><td>High</td><td>High</td><td>High</td><td>High</td></tr><tr><td>Change method</td><td>One time</td><td>Incremental</td><td>Continuing</td><td>Continuing incremental</td></tr><tr><td>Associated risk levels</td><td>High</td><td>Moderate</td><td>Moderate</td><td>Moderate</td></tr></table>
Table 2: DMAIC Steps [2]
<table><tr><td>Phase</td><td>Descriptions</td><td>Sample activities</td></tr><tr><td rowspan="3">Define</td><td rowspan="3">Define the purpose and scope of the six sigma project</td><td>Define why the project should be done</td></tr><tr><td>Define the targets, goals and scopes of project</td></tr><tr><td>Define the customer requirements</td></tr><tr><td rowspan="3">Measure</td><td rowspan="3">Measure to determine the current situation</td><td>Select the output characteristics</td></tr><tr><td>Assess the performance specifications</td></tr><tr><td>Establish the initial process capability</td></tr><tr><td rowspan="3">Analyze</td><td rowspan="3">Analyze and determine the actual causes for process improvement</td><td>Analyze the current process performance</td></tr><tr><td>Monitor the potential Critical to Process (CTP)</td></tr><tr><td>Analyze what resources will be needed for improvement</td></tr><tr><td rowspan="3">Improve</td><td rowspan="3">Improve the process by eliminating wasteful causes, removing the problem or reducing the effects of the problem</td><td>Improve idea</td></tr><tr><td>Identify optimal operating conditions</td></tr><tr><td>Eliminate wastes</td></tr><tr><td rowspan="3">Control</td><td rowspan="3">Control the improved process performance</td><td>Determine the process capability for CTPs</td></tr><tr><td>Implement the process controls</td></tr><tr><td>Document what you have learned</td></tr></table>
Table 3: Methods Used in LSS DMAIC Cycle [2]
<table><tr><td></td><td>Define</td><td>Measure</td><td>Analyze</td><td>Improve</td><td>Control</td><td>Design</td><td>Verify</td></tr><tr><td>Statistics</td><td>Descriptive</td><td>Descriptive, Tally chart, Z-test, Confidence intervals, Predictive</td><td>Correlation, T-test, Chi-square test, F-test, Hypothesis tests, ANOVA, Histogram, Predictive</td><td>Hypothesis tests, Multivariate Analysis</td><td></td><td>Descriptive, Predictive</td><td>Correlation, Causality</td></tr><tr><td>Quality Tools</td><td>Brain storming, NGT, Pareto analysis, Matrix diagram, QFD, FMEA, SIPOC, Prioritization matrix, Fishbone analysis,</td><td>Pareto analysis, Process sigma</td><td>SPC</td><td>TRIZ, DOE</td><td>FMEA, Control diagram, Standardization, SPC</td><td>QFD, DOE</td><td></td></tr><tr><td>Data Mining1</td><td></td><td></td><td>Association Rules, Clustering, Classification</td><td>Prediction</td><td></td><td>Market Basket Analysis, Association Rules</td><td></td></tr><tr><td>Big Data</td><td>Text Mining, Video Mining</td><td></td><td>Machine Learning, Decision Trees, Text Mining, Video Mining, Artificial Intelligence</td><td>Machine Learning, Artificial Intelligence</td><td>Machine Learning, Artificial Intelligence</td><td></td><td>Machine Learning, Artificial Intelligence</td></tr><tr><td>Process Mining</td><td>Process Discovery</td><td>Conformance checking</td><td>Process Discovery, Conformance checking</td><td>Flow diagrams, Enhancement</td><td>Flow diagrams, Conformance checking</td><td></td><td>Graphing, Visualization</td></tr></table>
## III. AI: BIG DATA ANALYTICS
Data is created constantly, and at an ever-increasing rate. Mobile phones, social media, imaging technologies to determine a medical diagnosis- all these and more create new data, and that must be stored somewhere for some purpose. Devices and sensors automatically generate diagnostic information that needs to be stored and processed in real time. Merely keeping up with this huge influx of data is difficult, but substantially more challenging is analyzing vast amounts of it, especially when it does not conform to traditional notions of data structure, to identify meaningful patterns and extract useful information. These challenges of the data deluge present the opportunity to transform business, government, science, and everyday life.
Big data analytics is the process of using advanced techniques and tools to analyze large and complex datasets and extract useful information from them.
The Big Data trend is generating an enormous amount of information from many new sources. This data deluge requires advanced analytics and new market players to take advantage of these opportunities and new market dynamics. [10]
Some of the Big Data types include:
1. Structured Data: This is data that has a predefined format and can be easily stored and processed in databases or spreadsheets. Examples of structured data are customer records, sales transactions, sensor readings, etc.
2. Unstructured Data: This is data that has no fixed format and is often text-based or multimedia. Examples of unstructured data are emails, social media posts, videos, images, audio files, etc.
3. Semi-Structured Data: This is data that has some elements of structure but also contains unstructured components. Examples of semi-structured data are XML files, JSON files, web logs, etc. Chart 2 below presents a depiction of data evolution and the rise of Big Data Sources.
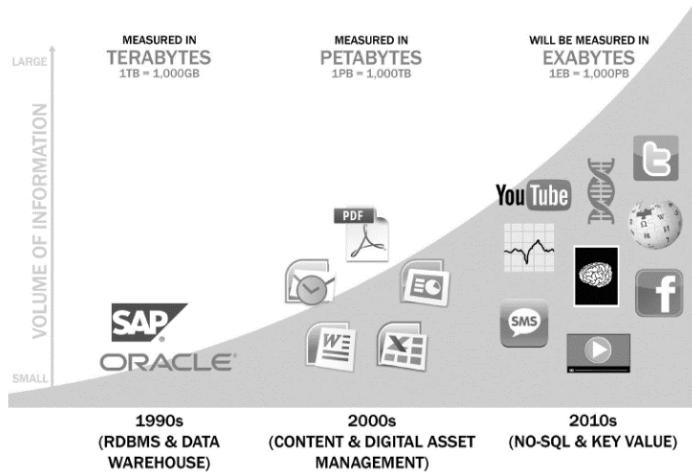
Chart 2: Data Evolution and the Rise of Big Data Sources [10]
Big Data Analytics process follows a five lifecycle phases. Here is a brief overview of the main phases:
- Phase 1- Discovery: In Phase 1, the team learns the business domain, including relevant history such as whether the organization or business unit has attempted similar projects in the past from which they can learn. The team assesses the resources available to support the project in terms of people, technology, time, and data. Important activities in this phase include framing the business problem as an analytics challenge that can be addressed in subsequent phases and formulating initial hypotheses (IHs) to test and begin learning the data.
- Phase 2- Data Preparation: Phase 2 requires the presence of an analytic sandbox, in which the team can work with data and perform analytics for the duration of the project. The team needs to execute extract, load, and transform (ELT) or extract, transform and load (ETL) to get data into the sandbox. The ELT and ETL are sometimes abbreviated as ETLT. Data should be transformed in the ETLT process so the team can work with it and analyze it. In this phase, the team also needs to familiarize itself with the data thoroughly and take steps to condition the data
- Phase 3- Model Planning: Phase 3 is model planning, where the team determines the methods, techniques, and workflow it intends to follow for the subsequent model building phase. The team explores the data to learn about the relationships between variables and subsequently selects key variables and the most suitable models.
- Phase 4- Model Building: In Phase 4, the team develops datasets for testing, training, and production purposes. In addition, in this phase the team builds and executes models based on the work done in the model planning phase. The team also considers whether its existing tools will suffice for running the models, or if it will need a more robust environment for executing models and workflows (for example, fast hardware and parallel processing, if applicable).
- Phase 5- Communicate Results: In Phase 5, the team, in collaboration with major stakeholders, determines if the results of the project are a success or a failure based on the criteria developed in Phase 1. The team should identify key findings, quantify the business value, and develop a narrative to summarize and convey findings to stakeholders.
- Phase 6- Operationalize: In Phase 6, the team delivers final reports, briefings, code, and technical documents. In addition, the team may run a pilot project to implement the models in a production environment.
## IV. AI: MACHINE LEARNING (ML)
Machine learning is a branch of artificial intelligence (AI) that enables machines to learn from data and improve their performance without explicit programming [2]. Machine learning can be used to analyze big data and refine operations by identifying patterns, trends, anomalies, and correlations [3].
The machine learning model takes the featured data, as inputs, and examines them against a supervised machine learning approach or cluster them in unsupervised approach. The model then labels the input and recommends an action against each activity.
Lean Six Sigma can benefit from Machine Learning/Big Data Analytics by using it to:
- Enhance forecasting and decision making by using variance models and statistical analysis algorithms.
- Automate routine tasks and optimize workflows by using robotic process automation (RPA) and natural language processing (NLP).
- Improve customer satisfaction and loyalty by using sentiment analysis and recommendation systems.
- Consolidate critical success factors and best practices by using classification and clustering algorithms.
Machine learning/ Big Data Analytics can also benefit from Lean Six Sigma by using it to:
- Define clear objectives and metrics for machine learning projects by using DMAIC frameworks.
- Measure and monitor the performance of machine learning models by using control charts and dashboards.
- Analyze and improve the quality of data and models by using value stream mapping and root cause analysis.
Machine learning analytical methods are utilized to analyze big data and produce results. The output of machine learning models is the result of applying a trained algorithm to a given data set. Machine learning models are used to recognize patterns in data or make predictions based on the learned information. A machine learning model is defined as the mathematical representation of the real-world processes that are approximated by the algorithm. Different types of machine learning models are suited for different tasks, such as classification, regression, clustering, or recommendation. Some examples of machine learning models are support vector machines, decision trees, neural networks, and k-means clustering. These models are utilized during Big Data Analytics phase 3, model planning. Big data is fed into machine learning algorithms to analyze and for predicting output results. Big Data Analytics and Machine Learning are complementary fields that work together to teach machines how to recognize patterns in complex datasets and make valuable predictions.
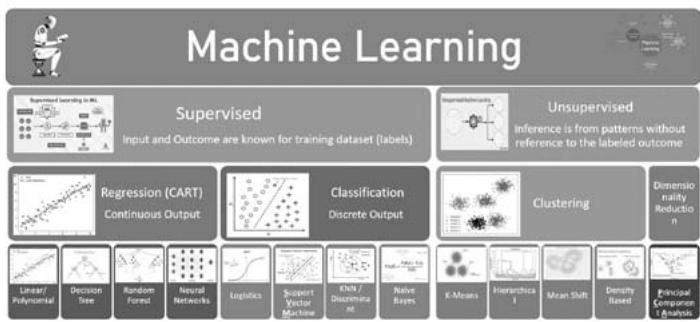
Chart 1: A Simplified Representation of Common Machine Learning Algorithms
## V. THE SYNERGY: INTEGRATED APPROACH
The presence of synergies between Lean Management Tools and Big Data Analytics is evident and therefore, the combination of Lean Management Tools and Big Data Analytics will bring significant benefits to the organizations. [5]
DMAIC and other process improvement methodologies greatly benefit from statistical methods of which Big Data helps providing accurate prediction close to the intended results.
In an integrated approach, Big Data Analytics can be used to train models on large datasets. The law of large numbers supports this by ensuring that as we collect more data, our sample becomes more representative of the population and our model's accuracy improves. These accurate models can be utilized at various stages of LSS projects.
DMAIC and other process improvement framework constituents can be categorized into the following phases: Process Discovery, Process Behavior Measurement/Prediction, Process Improvement and Process Optimization. In each phase various Big Data Analytics algorithms can be utilized to increase the quality/ accuracy of the phase outcome bringing the aim of reaching 3.4 defects per million. The table below lists the recommended ML/Big Data Analytics algorithms to each phase of LSS project.
Table 4
<table><tr><td>Phase</td><td>DMAIC Phase</td><td>Data Analytics Life Cycle</td><td>Tools/Algorithms</td></tr><tr><td>Process Discovery</td><td>Design</td><td>DiscoveryData PreparationModel Planning</td><td>SQLExploratory Data Analysis EDAData VisualizationData WranglingOutliers DetectionCorrelation & Regression ModelsPrediction based on History</td></tr><tr><td rowspan="2">Process Behavior Measurement/Prediction</td><td>Measure</td><td rowspan="2">Model Design & Building</td><td rowspan="2">Support Vector Machine (SVC)ClusteringAssociation RuleRegressionDecision TreeNaïve Bayes ClassifierTime Series AnalysisText Analysis</td></tr><tr><td>Analyze</td></tr><tr><td>Process Improvement</td><td>Improve</td><td>Communicate Results</td><td>Data VisualizationExplanatory GraphsScatterplotHeatmapMapsQuality Control Charts</td></tr><tr><td>Process Optimization</td><td>Control</td><td>Operationalize</td><td>Linear ProgrammingNetwork ModelsDecision TreesSimulation, Monte Carlo, Next-Event Approach</td></tr></table>
Data Analytics life cycle phases can be mapped into LSS projects and accordingly utilize the available advanced tools to increase the quality/ accuracy of each LSS phase output.
## VI. CONCLUSION
The aim of this paper was to present a comprehensive overview of how Lean Six Sigma and Big Data Analytics can be integrated to enhance the quality decision making process. Lean Six Sigma is a quality improvement methodology that focuses on reducing variation and waste in processes, while Big Data Analytics is the process of applying advanced techniques to analyze large and diverse datasets that contain various types of data. In the context of industry 4.0, where massive amounts of data are generated and available, traditional data analysis techniques used in Lean Six Sigma projects may not be adequate. Therefore, by combining both methodologies, quality projects can benefit from more effective and efficient decisions for quality problems. This paper proposed a framework for aligning or synthesizing the different stages of both methodologies, and suggested some algorithms and techniques that can be used in each stage. However, this paper did not provide detailed explanations of these algorithms and techniques, nor did it illustrate their applications with real-world case studies. These could be topics for future research or papers that could further enrich the subject and demonstrate its practical value.
### ACKNOWLEDGMENT
The author extends his appreciation of Saudi Aramco and its management in specific "Tariq A. Turairi" for his support and encouragement to publish technical papers.
Generating HTML Viewer...
References
16 Cites in Article
Marwan Rateb (2023). The Future of Strategy Execution: Embracing the Convergence of Lean, Six Sigma, and AI.
Onur Dogan,Omer Faruk Gurcan (2018). Data Perspective of Lean Six Sigma in Industry 4.0 Era: A Guide to Improve Quality.
Harsimran Sodhi (2020). When Industry 4.0 meets Lean Six Sigma: A review.
Younis Al-Anqoudi,Abdullah Al-Hamdani,Mohamed Al-Badawi,Rachid Hedjam (2021). Using Machine Learning in Business Process Re-Engineering.
Nedjwa Elafri,Jordan Tappert,Bertrand Rose,Maleh Yassine (2022). Lean 4.0: Synergies between Lean Management tools and Industry 4.0 technologies.
Kulchalee Naralai (2010). Quality improvement of PCBA manufacturing process by DMAIC approach.
Jiju Antony,Fabiane Lizarelli,Marcelo Fernandes (2022). A Global Study into the Reasons for Lean Six Sigma Project Failures: Key Findings and Directions for Further Research.
Raja Elboq,Mouhsene Fri,Mustapha Hlyal,Jamila Alami (2021). Modeling Lean and Six Sigma Integration Using Deep Learning: Applied to A Clothing Company.
V Bittencourt,A Alves,C Leao,C (2019). Lean Thinking Contributions for Industry 4.0: A Systematic Literature Review.
David Dietrich,Barry Heller,Beibei Yang Data Science & Big Data Analytics Book.
Sven-Vegard Buer,Jan Strandhagen,Felix Chan (2018). The link between Industry 4.0 and lean manufacturing: mapping current research and establishing a research agenda.
H Katayama (2017). Legend and Future Horizon of Lean Concept and Technology.
Huay Tay,Stephen Low (2017). Digitalization of learning resources in a HEI – a lean management perspective.
V Sreedharan,M Sunder (2018). A novel approach to lean six sigma project management: A conceptual framework and empirical application.
Jiju Antony,Ronald Snee,Roger Hoerl (2017). Lean Six Sigma: yesterday, today and tomorrow.
Gabriele Arcidiacono,Nico Costantino,Kai Yang (2016). The AMSE Lean Six Sigma governance model.
No ethics committee approval was required for this article type.
Data Availability
Not applicable for this article.
How to Cite This Article
Ali K. Al Fardan. 2026. \u201cLean Six Sigma and Big Data Analytics: An integrated Approach for Data-Driven Decision Making\u201d. Global Journal of Management and Business Research - A: Administration & Management GJMBR-A Volume 23 (GJMBR Volume 23 Issue A8).
Explore published articles in an immersive Augmented Reality environment. Our platform converts research papers into interactive 3D books, allowing readers to view and interact with content using AR and VR compatible devices.
Your published article is automatically converted into a realistic 3D book. Flip through pages and read research papers in a more engaging and interactive format.
Our website is actively being updated, and changes may occur frequently. Please clear your browser cache if needed. For feedback or error reporting, please email [email protected]
Thank you for connecting with us. We will respond to you shortly.