
I. INTRODUCTION
Oil spills have the potential to introduce crude oil directly into soil resources where terrestrial petroleum exploration, extraction, or transport occurs (USEPA, 1999; Etkin, 2001). Adverse impacts of petroleum on soils include reduction or elimination of the capacity to support plant life through direct toxic effects (Atlas and Philp, 2005; Tang et al., 2011; Balseiro-Romero and Monterroso, 2014), alterations to hydraulic properties (Caravaca and Roldán, 2003; Ujowundu et al., 2011; Mowrer et al., 2021), and alterations to soil microbial and macro-invertebrate ecology (Hentati et al., 2013; Khan et al., 2018). These properties support proper ecosystem function and provisioning by soils, without which, the potential for cascading adverse effects on adjacent systems and on human health are increased (Jones et al., 2015; Lacalle et al., 2020). As a result, over $10 billion USD have been spent annually to clean and remediate these sites (Kontovas et al., 2010), and approaches to efficiently remediate oil-impacted soils are currently the subject of intense interest.
Thermal desorption (TD) treatment is an effective approach to removing oil from impacted soils through the controlled application of high heat to either
combust or pyrolyze the petroleum hydrocarbon fraction (Gan et al., 2009). Smolder removal is similar to TD in the use of high temperature, but differs in that the process is less controlled. A smolder front is initiated in the soil mass through an initial igniting source while oxygen is continuously supplied to maintain that front, which progresses through the hydrocarbon fraction until it is consumed (Switzer et al., 2009). Both approaches require excavation of affected soil volume and ex situ application of the thermal treatment. Temperatures required to remove oil during the treatments are reported in the range of for TD and for smolder removal (Switzer et al., 2009; Vidonish et al., 2018). The efficiency of the remediation process depends upon the temperature and duration or thermal application, the concentration of oil, the composition of the oil, and the physical and chemical properties of the soil (O'Brien et al., 2018; Vidonish et al., 2018). Salt content, organic matter, and sand are known to reduce the thermal conductivity of soils, while bulk density may increase it (Abu-Hamdeh and Reeder, 2000; Araruna, Jr. et al., 2004). Although salt content has not been studied in the context of thermal remediation of oil-impacted soils, thermal conductivity will play a role in efficiency of removal (Araruna, Jr. et al., 2004; Chen et al., 2020). Therefore, it is important to better understand the effect of co-impacts on soil of saline produced waters with oil at sites where petroleum hydrocarbons are released.
While the total petroleum hydrocarbons (TPHs) can be efficiently removed through thermal treatment via TD or smolder treatment, exposure to high heat alters soil physical, chemical, and biological properties whether oil is present or not (O'Brien et al., 2018). Many previous authors have suggested that these changes would reduce the capacity of soils to support plant growth, compared to soils not exposed to high heat. For instance, Ibrahimi et al. (2018) found that aggregation was increased in sandy soil but decreased in a soil with higher clay content following burning treatments. Ulery et al. (1993) reported changes in the texture of four forest soils in California from fine to coarse as a result of the fusing of smaller clay fraction primary particles into larger particles. Ketterings et al. (2002) reported increasing coarsening of texture with increasing temperature of a single Oxisol following slash and burn
events in Sumatra, Indonesia. Alterations in mineralogy were also reported by these authors. Mowrer et al. (2021) reported changes to the shapes of water retention curve and to saturated hydraulic conductivity (Ksat) in three soils following application of high heat in the range of to . The authors (ibid) reported an increase in Ksat throughout the temperature range in soils containing appreciable clay content, a result consistent with shifting texture from fine to coarse due to fusing, but not precisely indicative of a negative change for soil function.
Several authors have suggested that the chemical properties of soils would also be altered for the worse, where revegetation following thermal treatment is the goal (Pape et al., 2015; O'Brien et al., 2017). Vidonish et al. (2016) were among the first to postulate that a residual deposition of char from the pyrolysis of TPHs would possibly enhance soil fertility. In this study, Arabidopsis thaliana and black-seeded lettuce (Lactuca sativa) treated via pyrolysis produced more biomass than untreated soils containing 16,000 and oil soil respectively. However, the authors' conclusion is confusing when considered with their reporting that both species in the study performed best in soils that never received oil. Vidonish et al. (2016) also detailed changes in soil combustion carbon (C), total nitrogen (N), nitrate-N , phosphorus (P), and pH. The temperature of heat treatments and were negatively related to C, N, and P, but positively related to pH in both soils. The authors described the fertility analyses as "standard" but did not specify whether P was measured as total or plant available. The pH in both soils rose from 7.2 and 7.4, to 11.1 and 11.9 respectively from untreated to incinerated at . It is not surprising that the incinerated soils performed poorly in supporting plant growth, as these pH values are far above the 5.5 - 7.5 soil pH range optimum for most plant species (Havlin et al., 2014).
Pape et al., (2015) reported changes in soil chemical properties following thermal exposure and smolder treatments in two soils. In this study, coal tar was artificially introduced at to an acidic loam and a "commercially available horticultural soil" prior to smolder treatment. The thermal treatments of air dry, , , , , and were applied to soils without oil addition. No further details on the soil intrinsic properties were provided. The authors measured changes in , electrical conductivity (EC), organic matter, total and inorganic N, organic P and exchangeable calcium (Ca), Magnesium (Mg), potassium (K), sodium (Na), manganese (Mn), copper (Cu), and zinc (Zn) in the two soils heated to 5 TD temperatures in the range and 1 smolder treatment. They reported general increases in pH and EC with increasing temperature, consistent with Vidonish et al. (2016), and general decreases with all above nutrients. Smolder treated soil changes were
generally similar to those of the more extreme TD temperatures. Based on the growth of red clover and red fescue on these soils, Pape et al. (2015) recommended a maximum TD temperature of when revegetation was a goal.
Glaringly missing from this developing body of investigations to date, especially from a soil fertility standpoint, are robust comparisons between multiple soils of contrasting properties with complete descriptions of the taxonomies of the soils, and chemical fertility properties of the soils prior to and following thermal treatments. Further improvements to this body of knowledge will aid in the successful revegetation of oil-impacted soils following TD or smolder remediation treatments. Therefore, the aim of the study described herein was to characterize the fertility related chemical changes in four soils as a function of soil properties, addition of oil, additions of salt, and temperature and type of thermal remediation approach. Also of interest in this study was the relative stability/transience of post TD and smolder treated soil chemical changes. Therefore, a simulated weathering study was conducted to evaluate to what degree post treatment changes in the chemistry of soil fertility were transient or permanent.
II. MATERIALS AND METHODS
a) Soils
i. Soil collection
Four soils were collected for the study in the summer of 2019 (Table 1). A soil mapped as an Amarillo series (NRCS Soil Survey) was collected by front end loader from the top in western Texas. A soil mapped as a Billings series was collected from the top by hand in northwestern Colorado. A soil mapped as a Kettleman series soil was collected from the top by hand in central California. A soil mapped as a Penwell series was collected from the top by front end loader in western Texas.
ii. Soil processing and preparation
Soils were allowed to air dry for 24 hours on 6 m plastic tarps during the summer months of 2019. After drying, soils were mixed through turning and agitation in 200 L batches in a commercial 800 kg capacity cement mixer. After mechanical mixing, batches were hand blended using 45 cm shovels on top of plastic tarps. Mixed soils were then sieved through a 5 mm stainless steel screen mesh fitted onto a 1 m x 1 m wooden frame and transferred to labelled 20 L plastic buckets for storage until use in the following experiments.
iii. Soil chemical and physical analysis
A complete description of analytic methods used in this study are presented in Table 2.
b) Experimental Design
i. Oil treatments
Oil additions were based on a single TPH goal using an Arab Medium crude oil. The oil (450 grams) was added to the recently wetted soil in an identical manner as described in the water or salt solution additions. Following thorough mixing, the wetted soil and oil mixture was placed in covered aluminum storage trays. The TPH profile of the oil is presented in Table 3.
ii. Salt treatments
Nine kg of soil was placed in a 15 cm 18/8 stainless steel pan. Either deionized water or a sodium chloride salinity treatment was added at a rate of 450 ml per pan. The salinity treatments therefore included a 0g NaCl (control), a 5.75 g kg NaCl kg (1 mS cm ), or a 17.28 g NaCl kg (3 mS cm ) addition. Each solution was introduced by pouring into an oval depression formed in the soil. Solutions were mixed into soils using stainless steel spoons. The soil was then covered for 24 hours and thoroughly remixed prior to oil additions, if applicable, else were directly transferred to the covered aluminum trays.
iii. Thermal treatments
Three methods of soil heating were used in this study, producing a total of 5 temperature treatments. The control treatment involved heating soils to in a Precision Quincy (Chicago, IL) forced air drying oven for 24 hours. All soils were, in fact, initially prepared in this manner. The 300, 425, and temperature treatments were then performed using a 189GFETLC Square Olympic Kiln (Olympic, WA). An additional smolder treatment used a custom-built smolder system utilizing a propane burner and an electric blower. The prepared soil treatments for the 65, 300, 425, and were individually remixed during transfer back to the 32 x 27 x 15 cm 18/8 stainless steel pans. Thermocouples were placed in the center of the kiln heated treatments to determine the time required to achieve and maintain a consistent temperature treatment throughout the entire tray for 2 hrs.
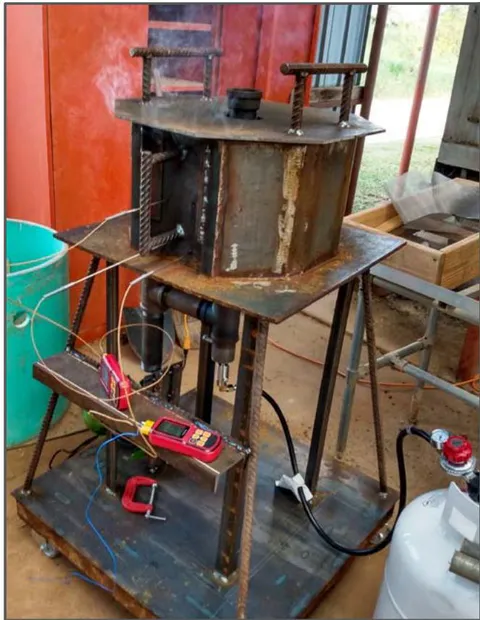
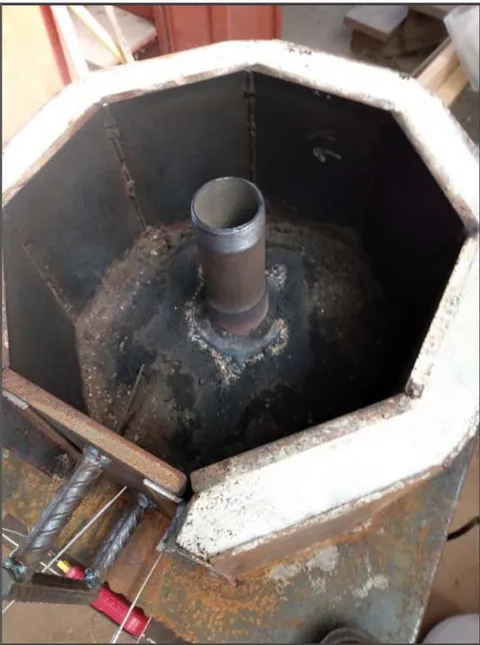
The custom smolder unit was designed using cm A36 steel plates welded in a hexagon pattern to a thick A36 plate (Figure 1). A removal door allowed for placement of thermocouples at various areas within the smolder unit, and allowed for easier recovery of soil. A perforated A36 steel pipe placed through the center of the smolder unit floor served to allow air and heat to be distributed under a stainless mesh (0.11 mm opening). A 130,000 btu propane burner was fitted to allow for both burner operation and air flow into the perforated pipe. Oil-containing soil was uniformly spread across the stainless-steel mesh prior to ignition of the propane burner. The burner was operated at full capacity until the lower-placed thermocouples indicated an internal
temperature of . At this point, the propane burner was turned off, though forced air flow was continued until the upper thermocouples had both achieved and then cooled to .
iv. Post-thermal soil processing
Each soil treatment was pulverized after the thermal treatments using an AgVise soil grinder with a series of 12 hardened steel hammers spinning at 1750 rpm. A 2mm mesh sieve was used to screen the soil before being stored for chemical analysis and/or rapid weathering simulation studies.
v. Rapid weathering incubation study
To develop a better understanding of eventual long term chemical equilibria of soils post thermal treatment, a study was conducted to simulate natural wet/dry and cooling/warming cycles over a five-week period. Soil (100 g) from each treatment and 50 mL distilled water were placed into 250 mL plastic containers with screw top lids. Three replications of each treatment were performed. The containers were then placed into an incubator set to for 24 hours, after which pH and EC measurements were made on each sample. Following measurement, the soils were placed back into the incubator for 3 more days. Then the samples were removed and placed on a laboratory benchtop in front of a stationary fan to dry for an additional 3 days. Room temperature was maintained at at all times. Once dry, the samples were re-wet with 50 mL distilled water and the cycle repeated for an additional four weeks. Samples were analyzed for plant available nutrients and micronutrients for comparison of changes from immediate post treatment nutrient availability.
c) Statistical Analysis
i. Soil chemical analysis results
For all Mehlich III (MIII) and DTPA extractable nutrients, pH, and electrical conductivity (EC) results, a global ANOVA including all soils was performed using the SAS software (SAS; Cary, NC) to examine the effects of each of the factors in the experimental design, as well as their interactive effects. Differences between treatments immediately following treatment, and differences between treatments following the five-week incubation period were examined. Each soil was examined separately using the following model in the GLM procedure.
The results for probability of treatment and interactive effects (p-values) are presented for all factors in the treatment structure with the level of significance set at . However, p-values are included for potential interest in future studies. Regression analysis was used following the ANOVA to determine
whether the direction of significant effects (slope) was positive or negative. Differences between soil chemical properties before and after incubation were analyzed for significance using a paired t-test in the SAS software via the TTEST procedure.
ii. Predictive modelling of changes in soil properties
Multiple linear regression analysis was performed using the GLM procedure in the SAS software to develop a predictive equation using only the simple treatment factors (i.e. no interactions) and the soil properties clay and sand content. The regression was performed on the immediate post-treatment soil state to develop an understanding of immediate changes caused by thermal treatments. Next, regression analysis was performed on final results of the incubation trials to estimate and predict the relationship between the treatments and soil texture on the chemical equilibrium of soil fertility following replacement in situ on the landscape. For this analysis, all soil results were included in one set to improve predictions accounting for outcomes as a function of soil texture. Models for soil fertility parameters that did not result in a probability of or coefficient of determination are not reported, with the single exception of soil pH. Models for soil pH are included here due to its fundamental influence on soil fertility, its frequent inclusion in past studies, and its value towards the developing body of literature on this subject.
III. RESULTS
a) Post Thermal Treatment Changes in Soil Fertility
Soil was a significant parameter in the ANOVA model for all treatments. Therefore, this section is arranged by soil, which allows for an examination of the differential responses between soils. The final subsection on predictive modelling provides an examination of the results across all soils in the study. Soil nutrient sufficiency ranges for plant growth and levels of concern are provided for reference in Table 4.
i. Amarillo soil
Soil fertility analysis of all treatments applied to the Amarillo soil are presented in Table 5. Texture results for the Amarillo soil (sandy loam) were sand, silt, and clay. Effects and interactions related to changes in AM soil chemical properties as a result of thermal, oil, and salt treatment combinations are presented in Table 6. Soil pH was affected by temperature, oil, and salt treatments, as well as the interactions between temperature and oil and temperature and salt additions. Soil pH was positively related to temperature, but negatively related to oil and salt additions. Increases in pH with heat were likely a product of the oxidation of Ca released from the mineral phase during heating. The greatest increase in pH from the control soil was units from 7.80 to 9.33 in the oil-receiving soil with salt solution
added. Three pH values in soils heated to were raised above the pH level of concern (8.5) in Table 4. There were some decreases in pH where oil was added in lower temperatures, the greatest of which was observed to be in oil-receiving treatment with salt solution added.
Soil EC following thermal treatments was affected only by salt addition. However, in those soils receiving the most concentrated salt solution EC was decreased from in the control soil to in the treatment (Table 7). This pattern was closely aligned with that of Na. This suggests that Na may have volatilized at high heat, potentially reducing plant stress from soil salinity. The final concentration of Na was, in fact, reduced to 376 mg kg soil and below the level of concern (400 mg kg ) in Table 4.
Extractable nutrients were affected in different ways by the different treatments. Some nutrients increased with temperature of heating in TD treatments (e.g. P, K, Ca, S, Fe, Zn, and Mn), while other nutrient changes were not directly related to temperature (Table 6). Nutrients that are increased with heat are similarly more aggressively released from organic and mineral phases as temperatures increase. Plant available P was increased from to levels as high as (Table 5), well above the critical level of (Table 5). This indicates a shift from substantial deficiency to more than sufficient level. Oil additions resulted in decreases in P, K, Ca, Na, Fe, Zn, and Mn(Table 6). Salt additions positively affected Na and negatively affected Fe. Temperature and oil interactions were present for P, K, Ca, Na, and Fe. Temperature and salt interactions were present for Na and Fe.
ii. Billings soil
Billings soil fertility analysis is presented in Table 7. Texture results for the soil were sand, silt, and clay, placing it in the loam textural class (Table 1). Summary of ANOVA results for effects and interactions related to changes in BL soil chemical properties as a result of thermal, oil, and salt treatment combinations are presented in Table 8. Soil pH was affected by temperature, oil, as well as the interactions between temperature and oil addition, though not affected by salt additions as was the case with the Amarillo soil. The effect on pH was positively related to temperature, and rose substantially above the level of concern in all treatments. Soil EC was negatively affected by temperature and oil addition, but positively related to salt addition.
Some nutrients increased with temperature of heating in TD treatments (P, K, Ca, Fe, Zn, and Mn). However, S decreased while other nutrient differences(Zn, Mn, Cu) were not related to temperature. Oil additions exerted negative effects on P, K, Ca, Na, Fe, Zn, and Mn. Salt additions had a positive effect on
Na and a negative effect on Fe. Temperature and oil were interactive effects for P, K, Ca, Na, and Fe. Temperature and salt were interactive effects for Na and Fe.
iii. Kettleman soil
Texture results for the Kettleman soil were sand, silt, and clay (sandy clay loam). Post thermal treatment soil fertility results are presented in Table 9. Soil pH was negatively related to temperature, oil addition and salt addition (Table 10). This pH relationship is opposite of those in the Amarillo and Billings soils. Clay content in the Kettleman soil is not dissimilar from the Amarillo soil, suggesting that mineralogy is a stronger influence on these differences than texture. Initial pH values are very close for all three soils (Amarillo, Billings, and Kettleman), as is plant available Ca. Total calcium in the mineral phase available to form oxides and hydroxides (CaO and ) may differ between the soils, though the alkaline pH in the untreated soil suggests the presence of substantial calcite ( ). Soil EC following thermal treatments was negatively by temperature and oil, but positively affected by salt addition.
Effects and interactions related to changes in Billings plant available nutrients as a result of thermal, oil, and salt treatment combinations are presented in Table 10. Some nutrients increased with temperature of heating in TD treatments (P, K, S, Fe, and Zn), while others (Ca, Mg, Na, and Cu) were negatively affected. No other nutrient changes were related to temperature. Of note are the increases in MIII P from the control which bring the level from half of the critical value (Table 4) to a concentration above the sufficiency level for plant growth. Oil addition resulted in negative effects on P, K, Ca, Mg, S, Na, Zn, and Cu. Salt additions resulted in positive effects on Na only. Temperature and oil were interactive for K, Ca, Mg, S, Na, and Cu. Temperature and salt were interactive for Na only. Although not related to the treatment effects, Mn was increased from in the control to above the level of concern in four of the treatments (Table 9).
iv. Penwell soil
Texture results for the Penwell soil were sand, silt, and clay placing it in the sand textural class (Table 1). Soil fertility results for all treatments applied to this soil are presented in Table 11. Results of ANOVA are presented in Table 12. Soil pH was negatively related to temperature, oil and salt. This result differs from that of previous studies, and is likely due to the absence of clay colloids with exchange sites, and the low amount of exchangeable bases such as Ca and Mg. Soil EC was only affected by salt additions.
Some nutrients increased with temperature of heating in TD treatments (P, K, Mg, S, and Fe), while other nutrient changes were negatively affected (Na, Zn, and Cu) or not related to temperature (Table 11). Oil
addition was responsible for negatively affecting plant available P, K, Ca, Mg, S, Na, and Cu. Salt additions were responsible for positive changes in K, Na, and Zn, and negative changes in Ca and S. Temperature and oil interactions affected P, K, Mg, S, and Na. Temperature and salt interactions affected changes in Fe and Zn. Oil and salt interactions affected changes in S and Na.
Changes in K concentrations between the control and the treatments (106-178 mg kg ) were substantial enough to lift the status from deficient to sufficient (Table 4). The range of Cu differences (0.2 to 1.1 ppm) are substantial enough relative to the sufficiency range to have an influence over plant growth performance. The high salt treatment resulted in a Milli Na concentration of . Thermal treatment at following oil addition reduced this level to , and below the level of concern (Table 4).
b) Rapid weathering incubation study
The rapid weathering simulation study was conducted to estimate relative changes with naturally occurring fluctuations in environmental conditions in a short time period, and showed that soil type was a significant effect on soil fertility chemical changes between treatments following the weathering simulation. Soil pH and EC monitoring throughout the five-week period for the controlled TD treatments were used to provide evidence of an approach to chemical equilibrium. Changes in the pH and EC at weekly monitoring events are reported. Final concentrations of plant available nutrients (and Na) for all TD and smolder treatments are also reported. Results are presented by soil.
i. Amarillo soil
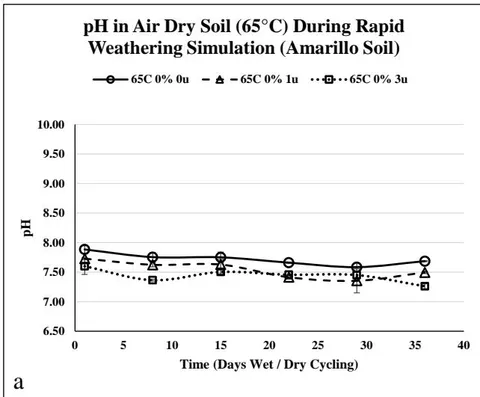
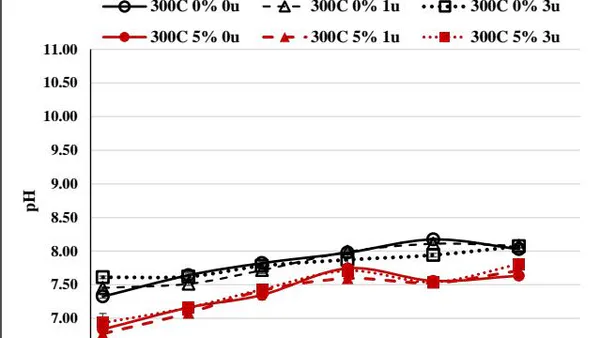
Weekly measurements of soil pH during the five-week incubations indicate that the 'as received' soil was not substantially affected by salt addition (Figure 2a). Over the course of the incubation period, the pH decreased in the control soil by 0.2 units from 7.7 - 7.5 pH. The difference was of very small practical importance towards the goal of long-term revegetation, and may be explained by the acidification caused by mineralization of organic N to ammonium-N and subsequent nitrification of to nitrate-N promoted by 6 successive wet dry cycles (Haynes and Swift, 1989).
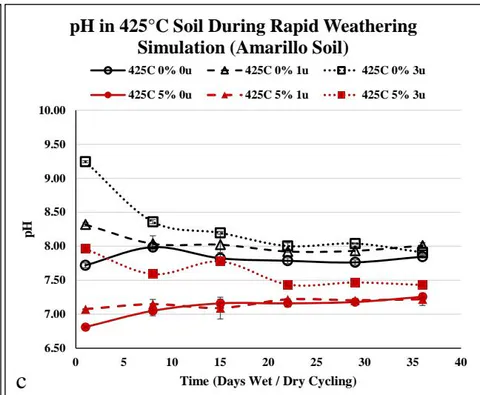
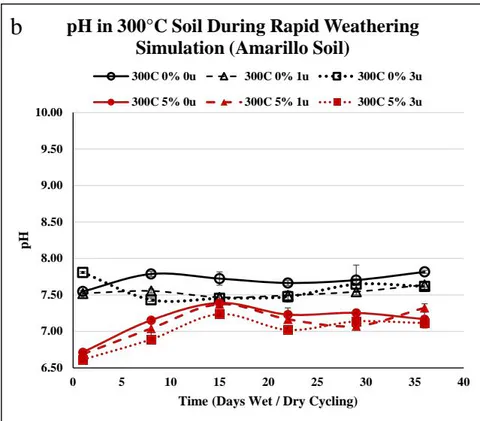
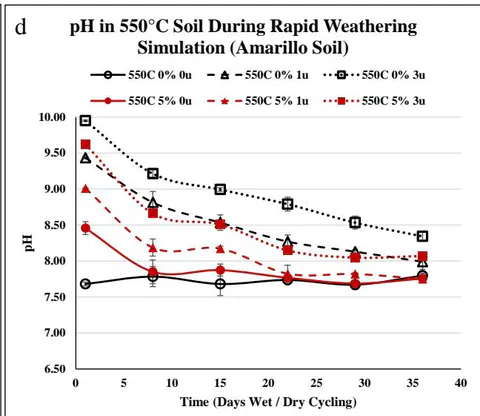
The TD treatments generally decreased pH values initially in this soil by approximately units, while additions of oil and TD caused more substantial reductions from 7.6 to 6.6 pH (Figure 2b). After five weeks, soil pH values increased to between 7.2 and . Heating to and resulted in much more substantial changes in soil pH (Figures 1c and 1d). At , when salt was added to soils, pH was elevated as much as units. At , the initial pH value for the treatment was elevated
to pH 10, a difference of units. In all cases, the treatments receiving oil prior to TD were found to be lower in pH than those parallel treatments receiving no oil. Following the incubation period, the weekly degree of change approached zero for all treatments except for the oil receiving TD treatment. This indicates that a state of equilibrium is either near or already present for this soil. All final pH values were within 0.5 units of the initial control soil.
Plant available nutrient changes during the incubations in the control were relatively minor in magnitude (<10%) for P, K, and Ca. Changes between conditions immediately following thermal treatment and those following incubation were most substantial in those treatments receiving oil. For example, reductions in P concentrations were observed at and . In most cases where reductions occurred, levels remained above those of the control soil. For example, post TD treated soil at without salt addition reached soil and settled at soil following the incubation period (Tables 5 and 13). This is more than twice the final P level of the control soil . Soil K levels continued to increase during incubation in most treatments involving thermal treatment, with the exception being oil receiving soils TD treated at . Soil Mg, S, Na, Fe, Zn, Mn, and Cu were generally, but not universally, observed to decrease over the incubation period.
ii. Billings Soil
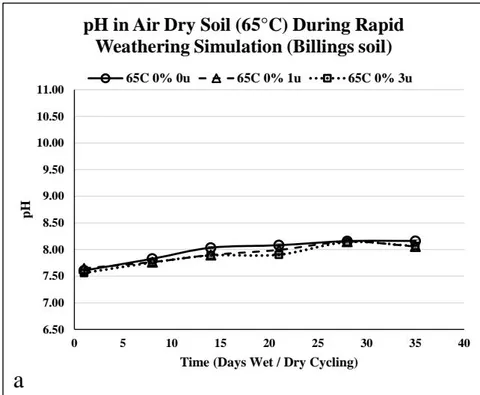
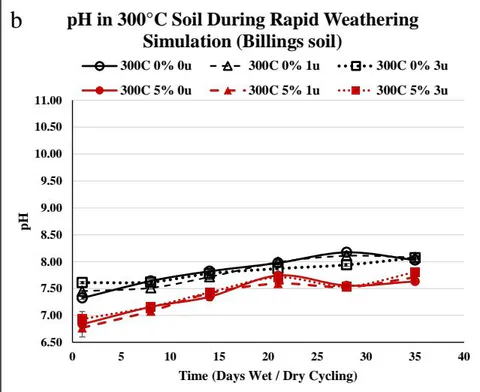
Weekly measurements of soil pH made during the incubation indicate that the control Billings soil was not substantially affected by salt addition (Figure 3a). There was an approximate 0.5 unit rise from 7.6 to 8.1 pH over the five-week incubation period that is not insubstantial, and in this range could result in a problem with plant growth. The rise may be an artifact of the cycling of saturated and unsaturated conditions of the study contributing to the dissolution and subsequent oxidation of calcium species in the soil. Those soils heated to followed the same pattern of rise over the incubation period (Figure 3b). However, the oil receiving treatments all remained lower in pH than the non-oil receiving counterparts at that temperature. All treatments within the TD temperature settled at values between 7.5 and .
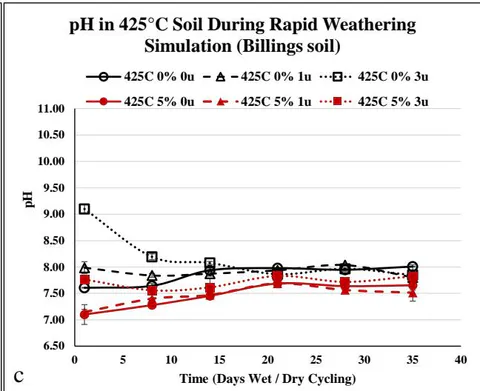
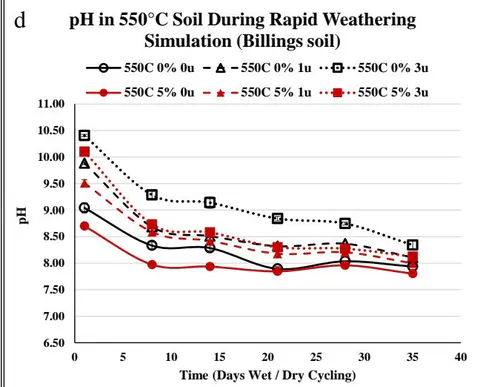
The TD treatments resulted in a response pattern similar to that of the treatments with the exception of the high salt solution treatment, which had initially increased to (Figure 3c). All treatments within the temperature set eventually settled to values between 7.5 and following the incubation period. All treatments within the temperature setinitially increased substantially with oil and salt addition from in the control to values that ranged from 9.5 to (Figure 2d). Values above are of definite concern for plant growth
(Table 4). However, the final values decreased to a range between 7.8 and . This outcome clearly indicates that a final stable equilibrium in the field would be much more suitable for plant growth than initial post TD treated values would suggest.
Plant available nutrients changed over the course of the incubation in the Billings soil. Soil P values, which had increased with increasing temperature immediately following thermal treatments, further increased in the and TD and the smolder treatments where oil was added (Tables 7 and 14). Soil P decreased in all other treatments following the incubation period. Soil K increased over the incubation period except in the non-oil receiving treatments heated to and . Soil Ca and S increased in all thermal treatments except the non-oil receiving treatment. Micronutrient status generally decreased over the incubation period.
iii. Kettleman Soil
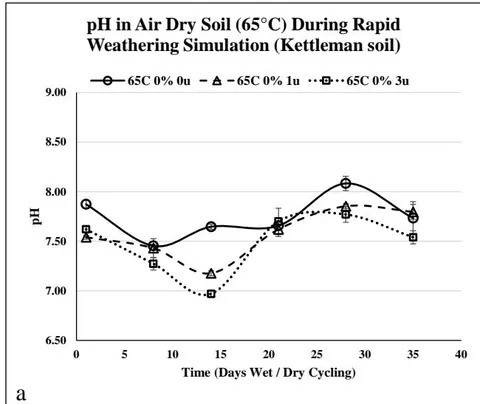
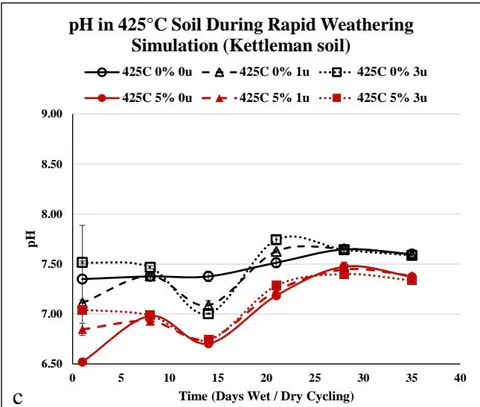
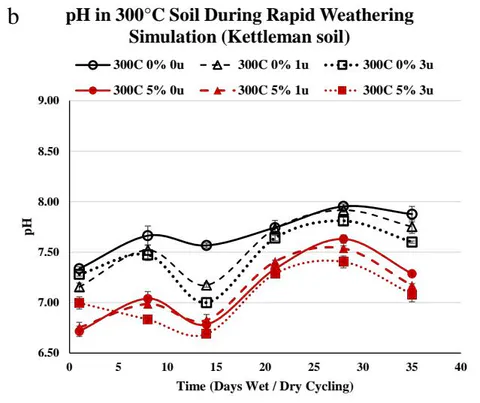
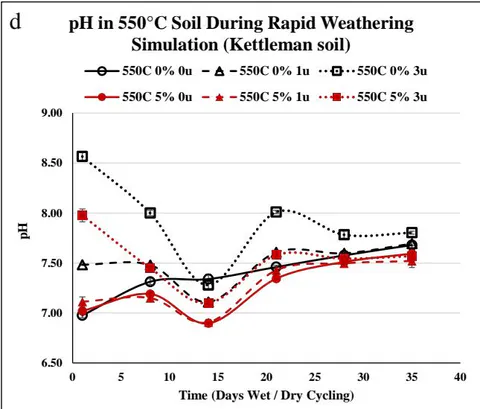
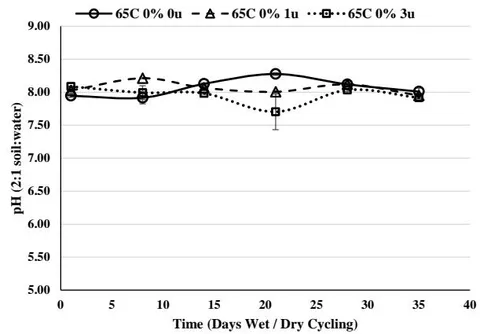
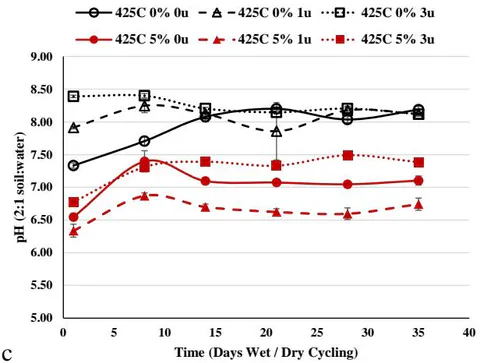
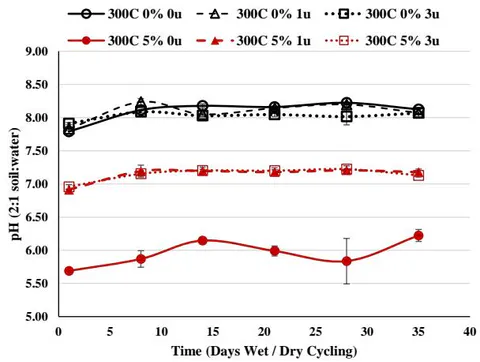
Weekly measurements of soil pH made during the incubation indicate that the treatment for Kettleman soil was decreased initially as much as 0.4 pH units upon the addition of salt solutions (Figure 4a). There were individual sampling events that indicated further decreases to substantially lower pH values with increasing salt concentration. However, all salt treatments at eventually converged to values between 7.5 and 7.7 pH. There was a small change between the initial and the final pH values at five weeks, though these would have little practical consequence in revegetation efforts. It is worth noting that all temperature treatments exhibited the same pattern of pH decrease at the two-week measurement event, and that the no salt and no oil treatment was the only one for Kettleman soil to not exhibit a decrease in pH at this time during the incubation (Figures 3a - 3d).
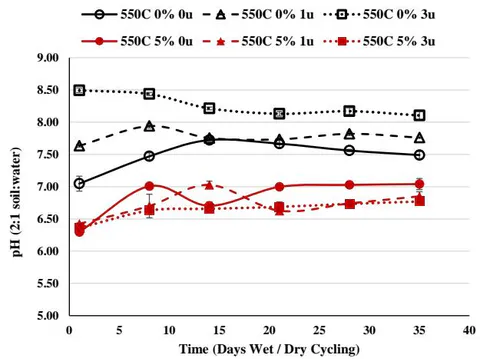
Simple heating to decreased pH values initially in this soil by pH units, while additions of oil followed by TD treatment at resulted in decreases of units or more. This is very similar to the effect observed in the Amarillo and the Billings soils. After five weeks, values for each treatment rose pH units to between 7.1 and (Figure 4b). The pattern for this temperature in this soil over the course of incubations did not indicate that a near equilibrium chemical state had been achieved over the incubation period. Heating to resulted in similar soil pH changes as the treatment at the beginning of the incubation period. However, by the end of the incubation period, all values were stable for the last two measurement events at 4 and 5 weeks (Figure 4c). At the initial pH value for the treatment was elevated to 8.5 pH, a difference of 1.5 units. In all cases, the treatments receiving oil prior to TD were found to be lower, or not significantly different, in pH than those parallel treatments receiving no oil. Following the five week
period, the weekly change approached zero for all treatments. This indicates that a state of equilibrium was near or attained for this soil. All final pH values were within 0.5 units of the initial untreated Kettleman soil.
The post TD treatment incubation process resulted in substantial changes in many plant available nutrients for the Kettleman soil. Extractable P decreased in most treatment combinations at the and temperatures, but remained above the control soil following the incubation period (Table 15). Soil K, Ca, and Mg nearly uniformly increased over the five-week period at the higher temperatures and for the smolder treatment. Sulfur decreased in most treatments below 550C. All micronutrients (Fe, Zn, Mn, and Cu) generally decreased during the incubation for higher temperatures, but increased in some lower temperature treatments (Table 15). Soil Na was most substantially decreased at lower temperatures, increased in the smolder treatment, and exhibited relatively small changes over the incubation period for higher temperatures.
iv. Penwell Soil
Weekly measurements of soil pH made during the incubation indicate that the treated Penwell soil were not affected by salt addition initially (Figure 5a). There was negligible change between the initial values and the final values at five weeks for pH in the treatments. All three salt treatments were approximately pH 8.0. Heating to did not affect pH values initially in non-oil receiving treatments (Figure 5b). However, additions of oil and TD together caused a more drastic reduction from pH 8.0 to pH 5.7 in the 0 treatment. Additions of 1 and salt solutions under went less severe decreases to pH 7.0. This is a dissimilar pattern to that of the other three soils in the study. The Penwell soil has the highest percentage of sand of all three soils and no clay fraction (Table 1). It is possible that heating will result in a different reaction in the sand fraction than in a soil with more clay content. After six weeks, soil pH in the oil treated soils heated to did not converge to a similar value as those soils not receiving oil (Figure 5b). This is also a dissimilar pattern to that found in the other three soils. However, this may be explained by the exceptionally poor efficiency of oil removal at in this soil. Unpyrolyzed oil was clearly present in the Penwell soil post TD at .
Heating to and produced similar effects to those observed in the Amarillo and Billings soils in the initial changes following TD (Figures 4c and 4d). Heating alone at resulted in a decrease and a decrease in the compared to the control soil. Increasing salt additions increased and 1 unit respectively. Oil additions decreased units when compared to the corresponding salt treatment. In all cases, the
treatments receiving oil prior to TD were found to be lower in pH than those parallel treatments receiving no oil. Final pH values ranged from 0 to units difference from the initial control soil (Figures 4a-4d). For the final three weekly measurement events period, the change approached zero for all treatments. This indicates that a state of equilibrium was either attained or close at hand.
The post TD treatment incubation process resulted in substantial changes in many plant available nutrients for the Penwell soil. Soil P, K, Ca, Mg, and S generally increased following incubation with few exceptions (Table 16). Micronutrients were generally decreased in all treatments, though to a lesser degree than the other three soils.
IV. DISCUSSION
The current study evaluated the effects of temperature, oil addition, and salt addition to four soils of contrasting properties and found that pH was positively affected by temperature in two soils and negatively affected by temperature in two other soils (Tables 6, 8, 10, and 12). Addition of oil at soil and addition of salt solutions (1 or ) had negative effects on soil pH. The magnitude of the effect also differed between soils. Therefore, multiple linear regression analysis was used to develop a model of how pH (and the other fertility parameters measured in this study) were related to the treatments applied and to the textures of the soils.
Previous studies have reported soil pH changes following exposure to high heat through naturally occurring fires or through TD and smolder remediation treatments. Badia et al. (2003) reported a unit decrease in soil following a forest fire at , and increases of units for soils exposed to . Vidonish et al. (2016) observed increases of unit for two oil-impacted soils receiving TD remediation to and units at . Pape et al. (2015) observed soil pH increases of units in two soils receiving thermal exposure at and units in the same two soils receiving smolder remediation treatments. Soil EC increased with increasing temperatures in both soils.
Vidonish et al. (2016) reported soil P increased from 3 to in one unidentified soil following oil addition. This value increased to following TD treatment at but decreased to at . In another unidentified soil from Arizona, P decreased from 2 to at all temperatures. Pape et al. (2015) reported a moderate P increase in a "commercially available horticultural soil" through TD treatments and reductions at higher temperatures. They also reported consistent P decreases at all temperatures in an "acidic loam" soil. The same authors further reported decreases in soil K and Na with
increasing temperatures in both soils. Pape et al. (2015) evaluated smolder remediation of oil-impacted soils as well, with results for many soil nutrients consistent with those for the highest thermal remediation temperatures . However, no oil was added to the controlled thermal treated soil, so the comparison is not direct.
From the small number of studies on TD and smolder remediation, it is clear that soils of different intrinsic and dynamic properties exhibit different soil fertility responses. Therefore, the efforts of this study to evaluate the influence of soil physical properties, TD temperature, oil, and salt additions represent a first step towards establishing the relationships between these parameters and the fertility outcomes for thermal remediated oil-impacted soils. Pape et al. (2015) reported on the effects of smolder treatment on a soil receiving coal tar compared with a range of temperatures of controlled thermal treatment in two soils with no added TPH. Their results indicated that smolder treated soil outcomes were most similar to those of the two highest temperatures and . In the current study, the soil fertility outcomes for smolder treated soils were most frequently (though not uniformly) aligned with outcomes from oil-impacted soils thermally treated at .
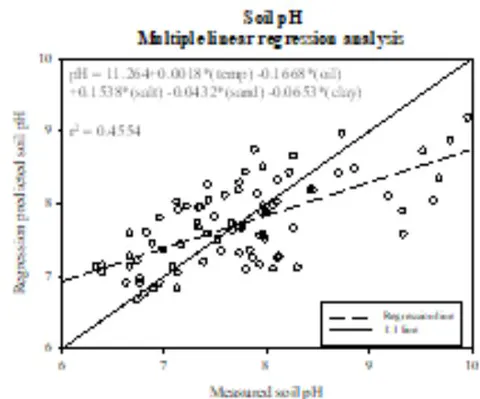
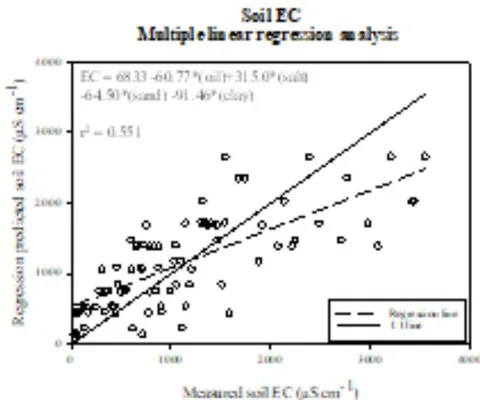
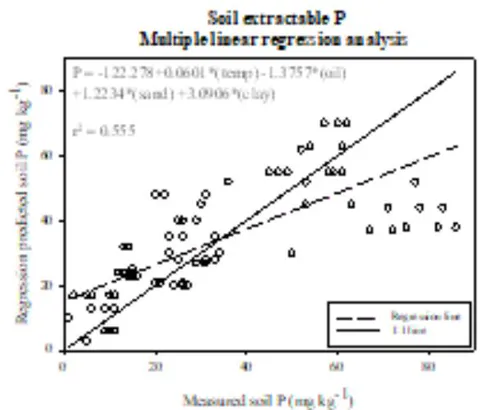
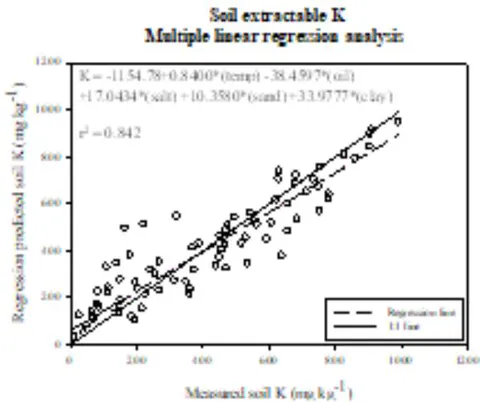
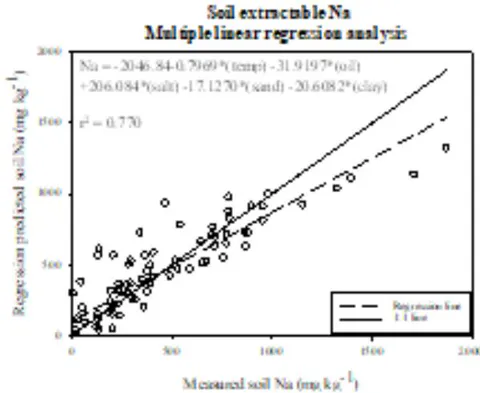
Multiple linear regression analysis for immediate post thermal treatment changes in soil properties follow (Figure 6). All models in the following descriptions were significant at . The regression model for soil pH change was well described by temperature , sand , clay , oil addition, and salt addition . Soil EC changes were well described by sand, clay, oil, and salt, but not temperature . Changes in soil extractable P were well described by temperature, sand, clay, and oil addition, but not salt . Changes in soil extractable K were related to temperature, sand, clay, oil, and salt . Changes in soil extractable Na were well described by temperature, sand, clay, oil and salt .
In this study, using four well described soils, temperature had a positive effect on soil pH, P, and K, a negative effect on Na, but was not an important effect for EC (Figure 6). Oil addition followed by TD treatment had a negative effect on soil pH, EC, P, K and Na. Salt additions had a positive effect on soil pH, EC, K, and Na, but was not an important effect on P. Soil clay content had a negative effect on soil pH, EC, and Na, but a positive effect on P and K.
Changes in other soil fertility parameters were not well related to the treatments or to soil texture. The low coefficient of determination for pH, indicating that the model accounts for less than half of the variability in the results, implies that other factors are responsible for pH changes than those investigated
here. It is very likely that the mineralogy of a soil, exchangeable aluminum, and calcium carbonate content will be among the most important to investigate in future studies.
No study to date has attempted to evaluate the stability/transience of soil chemical changes following thermal remediation. While previous studies have reported concerning rises in pH and substantial losses in nutrients, this study has developed results that provide a different narrative. In all soils and applied treatments, initial pH elevations that were in some cases substantially above the level of concern of 8.5 (Table 4), returned to pH within three to five wetting and drying cycles. This is an important result that indicates even the most severe increases in soil pH (<10.0) are mitigated by water and time to acceptable levels for revegetation and restored ecosystem function (Figures 1-4).
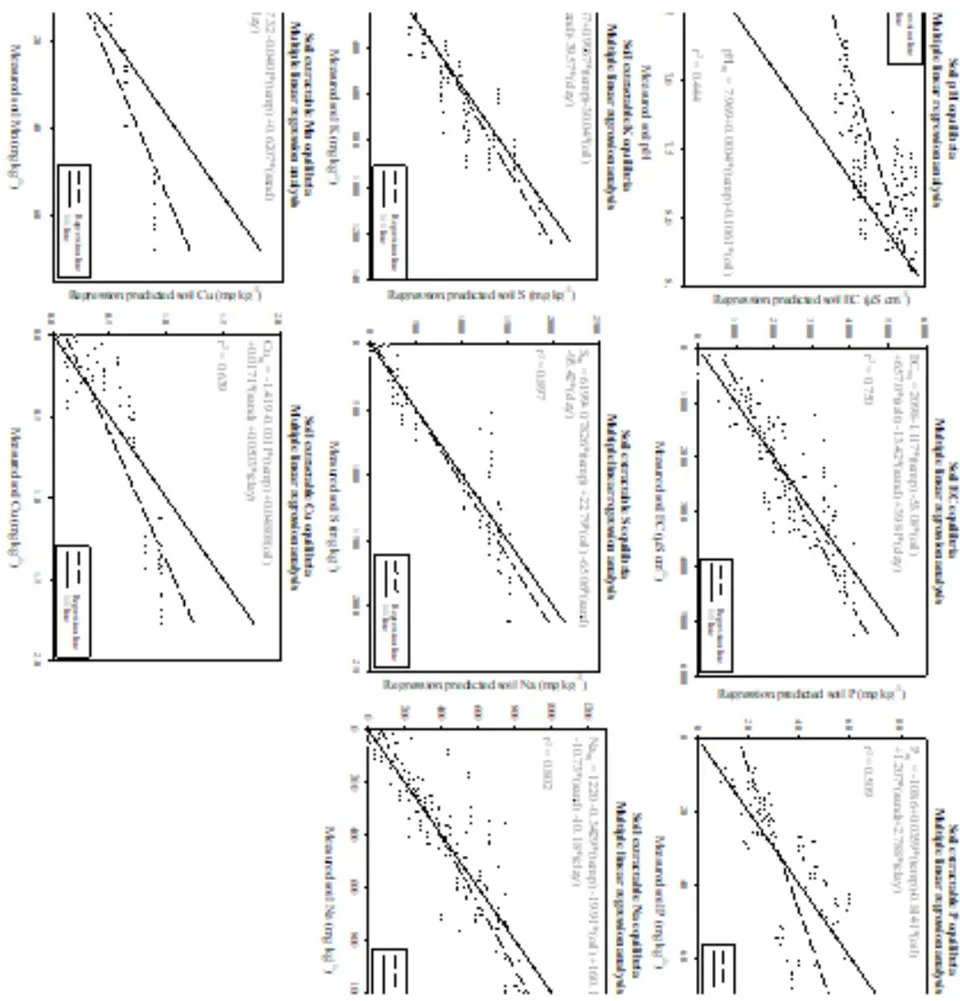
Multiple linear regression analysis of final equilibrium soil fertility status following the simulated soil weathering incubations can be used to better understand the chemical equilibria of soils after return to the site of excavation follow (Figure 7). All models in the following descriptions were significant at . Soil pH was positively related to temperature and negatively related to oil ( ). Soil EC was negatively affected by temperature, oil, and sand, and positively affected by salt and clay. Soil P was positively affected by temperature, sand, and clay, and negatively affected by oil. Soil K was positively affected by temperature, sand, and clay, and negatively affected by oil. Soil S was positively affected by temperature and oil, but negatively affected by both sand and clay. Soil Na was negatively affected by temperature, oil, sand, and clay, but positively affected by salt addition. Soil Mn was negatively affected by temperature, and positively affected by sand and clay. Finally, soil Cu was negatively affected by temperature, and positively affected by oil, sand, and clay content.
Notable among the findings regarding the stability of post thermal remediation fertility changes is the mitigation of extreme pH values after a small number of wetting and drying cycles. Previous studies reported increases in soil pH to well above the level of concern (Table 4) following high heat exposure (Pape et al., 2015; Vidonish et al., 2016). Equally important are the indications that both soil P and K may be increased, rather than decreased, as reported by the same studies. This outcome indicates that TD treatment of oil-impacted soils improves fertility, not simply compared with the highly toxic oil-impacted soil as reported by Vidonish et al. (2016), but also compared to the unimpacted soil. This outcome was observed in all four soils investigated in the current study. Finally, high salt contents also appear to be mitigated, improving the chances of successful revegetation in soils where
salinity or impacts with brine-containing produce waters are present.
V. CONCLUSION
The initial chemical changes in soils following TD treatment to reduce TPH content of impacted soils is important in determining only the suitability of initial conditions for revegetation of soils returned to their original sites. These changes to the chemical properties of soils associated with fertility can be substantial enough to constrain or prevent revegetation efforts. However, many of the previously reported post-thermal treatment (TD or smolder) changes are very likely transient, as demonstrated in the current study. Substantial changes continue to occur over time following fluxes of water and temperature until a new and stable soil chemical equilibrium is established. These changes are likely to be favorable to revegetation strategies. Therefore, it is vitally important to understand what this state will be in order to plan for long-term successful revegetation.
Of particular interest in this study were the mitigation of extreme pH increases over three to five wetting cycles, as well as the increases in plant available P and K important for successful establishment of rooting systems and early growth of plants in revegetation efforts. High salt contents also appear to be reduced following TD remediation of oil impacted soils. The outcomes from this study provide a better understanding of the final equilibrium chemical state of the soil following return to the landscape. The study does not predict the time required to reach equilibrium under natural conditions, but rather the relative magnitude of changes that will occur. Finally, soil type and texture differences strongly influenced plant available nutrient changes between the treatments imposed (e.g. temperature, oil and salt), and such differences should therefore remain a central factor in decision-making processes for remediation and revegetation projects.
Conflict of Interest
The authors declare no conflict of interest.
Figures and Tables
| Soil Series | Taxonomic Class (NCSS*) | Texture (% sand - silt - clay) | Textural Class |
| Amarillo (AM) | Fine-loamy, mixed, superactive, thermic Aridic Paleustalfs | 75-9-16 | Sandy Loam |
| Billings (BL) | Fine-silty, mixed, active, calcareous, mesic Typic Torrifluvents | 51-29-20 | Loam |
| Kettleman (KT) | Fine-loamy, mixed, superactive, thermic Typic Haplocambids | 49-19-32 | Sandy Clay Loam |
| Penwell (PN) | Siliceous, thermic Ustic Torripsamments | 99-1-0 | Sand |
| Soil Parameter | Method Description | Reference |
| Phosphorus (P) | Plant available nutrients. Extraction with Mehlich III (MIII) followed by analysis by Inductively Coupled Argon Plasma Atomic Emission Spectrometer (ICP-AES). | Mehlich, (1978) |
| Potassium (K) | Mehlich (1984) | |
| Calcium (Ca) | ||
| Magnesium (Mg) | ||
| Sulfur (S) | ||
| Sodium (Na) | ||
| Iron (Fe) | Plant available micronutrients. Extraction with DTPA followed by analysis by ICP-AES. | Lindsay and Norvell (1978) |
| Zinc (Zn) | ||
| Manganese (Mn) | ||
| Copper (Cu) | ||
| Soil pH | 2:1 soil:water by mass ratio using benchtop meter and glass ball pH probe | Schofield and Taylor (1955) |
| Electrical conductivity (EC) | Total salts by electrical conductivity using a benchtop meter and probe. | Rhoades (1982) |
| Total Petroleum Hydrocarbons (TPHs) | Analysis of an n-pentane extraction using gas chromatography (GC) followed by flame ionization detection (FID). | TNRCC method 1005 (2001) |
| Soil Texture | Particle size fraction of sand, silt, and clay composition of soils by Bouyous hydrometer method | Day (1965) |
| nC6 - nC12 | nC12 - nC28 | nC28 - nC35 | TPH | |
| Crude oil (mg kg-1) | 240,000 | 270,000 | 87,000 | 597,000 |
| 5% treatment (mg oil kg-1soil) | 12,000 | 13,500 | 4,350 | 29,850 |
| Parameter | Method | Units | Critical Value | Level of Concern |
| pH | 2:1 H2O:soil | - | <6.0 for most | >8.5 |
| phosphorus | MIII | mg kg-1 | 50 | 125 |
| potassium | MIII | mg kg-1 | 125-175* | -- |
| calcium | MIII | mg kg-1 | 180 | -- |
| magnesium | MIII | mg kg-1 | 50 | 500 |
| sodium | MIII | mg kg-1 | ** | 400 |
| sulfur | MIII | mg kg-1 | 13 | *** |
| iron | DTPA | mg kg-1 | 4.25 | -- |
| zinc | DTPA | mg kg-1 | 0.27-0.81* | 40 |
| manganese | DTPA | mg kg-1 | 0.16 | 30**** |
| copper | DTPA | mg kg-1 | 1 | 1.5**** |
| Thermal Treatment | Oil g kg-1 | Salt mS cm-1 | pH | EC μS cm-1 | P | K | Ca | Mg | S mg kg-1 | Na | Fe | Zn | Mn | Cu |
| 65°C | 0 | 0 | 7.80 | 123 | 16 | 357 | 5608 | 216 | 13 | 42 | 1.1 | 1.1 | 2.5 | 0.24 |
| 65°C | 0 | 1 | 7.86 | 465 | 15 | 360 | 5823 | 210 | 15 | 406 | 2.1 | 2.1 | 5.6 | 0.35 |
| 65°C | 0 | 3 | 7.93 | 2710 | 14 | 347 | 5467 | 194 | 12 | 979 | 1.5 | 1.9 | 4.9 | 0.31 |
| 300°C | 0 | 0 | 7.52 | 431 | 72 | 366 | 5842 | 166 | 83 | 49 | 5.2 | 1.7 | 9.0 | 0.48 |
| 300°C | 0 | 1 | 7.76 | 1506 | 67 | 388 | 5962 | 163 | 77 | 350 | 8.0 | 2.7 | 16.1 | 0.59 |
| 300°C | 0 | 3 | 7.96 | 2243 | 72 | 449 | 6311 | 162 | 79 | 953 | 7.6 | 4.2 | 20.9 | 0.73 |
| 300°C | 50 | 0 | 6.73 | 131 | 23 | 111 | 3201 | 68 | 54 | 17 | 1.9 | 0.2 | 3.9 | 0.13 |
| 300°C | 50 | 1 | 6.89 | 411 | 34 | 201 | 4616 | 90 | 90 | 189 | 4.9 | 0.4 | 9.3 | 0.26 |
| 300°C | 50 | 3 | 6.66 | 1029 | 50 | 311 | 5533 | 109 | 167 | 768 | 13.0 | 1.2 | 15.5 | 0.50 |
| 425°C | 0 | 0 | 7.65 | 245 | 78 | 606 | 8485 | 150 | 100 | 60 | 6.8 | 1.7 | 3.0 | 0.17 |
| 425°C | 0 | 1 | 7.95 | 1182 | 83 | 683 | 9746 | 143 | 105 | 274 | 12.1 | 2.9 | 5.2 | 0.16 |
| 425°C | 0 | 3 | 8.45 | 1461 | 71 | 751 | 10953 | 135 | 101 | 771 | 12.1 | 3.4 | 4.2 | 0.13 |
| 425°C | 50 | 0 | 6.76 | 615 | 82 | 468 | 6362 | 106 | 620 | 50 | 22.3 | 1.1 | 19.9 | 0.45 |
| 425°C | 50 | 1 | 7.13 | 1146 | 86 | 533 | 7285 | 109 | 611 | 237 | 31.7 | 1.2 | 14.5 | 0.67 |
| 425°C | 50 | 3 | 7.83 | 1880 | 75 | 636 | 9651 | 106 | 558 | 757 | 46.4 | 2.6 | 17.3 | 0.52 |
| 550°C | 0 | 0 | 7.33 | 150 | 77 | 778 | 9796 | 165 | 104 | 56 | 7.7 | 2.7 | 1.3 | 0.03 |
| 550°C | 0 | 1 | 9.19 | 1049 | 36 | 779 | 11570 | 201 | 107 | 357 | 11.5 | 3.0 | 0.5 | 0.04 |
| 550°C | 0 | 3 | 8.70 | 596 | 53 | 747 | 11168 | 181 | 97 | 133 | 11.1 | 4.1 | 0.8 | 0.04 |
| 550°C | 50 | 0 | 8.30 | 1109 | 63 | 514 | 8476 | 149 | 630 | 50 | 25.1 | 1.8 | 9.7 | 0.33 |
| 550°C | 50 | 1 | 8.12 | 897 | 53 | 590 | 11211 | 181 | 617 | 132 | 11.5 | 0.8 | 3.2 | 0.17 |
| 550°C | 50 | 3 | 9.33 | 1098 | 30 | 654 | 11566 | 200 | 707 | 376 | 20.9 | 1.5 | 5.1 | 0.31 |
| SM | 50 | 0 | 8.23 | 171 | 15 | 128 | 3389 | 91 | 84 | 19 | 1.1 | 0.2 | 1.6 | 0.07 |
| SM | 50 | 1 | 7.33 | 191 | 20 | 174 | 3964 | 93 | 63 | 154 | 4.1 | 1.2 | 7.0 | 0.24 |
| SM | 50 | 3 | 7.42 | 478 | 19 | 183 | 4079 | 97 | 67 | 488 | 3.6 | 0.4 | 5.0 | 0.18 |
| ANOVA Model Amarillo Soil | Temp | Oil | Salt | Temp x Oil | Temp x Salt | Oil x Salt | Temp x Oil x Salt |
| Soil Parameter | p-value | p-value | p-value | p-value | p-value | p-value | p-value |
| pH | 0.0133+ | 0.0035- | 0.0117- | 0.0013 | 0.1036 | - | - |
| EC | - | - | 0.0001+ | - | - | - | - |
| P | 0.0278+ | - | - | - | - | - | - |
| K | <0.0001+ | 0.0005- | 0.0717+ | 0.0983 | - | - | - |
| Ca | <0.0001+ | 0.0038- | 0.0106- | 0.0083 | - | - | - |
| Mg | - | 0.0005- | - | - | - | - | - |
| S | <0.0001+ | <0.0001- | - | <0.0001 | - | - | - |
| Na | 0.0062+ | - | <0.0001+ | - | 0.0030 | - | - |
| Fe | 0.0189+ | 0.0309- | - | - | - | - | - |
| Zn | 0.0591+ | <0.0001- | 0.0007+ | - | - | - | - |
| Mn | - | 0.0917+ | - | - | - | - | - |
| Cu | - | - | - | - | - | - | - |
Billings Soil - Post Thermal Treatment Soil Fertility
| Thermal Treatment | Oil g kg-1 | Salt mS cm-1 | pH | EC μS cm-1 | P | K | Ca | Mg | S mg kg-1 | Na | Fe | Zn | Mn | Cu |
| 65°C | 0 | 0 | 7.99 | 1401 | 9 | 191 | 5871 | 810 | 1314 | 698 | 3.9 | 0.2 | 2.0 | 0.37 |
| 65°C | 0 | 1 | 8.10 | 3430 | 10 | 183 | 7214 | 696 | 1202 | 952 | 2.9 | 0.2 | 1.9 | 0.35 |
| 65°C | 0 | 3 | 8.10 | 3545 | 11 | 214 | 7979 | 758 | 1379 | 1870 | 2.7 | 0.3 | 2.3 | 0.44 |
| 300°C | 0 | 0 | 7.73 | 2481 | 27 | 254 | 5715 | 658 | 1522 | 671 | 8.4 | 1.8 | 4.9 | 0.64 |
| 300°C | 0 | 1 | 7.79 | 3417 | 24 | 238 | 5491 | 618 | 1398 | 881 | 11.4 | 3.0 | 8.2 | 0.87 |
| 300°C | 0 | 3 | 7.88 | 3202 | 26 | 266 | 5407 | 651 | 1220 | 1708 | 15.3 | 4.4 | 13.4 | 1.38 |
| 300°C | 50 | 0 | 6.88 | 721 | 9 | 65 | 1952 | 248 | 505 | 231 | 2.0 | 0.1 | 4.0 | 0.13 |
| 300°C | 50 | 1 | 6.82 | 1303 | 6 | 23 | 1114 | 130 | 218 | 129 | 2.9 | 0.2 | 4.5 | 0.15 |
| 300°C | 50 | 3 | 7.13 | 1672 | 11 | 82 | 2353 | 279 | 580 | 780 | 4.4 | 0.4 | 6.0 | 0.23 |
| 425°C | 0 | 0 | 7.96 | 1543 | 29 | 455 | 4466 | 526 | 683 | 489 | 11.1 | 2.6 | 2.0 | 0.28 |
| 425°C | 0 | 1 | 8.26 | 2131 | 29 | 464 | 4098 | 507 | 546 | 712 | 13.8 | 3.8 | 2.2 | 0.29 |
| 425°C | 0 | 3 | 8.73 | 2970 | 31 | 528 | 4277 | 612 | 401 | 1323 | 14.6 | 3.9 | 2.0 | 0.26 |
| 425°C | 50 | 0 | 7.33 | 663 | 20 | 224 | 3513 | 292 | 723 | 299 | 10.8 | 0.5 | 6.8 | 0.20 |
| 425°C | 50 | 1 | 7.49 | 1539 | 26 | 267 | 4296 | 334 | 803 | 527 | 15.2 | 0.7 | 6.4 | 0.20 |
| 425°C | 50 | 3 | 7.90 | 2760 | 21 | 193 | 3615 | 312 | 528 | 779 | 17.7 | 0.9 | 6.2 | 0.22 |
| 550°C | 0 | 0 | 9.52 | 1140 | 33 | 561 | 4094 | 1407 | 402 | 236 | 12.2 | 1.0 | 1.1 | 0.09 |
| 550°C | 0 | 1 | 9.79 | 1316 | 26 | 552 | 4229 | 2770 | 336 | 293 | 14.3 | 0.8 | 1.4 | 0.06 |
| 550°C | 0 | 3 | 9.96 | 2385 | 23 | 541 | 5919 | 3815 | 277 | 463 | 17.4 | 0.8 | 1.6 | 0.07 |
| 550°C | 50 | 0 | 9.32 | 1045 | 33 | 371 | 3662 | 1015 | 656 | 184 | 23.4 | 0.8 | 8.7 | 0.46 |
| 550°C | 50 | 1 | 9.62 | 1333 | 31 | 437 | 3858 | 2630 | 553 | 293 | 33.0 | 1.1 | 7.9 | 0.41 |
| 550°C | 50 | 3 | 9.68 | 1744 | 25 | 449 | 4447 | 3168 | 512 | 540 | 41.5 | 1.4 | 9.2 | 0.42 |
| SM | 50 | 0 | 7.43 | 249 | 6 | 41 | 1376 | 196 | 327 | 123 | 1.4 | 0.0 | 2.0 | 0.11 |
| SM | 50 | 1 | 7.06 | 511 | 9 | 67 | 1694 | 233 | 467 | 261 | 3.6 | 0.2 | 3.5 | 0.15 |
| SM | 50 | 3 | 7.66 | 2040 | 14 | 169 | 3685 | 409 | 795 | 927 | 6.0 | 0.4 | 5.0 | 0.21 |
Table 8: Treatment effects on Billings soil properties following TD, oil, and salt treatments. Type I sum of squares. P value included for effects at or very near Interactive effects considered significant only if all simple effects in the interaction are significant at or very near . + and - signs next to p-values for single effects indicated whether the treatment effect positively or negatively influences parameter
| ANOVA Model Billings soil | Temp | Oil | Salt | Temp x Oil | Temp x Salt | Oil x Salt | Temp x Oil x Salt |
| Soil Parameter | p-value | p-value | p-value | p-value | p-value | p-value | p-value |
| pH | 0.0004+ | 0.0056- | - | 0.0039 | - | - | - |
| EC | 0.0184- | 0.0222- | 0.0342+ | - | - | - | - |
| P | <0.0001+ | 0.0027- | - | 0.0131 | - | - | - |
| K | <0.0001+ | <0.0001- | - | 0.0079 | - | - | - |
| Ca | 0.0014- | <0.0001- | - | 0.0002 | - | - | - |
| Mg | 0.0095+ | - | - | - | - | - | - |
| S | 0.0003- | - | - | - | - | - | - |
| Na | <0.0001+ | 0.0032- | <0.0001+ | 0.0591 | 0.0127 | - | - |
| Fe | <0.0001+ | 0.0467- | 0.0003- | <0.0001 | 0.0079 | - | - |
| Zn | - | 0.0320- | - | - | - | - | - |
| Mn | - | 0.0642- | - | - | - | - | - |
| Cu | - | - | - | - | - | - | - |
Kettleman Soil - Post Thermal Treatment Soil Fertility
| Thermal Treatment | Oil g kg-1 | Salt mS cm-1 | pH | EC μS cm-1 | P | K | Ca | Mg | S mg kg-1 | Na | Fe | Zn | Mn | Cu |
| 65°C | 0 | 0 | 7.93 | 341 | 25 | 468 | 6259 | 921 | 55 | 390 | 3.1 | 0.2 | 3.9 | 0.38 |
| 65°C | 0 | 1 | 7.73 | 305 | 26 | 473 | 6416 | 935 | 59 | 714 | 1.1 | 0.2 | 7.0 | 0.38 |
| 65°C | 0 | 3 | 7.66 | 753 | 29 | 494 | 6408 | 890 | 54 | 1391 | 1.0 | 0.5 | 8.3 | 0.41 |
| 300°C | 0 | 0 | 7.42 | 497 | 49 | 677 | 6681 | 687 | 109 | 374 | 24.3 | 0.7 | 18.3 | 0.53 |
| 300°C | 0 | 1 | 7.32 | 1203 | 45 | 627 | 6483 | 662 | 97 | 650 | 18.3 | 0.7 | 25.3 | 0.64 |
| 300°C | 0 | 3 | 7.43 | 1915 | 47 | 628 | 6461 | 601 | 98 | 1152 | 22.2 | 1.0 | 37.2 | 0.88 |
| 300°C | 50 | 0 | 6.80 | 438 | 20 | 162 | 2875 | 244 | 58 | 129 | 2.4 | 0.0 | 5.6 | 0.21 |
| 300°C | 50 | 1 | 6.95 | 535 | 22 | 217 | 3320 | 274 | 63 | 275 | 3.8 | 0.0 | 8.8 | 0.32 |
| 300°C | 50 | 3 | 6.73 | 651 | 31 | 320 | 4260 | 313 | 101 | 704 | 6.0 | 0.1 | 11.5 | 0.40 |
| 425°C | 0 | 0 | 6.95 | 490 | 52 | 858 | 5281 | 356 | 254 | 202 | 34.9 | 1.3 | 11.5 | 0.58 |
| 425°C | 0 | 1 | 7.22 | 709 | 52 | 826 | 5947 | 413 | 223 | 406 | 31.2 | 1.2 | 19.5 | 0.54 |
| 425°C | 0 | 3 | 7.42 | 1462 | 52 | 903 | 5787 | 359 | 240 | 785 | 28.4 | 1.8 | 18.6 | 0.46 |
| 425°C | 50 | 0 | 6.76 | 1581 | 58 | 653 | 4945 | 237 | 525 | 200 | 36.0 | 0.4 | 37.5 | 1.00 |
| 425°C | 50 | 1 | 7.08 | 844 | 59 | 619 | 4874 | 204 | 455 | 315 | 23.8 | 0.3 | 29.5 | 0.68 |
| 425°C | 50 | 3 | 7.16 | 824 | 61 | 712 | 4991 | 220 | 448 | 643 | 32.6 | 0.5 | 35.2 | 1.11 |
| 550°C | 0 | 0 | 7.12 | 788 | 57 | 902 | 4085 | 252 | 292 | 127 | 12.6 | 0.9 | 8.6 | 0.34 |
| 550°C | 0 | 1 | 7.72 | 600 | 62 | 910 | 4582 | 256 | 295 | 190 | 14.8 | 1.4 | 5.3 | 0.26 |
| 550°C | 0 | 3 | 8.85 | 1371 | 60 | 990 | 5192 | 272 | 304 | 336 | 11.0 | 0.8 | 5.3 | 0.35 |
| 550°C | 50 | 0 | 7.38 | 776 | 61 | 733 | 4300 | 240 | 585 | 134 | 24.0 | 0.5 | 33.0 | 1.13 |
| 550°C | 50 | 1 | 7.55 | 989 | 54 | 678 | 4165 | 234 | 617 | 201 | 24.7 | 0.6 | 26.5 | 1.11 |
| 550°C | 50 | 3 | 8.26 | 2070 | 54 | 753 | 4661 | 249 | 633 | 362 | 20.5 | 0.5 | 20.0 | 1.11 |
| SM | 50 | 0 | 7.10 | 232 | 19 | 139 | 2521 | 260 | 46 | 102 | 4.0 | 0.0 | 6.1 | 0.29 |
| SM | 50 | 1 | 6.73 | 1046 | 30 | 401 | 4041 | 410 | 235 | 307 | 7.2 | 0.1 | 7.8 | 0.24 |
| SM | 50 | 3 | 6.68 | 2104 | 51 | 966 | 6185 | 541 | 617 | 867 | 26.7 | 0.9 | 24.4 | 0.83 |
| ANOVA Model Kettleman soil | Temp | Oil | Salt | Temp x Oil | Temp x Salt | Oil x Salt | Temp x Oil x Salt |
| Soil Parameter | p-value | p-value | p-value | p-value | p-value | p-value | p-value |
| pH | 0.0456- | 0.0141- | 0.0248- | 0.0675 | 0.0133 | - | - |
| EC | 0.0344+ | - | 0.0081+ | - | - | - | - |
| P | <0.0001+ | 0.0883- | - | 0.0575 | - | - | - |
| K | <0.0001+ | <0.0001- | - | 0.0078 | - | - | - |
| Ca | 0.0021- | 0.0004- | - | 0.0082 | - | - | - |
| Mg | <0.0001- | <0.0001- | - | <0.0001 | - | - | - |
| S | <0.0001+ | 0.0004- | - | <0.0001 | - | - | - |
| Na | <0.0001- | 0.0077- | <0.0001+ | 0.0497 | 0.0001 | - | - |
| Fe | 0.0229+ | - | - | - | - | - | - |
| Zn | 0.0078+ | 0.0001- | - | - | - | - | - |
| Mn | - | - | - | - | - | - | - |
| Cu | 0.0113- | 0.0114- | - | 0.0003 | - | - | - |
Penwell Soil - Post Thermal Treatment Soil Fertility
| Thermal Treatment | Oil g kg-1 | Salt mS cm-1 | pH | EC μS cm-1 | P | K | Ca | Mg | S mg kg-1 | Na | Fe | Zn | Mn | Cu |
| 65°C | 0 | 0 | 8.06 | 76 | 5 | 47 | 456 | 53 | 2 | 3 | 1.5 | 0.1 | 1.6 | 0.05 |
| 65°C | 0 | 1 | 8.10 | 340 | 5 | 58 | 449 | 57 | 2 | 283 | 1.1 | 0.1 | 2.2 | 0.06 |
| 65°C | 0 | 3 | 7.96 | 784 | 5 | 66 | 459 | 56 | 2 | 896 | 1.2 | 0.1 | 2.3 | 0.07 |
| 300°C | 0 | 0 | 7.98 | 42 | 11 | 66 | 468 | 56 | 6 | 23 | 3.4 | 0.1 | 1.9 | 0.06 |
| 300°C | 0 | 1 | 7.73 | 545 | 10 | 62 | 530 | 51 | 4 | 226 | 2.3 | 0.3 | 3.4 | 0.13 |
| 300°C | 0 | 3 | 8.06 | 2215 | 11 | 78 | 437 | 48 | 5 | 861 | 3.6 | 0.4 | 3.9 | 0.11 |
| 300°C | 50 | 0 | 5.82 | 28 | 1 | 3 | 53 | 8 | 1 | 1 | 0.1 | 0.0 | 0.4 | 0.01 |
| 300°C | 50 | 1 | 7.12 | 333 | 1 | 7 | 102 | 9 | 2 | 51 | 0.2 | 0.0 | 0.3 | 0.01 |
| 300°C | 50 | 3 | 6.39 | 454 | 1 | 7 | 82 | 9 | 3 | 205 | 0.8 | 0.0 | 1.1 | 0.02 |
| 425°C | 0 | 0 | 7.66 | 60 | 12 | 81 | 342 | 47 | 5 | 12 | 3.2 | 0.1 | 0.4 | 0.02 |
| 425°C | 0 | 1 | 7.99 | 366 | 13 | 112 | 457 | 48 | 6 | 226 | 3.3 | 0.4 | 0.6 | 0.03 |
| 425°C | 0 | 3 | 8.42 | 3070 | 15 | 147 | 594 | 56 | 10 | 869 | 3.6 | 0.4 | 0.5 | 0.03 |
| 425°C | 50 | 0 | 6.62 | 55 | 2 | 10 | 149 | 13 | 16 | 1 | 0.6 | 0.0 | 0.6 | 0.01 |
| 425°C | 50 | 1 | 6.39 | 166 | 6 | 38 | 183 | 21 | 124 | 120 | 1.0 | 0.0 | 0.9 | 0.01 |
| 425°C | 50 | 3 | 6.98 | 865 | 5 | 46 | 461 | 22 | 186 | 588 | 1.1 | 0.1 | 0.9 | 0.01 |
| 550°C | 0 | 0 | 7.35 | 64 | 13 | 106 | 300 | 54 | 6 | 14 | 3.0 | 0.1 | 0.2 | 0.01 |
| 550°C | 0 | 1 | 7.59 | 274 | 14 | 136 | 508 | 68 | 10 | 123 | 1.6 | 0.1 | 0.1 | 0.01 |
| 550°C | 0 | 3 | 8.22 | 876 | 14 | 178 | 515 | 59 | 15 | 515 | 2.0 | 0.4 | 0.1 | 0.01 |
| 550°C | 50 | 0 | 6.33 | 711 | 15 | 145 | 479 | 107 | 307 | 26 | 11.0 | 0.3 | 8.6 | 0.02 |
| 550°C | 50 | 1 | 6.66 | 908 | 15 | 130 | 460 | 90 | 301 | 111 | 3.5 | 0.4 | 4.1 | 0.02 |
| 550°C | 50 | 3 | 6.66 | 701 | 15 | 150 | 493 | 78 | 400 | 389 | 3.8 | 0.8 | 4.0 | 0.02 |
| SM | 50 | 0 | 6.40 | 59 | 1 | 8 | 100 | 14 | 6 | 2 | 0.5 | 0.0 | 1.0 | 0.01 |
| SM | 50 | 1 | 6.72 | 212 | 1 | 7 | 92 | 13 | 4 | 82 | 0.4 | 0.0 | 0.7 | 0.02 |
| SM | 50 | 3 | 6.43 | 228 | 1 | 9 | 97 | 11 | 10 | 132 | 1.1 | 0.0 | 0.9 | 0.02 |
Table 12: Treatment effects on Penwell soil properties following TD, oil, and salt treatments. Type I sum of squares. P value included for effects at or very near . Interactive effects considered significant only if all simple effects in the interaction are significant at or very near . + and - signs next to p-values for single effects indicated whether the treatment effect positively or negatively influences parameter
| ANOVA Model Penwell soil | Temp | Oil | Salt | Temp x Oil | Temp x Salt | Oil x Salt | Temp x Oil x Salt |
| Soil Parameter | p-value | p-value | p-value | p-value | p-value | p-value | p-value |
| pH | 0.0026- | <0.0001- | 0.0079- | - | - | - | - |
| EC | - | - | 0.0015+ | - | - | - | - |
| P | <0.0001+ | <0.0001- | - | 0.0013 | - | - | - |
| K | <0.0001+ | <0.0001- | 0.0211+ | 0.0005 | - | - | - |
| Ca | - | <0.0001- | 0.0150- | - | - | - | - |
| Mg | 0.0186+ | 0.0062- | - | <0.0001 | - | - | - |
| S | <0.0001+ | <0.0001- | 0.0380- | <0.0001 | - | 0.0546 | - |
| Na | 0.0321- | 0.0034- | <0.0001+ | 0.0764 | 0.0423 | 0.0048 | - |
| Fe | <0.0265+ | - | - | - | - | - | - |
| Zn | 0.0096- | - | 0.0027+ | - | 0.0052 | - | - |
| Mn | - | - | - | - | - | - | - |
| Cu | 0.0099- | 0.0463- | - | - | - | - | - |
Amarillo Soil - Nutrient Changes Following Rapid Weathering Incubations
| Thermal Treatment | Oil mg kg-1 | Salt mS cm-1 | P | K | Ca | Mg | S | Na Δ mg kg-1 | Fe | Zn | Mn | Cu |
| 65°C | 0 | 0 | 4 | 20 | -475 | -37 | 7 | -6 | 0.2 | 0.5 | 15.7 | 0.17 |
| 65°C | 0 | 1 | 4 | 32 | -538 | -40 | 6 | -140 | -0.5 | 0.3 | 13.6 | 0.09 |
| 65°C | 0 | 3 | 3 | -5 | -88 | -23 | 5 | -338 | -0.5 | 1.0 | 14.5 | 0.02 |
| 300°C | 0 | 0 | 1 | 122 | -159 | -2 | -22 | -4 | -3.9 | -0.2 | 5.7 | -0.22 |
| 300°C | 0 | 1 | -4 | 148 | -443 | -3 | -13 | -73 | -6.3 | -0.2 | 1.0 | -0.21 |
| 300°C | 0 | 3 | -11 | -39 | -705 | -13 | -25 | -331 | -6.2 | -1.6 | -5.3 | -0.33 |
| 300°C | 50 | 0 | 30 | 305 | 2078 | 77 | 24 | 20 | -0.4 | 0.9 | 4.4 | 0.39 |
| 300°C | 50 | 1 | 19 | 200 | 930 | 52 | 16 | 23 | -3.4 | 0.6 | -1.7 | 0.23 |
| 300°C | 50 | 3 | 4 | 45 | -230 | 26 | -53 | -167 | -10.7 | 0.2 | -5.9 | -0.01 |
| 425°C | 0 | 0 | 5 | 84 | 765 | -8 | -8 | -2 | -5.4 | -0.9 | 0.8 | -0.10 |
| 425°C | 0 | 1 | -4 | 80 | 698 | -16 | -17 | -10 | -10.3 | -1.2 | -2.3 | 0.01 |
| 425°C | 0 | 3 | -9 | -47 | 3265 | -10 | -10 | -49 | -10.5 | -2.3 | -2.8 | -0.07 |
| 425°C | 50 | 0 | -7 | 250 | 946 | 14 | -171 | 0 | -18.1 | -0.5 | -13.6 | -0.22 |
| 425°C | 50 | 1 | -20 | -14 | -325 | -1 | -297 | -68 | -25.7 | -0.5 | -7.9 | -0.37 |
| 425°C | 50 | 3 | -12 | -96 | -543 | -8 | -178 | -266 | -39.0 | -1.3 | -11.6 | -0.22 |
| 550°C | 0 | 0 | -17 | 76 | 1138 | 15 | -21 | -2 | -5.0 | -2.0 | -0.8 | -0.01 |
| 550°C | 0 | 1 | -5 | 144 | 2626 | -40 | -21 | -20 | -9.5 | -2.1 | -0.3 | -0.02 |
| 550°C | 0 | 3 | -16 | 109 | 4080 | -4 | -10 | 38 | -9.0 | -3.3 | -0.6 | -0.02 |
| 550°C | 50 | 0 | -21 | 134 | 3810 | 20 | -173 | 6 | -19.4 | -1.2 | -7.1 | -0.17 |
| 550°C | 50 | 1 | -21 | 91 | 3838 | -3 | -93 | 18 | -4.9 | -0.1 | -0.7 | 0.01 |
| 550°C | 50 | 3 | -3 | 12 | 1357 | -30 | -133 | -10 | -14.6 | -0.7 | -3.4 | -0.17 |
| SM | 50 | 0 | 23 | 236 | 2604 | 112 | 80 | 48 | 1.4 | 1.5 | 13.0 | 0.38 |
| SM | 50 | 1 | 18 | 173 | 1861 | 88 | 46 | 126 | -1.3 | 1.5 | 8.9 | 0.26 |
| SM | 50 | 3 | 22 | 180 | 1815 | 83 | 52 | 322 | -1.0 | 4.1 | 10.9 | 0.23 |
| Thermal Treatment | Oil mg kg-1 | Salt mS cm-1 | P | K | Ca | Mg | S Δ mg kg-1 | Na | Fe | Zn | Mn | Cu |
| 65°C | 0 | 0 | 2 | -13 | -180 | -165 | -260 | -296 | -2.9 | -0.1 | 0.2 | -0.22 |
| 65°C | 0 | 1 | 2 | 9 | -906 | -70 | -175 | -380 | -2.0 | -0.1 | -0.4 | -0.22 |
| 65°C | 0 | 3 | 1 | -3 | -1590 | -79 | -229 | -748 | -1.8 | -0.2 | -0.9 | -0.29 |
| 300°C | 0 | 0 | -8 | -43 | -344 | -121 | -490 | -314 | -6.8 | -0.6 | 3.3 | -0.23 |
| 300°C | 0 | 1 | -5 | -22 | -213 | -54 | -132 | -343 | -10.6 | -2.6 | -5.2 | -0.68 |
| 300°C | 0 | 3 | -5 | -46 | -239 | -92 | 119 | -644 | -14.5 | -3.5 | -9.6 | -1.05 |
| 300°C | 50 | 0 | 4 | 54 | 3173 | 134 | 319 | -2 | -1.6 | 0.0 | -2.0 | -0.04 |
| 300°C | 50 | 1 | 7 | 109 | 4308 | 268 | 689 | 270 | -2.6 | -0.1 | -2.2 | -0.04 |
| 300°C | 50 | 3 | 1 | 39 | 1731 | 95 | 158 | -209 | -4.0 | -0.2 | -3.8 | -0.13 |
| 425°C | 0 | 0 | -3 | -69 | 926 | -19 | 862 | -96 | -9.5 | -1.8 | -0.9 | -0.09 |
| 425°C | 0 | 1 | -3 | -65 | 919 | -10 | 852 | -118 | -13.0 | -3.4 | -1.8 | -0.20 |
| 425°C | 0 | 3 | -5 | -134 | 253 | -106 | 593 | -350 | -13.8 | -3.4 | -1.6 | -0.18 |
| 425°C | 50 | 0 | 9 | 70 | 1616 | 99 | 794 | -78 | -9.3 | -0.3 | -2.6 | 0.03 |
| 425°C | 50 | 1 | 3 | 22 | 988 | 58 | 673 | -159 | -12.9 | -0.3 | -1.7 | 0.05 |
| 425°C | 50 | 3 | 7 | 98 | 1619 | 134 | 805 | -79 | -14.7 | -0.3 | -1.8 | 0.04 |
| 550°C | 0 | 0 | -9 | 113 | 5664 | -274 | 1102 | 8 | -10.6 | -0.9 | -0.9 | -0.07 |
| 550°C | 0 | 1 | -4 | 183 | 8756 | -619 | 1138 | 97 | -13.2 | -0.7 | -1.3 | -0.05 |
| 550°C | 0 | 3 | -2 | 345 | 11964 | -718 | 1391 | 287 | -16.3 | -0.8 | -1.5 | -0.05 |
| 550°C | 50 | 0 | -6 | 111 | 2092 | -151 | 1030 | -17 | -20.3 | -0.7 | -7.3 | -0.28 |
| 550°C | 50 | 1 | 10 | 107 | 4601 | -723 | 1418 | -21 | -30.0 | -1.0 | -7.2 | -0.31 |
| 550°C | 50 | 3 | -8 | 151 | 9618 | -822 | 1281 | -138 | -38.1 | -1.3 | -8.5 | -0.34 |
| SM | 50 | 0 | 5 | 61 | 3660 | 242 | 638 | 196 | -0.2 | 0.2 | 6.4 | 0.14 |
| SM | 50 | 1 | 6 | 120 | 4016 | 339 | 1132 | 463 | -1.5 | 0.3 | 4.9 | 0.14 |
| SM | 50 | 3 | 6 | 71 | 1686 | 199 | 793 | 385 | -3.5 | 0.2 | 2.3 | 0.09 |
Kettleman Soil - Nutrient Changes Following Rapid Weathering Incubations
| Thermal Treatment | Oil mg kg-1 | Salt mS cm-1 | P | K | Ca | Mg | S | Na Δ mg kg-1 | Fe | Zn | Mn | Cu |
| 65°C | 0 | 0 | 6 | 13 | -438 | -45 | 12 | -88 | -0.8 | 0.3 | 57.8 | 1.32 |
| 65°C | 0 | 1 | 4 | -13 | -488 | -99 | -2 | -227 | 0.8 | 0.1 | 46.8 | 0.95 |
| 65°C | 0 | 3 | 1 | 3 | -780 | -79 | 2 | -443 | 1.3 | -0.2 | 50.2 | 1.11 |
| 300°C | 0 | 0 | -8 | -60 | -806 | -13 | -20 | -75 | -22.7 | -0.4 | 16.5 | -0.03 |
| 300°C | 0 | 1 | 1 | 3 | -398 | -9 | -5 | -203 | -20.6 | -0.6 | 3.1 | -0.25 |
| 300°C | 0 | 3 | 15 | 287 | 2300 | 307 | 42 | 148 | -2.1 | 0.1 | 19.5 | 1.08 |
| 300°C | 50 | 0 | -6 | -45 | -530 | -20 | -20 | -164 | -16.3 | -0.3 | 14.2 | -0.02 |
| 300°C | 50 | 1 | 15 | 315 | 2584 | 338 | 55 | 122 | -0.7 | 0.2 | 24.0 | 0.97 |
| 300°C | 50 | 3 | 7 | 171 | 1041 | 185 | -11 | -23 | -4.2 | 0.1 | 15.5 | 0.96 |
| 425°C | 0 | 0 | -6 | 122 | 1298 | 59 | -8 | 52 | -33.4 | -1.1 | -5.1 | -0.40 |
| 425°C | 0 | 1 | 1 | 74 | 649 | 27 | -28 | 80 | -26.7 | -1.5 | -13.2 | -0.30 |
| 425°C | 0 | 3 | -11 | 179 | 1109 | 109 | 81 | 48 | -21.1 | -0.2 | -15.7 | 0.59 |
| 425°C | 50 | 0 | -8 | 77 | 556 | 31 | -30 | 45 | -29.7 | -1.0 | -8.2 | -0.36 |
| 425°C | 50 | 1 | -15 | 128 | 699 | 104 | -4 | 0 | -33.3 | -0.4 | -19.9 | 0.32 |
| 425°C | 50 | 3 | -12 | 100 | 680 | 65 | 3 | -8 | -29.8 | -0.4 | -20.6 | 0.34 |
| 550°C | 0 | 0 | -13 | 170 | 1526 | 154 | 29 | 2 | -11.1 | -0.8 | -7.6 | -0.29 |
| 550°C | 0 | 1 | 2 | 199 | 1764 | 15 | 91 | 59 | -9.4 | -0.6 | -4.7 | -0.30 |
| 550°C | 0 | 3 | -5 | 176 | 1359 | 86 | 42 | -2 | -22.1 | -0.5 | -19.0 | -0.64 |
| 550°C | 50 | 0 | -15 | 185 | 1954 | 105 | 59 | 24 | -13.1 | -1.2 | -4.7 | -0.21 |
| 550°C | 50 | 1 | -18 | 79 | 751 | 72 | -9 | -21 | -20.0 | -0.5 | -23.4 | -0.47 |
| 550°C | 50 | 3 | -3 | 149 | 1047 | 26 | 9 | -38 | -18.0 | -0.4 | -14.1 | -0.69 |
| SM | 50 | 0 | 13 | 370 | 3526 | 480 | 89 | 208 | 0.7 | 0.2 | 22.5 | 0.61 |
| SM | 50 | 1 | 7 | 287 | 2226 | 284 | 140 | 157 | -1.5 | 0.1 | 16.3 | 0.46 |
| SM | 50 | 3 | -6 | -72 | 548 | 71 | -20 | -51 | -20.3 | -0.3 | -6.9 | -0.23 |
Penwell Soil - Nutrient Changes Following Rapid Weathering Incubations
| Thermal Treatment | Oil mg kg-1 | Salt mS cm-1 | P | K | Ca | Mg | S | Na Δ mg kg-1 | Fe | Zn | Mn | Cu |
| 65°C | 0 | 0 | 8 | 24 | 151 | 5 | 2 | 10 | -0.8 | -0.1 | -0.9 | -0.01 |
| 65°C | 0 | 1 | 7 | 21 | 178 | -2 | 2 | -97 | -0.6 | 0.0 | -1.3 | -0.02 |
| 65°C | 0 | 3 | 2 | 22 | 102 | -1 | 2 | -214 | -0.7 | -0.1 | -1.1 | -0.03 |
| 300°C | 0 | 0 | 6 | 18 | 232 | 6 | 3 | -2 | -2.5 | 0.0 | -1.2 | -0.04 |
| 300°C | 0 | 1 | 2 | 19 | 104 | -1 | 2 | -342 | -3.1 | -0.2 | -3.0 | -0.07 |
| 300°C | 0 | 3 | 1 | 13 | 176 | 7 | 14 | 28 | -0.1 | 0.0 | 0.0 | 0.01 |
| 300°C | 50 | 0 | 7 | 29 | 31 | 1 | 2 | -29 | -1.7 | 0.0 | -2.4 | -0.08 |
| 300°C | 50 | 1 | 1 | 14 | 169 | 10 | 22 | 3 | -0.1 | 0.0 | -0.1 | 0.01 |
| 300°C | 50 | 3 | 1 | 11 | 180 | 6 | 11 | -128 | -0.8 | 0.0 | -0.9 | 0.00 |
| 425°C | 0 | 0 | 7 | 38 | 213 | 6 | 3 | 4 | -2.3 | 0.0 | -0.2 | 0.00 |
| 425°C | 0 | 1 | 2 | 15 | 117 | -1 | 5 | -178 | -3.0 | -0.3 | -0.4 | 0.03 |
| 425°C | 0 | 3 | 5 | 39 | 176 | 5 | 8 | -8 | -0.6 | 0.0 | -0.2 | 0.01 |
| 425°C | 50 | 0 | 10 | 52 | 209 | 3 | 2 | -31 | -2.5 | -0.3 | -0.5 | 0.00 |
| 425°C | 50 | 1 | 6 | 58 | 323 | 14 | 67 | 8 | -0.4 | 0.0 | -0.3 | 0.01 |
| 425°C | 50 | 3 | 7 | 81 | 461 | 13 | 77 | 131 | -0.6 | 0.0 | 0.2 | 0.01 |
| 550°C | 0 | 0 | 14 | 87 | 229 | 20 | 3 | 7 | -1.9 | -0.1 | -0.2 | 0.01 |
| 550°C | 0 | 1 | 4 | 32 | 94 | 1 | 9 | -107 | -1.5 | -0.3 | -0.1 | 0.01 |
| 550°C | 0 | 3 | 5 | 33 | 90 | -2 | 10 | -16 | -2.6 | -0.3 | -2.5 | 0.01 |
| 550°C | 50 | 0 | 12 | 59 | 161 | 8 | 8 | 4 | -1.0 | -0.1 | -0.1 | 0.01 |
| 550°C | 50 | 1 | 5 | 36 | 164 | -1 | 14 | -8 | -9.7 | -0.2 | -6.2 | 0.00 |
| 550°C | 50 | 3 | 5 | 59 | 63 | 6 | 1 | -38 | -2.9 | -0.6 | -2.1 | 0.00 |
| SM | 50 | 0 | 2 | 25 | 209 | 26 | 49 | 19 | -0.1 | 0.0 | -0.3 | 0.00 |
| SM | 50 | 1 | 0 | 16 | 101 | 11 | 26 | 45 | -0.1 | 0.0 | -0.4 | -0.01 |
| SM | 50 | 3 | 3 | 53 | 327 | 25 | 72 | 421 | -0.4 | 0.0 | 0.2 | 0.00 |