
I. INTRODUCTION
a) Carbon emission and capture
Electric power plants, and cement and steel industry facilities, release flue gas (FG) that contains a large amount of pollutants, along with hot steam and unreacted nitrogen. The pollutants include fly ash, carbon dioxide (CO2), the associated toxic components (ATCs), such as nitrogen oxides (NOx, ), sulfur oxides (SOy, ), mercury (Hg) and its oxides, oxides of some other metals, acid vapors, volatile organic compounds (VOCs), soot, and particulate matter (PM) [1,1a-g]. With the existing state of the art, clean energy technologies' capture of the polluting components and CO2 is very costly and materials intensive [1-45, 45a-w].
These pollutants cause environmental damage and contribute to global warming. Literature abounds on the nature of these emissions and their effect on health [2a-g] and the environment [1- 45a], including ocean acidification [45b]. There is also literature on the current state-of-the-art technologies for capturing these emissions, and the cost implications to control the emissions in part or in full [1-45]. By studying all this literature [1-61], we find that:
The emission capture technologies developed so far are still quite expensive [23,24,25,45h,50], and capture of the components (e.g. CO2, NOx, SOx, CO, Hg) is still not possible.
The technology for storing CO2 under high pressure in an empty coal or oil field [45a-h, 55, 1b-1g] is still quite expensive, and leakage into the atmosphere is a possibility. It involves compression to high pressure (2500 to 3000 psi) and passing through hundreds or thousands of miles of pipelines into underground geological formations [5a-h]. The stored CO2 may be mixed with impurities, and rapid utilization of the stored or captured CO2 is not possible. The oldest power stations may be uneconomical to retrofit with modern amine scrubbing technologies. The cost of capture of gaseous CO2 by amine scrubbing still ranges between 61 per ton of CO2 captured.
Various technologies are used to capture carbon dioxide from the air, an industrial source or a power plant flue gas. These include absorption, adsorption, chemical looping, or membrane gas separation technologies [45c]. The leading carbon capture technology uses various forms of amines [45a-f]. Even though modern CO2 capture technologies could reduce the CO2 emissions to the atmosphere by approximately 80-90%, they increase the cost of electricity by an additional 21-91%. According to experts, the additional increase in delivery cost would put a severe burden on consumers. The cost of direct carbon capture by sucking carbon directly out of the air - by using fans and absorbing it into solutions of Ca(OH)2 or KOH and then regenerating CO2 by heating the solutions - has fallen from 98-$234 per ton. It is still too expensive to be employed on a large scale.
With amine-based solutions for CO2 removal, SO2 must be removed by techniques such as flue-gas desulfurization (FGD), to avoid potential reactions with the amine-based solutions. However, techniques to remove NOx are often not employed to minimize the capture cost. The carbon capture results in an energy penalty of , depending on the type of carbon capture technology employed. This leads to additional emissions of CO2 and also of NOx and PM [45g].
There are secondary pollutants from the chemical-based emission capture technologies developed so far, like the nitroso compounds in amine scrubbing of CO2 [60], which are carcinogenic.
Because of the high cost, as of 2019, there were only 17 operating carbon capture and sequestration (CCS) projects in the world, capturing 31.5 million tons of CO2 per year, of which 3.7 million tons is stored geologically [45e].
According to an organization which promotes CCS, it will cost 140 per ton of CO2. This will add from 196 to the cost of a MWh of coal generation [61]. b) Need for a new carbon capture technology
Thus, we see that there is a need for research on the development of technologies for the low-cost capture of CO2 and the ATCs of the FG emission and the storage of CO2 and its utilization. This paper presents a brief description of a new technology for emission capture (NTEC) which would capture industrial emissions, CO2 and the ATCs, at a nearly rate, using less energy and at a cost lower than the lowest of all existing technologies [5]. This paper's main thrust is on very cost-effective storage of the vast amount of dry ice that would be available using NTEC in the future and the use of the dry ice for future air conditioning to save carbon and consumers' cost. References for sections I.1 and I.2 are given in Appendix C. NTEC has been
patented in Jun 2, 2020[US patent No. 10670334] by the authors.
Modern refrigeration and air conditioning (AC) systems consume a significant amount of electric energy [1-3], generation of which gives rise to emissions of CO2 and many toxic components which not only contribute to global warming but also have many environmental effects ([2a-g] of Appendix C). The cost of running the dry ice AC is analyzed and compared with current AC, and a method of storing the dry ice that would be available with NTEC is described. The carbon saving from the future use of such air conditioning systems is discussed. Finally, the positive environmental effect it would have in the future is discussed.
II. A VAST AMOUNT OF DRY ICE TO BE
AVAILABLE USING NTEC
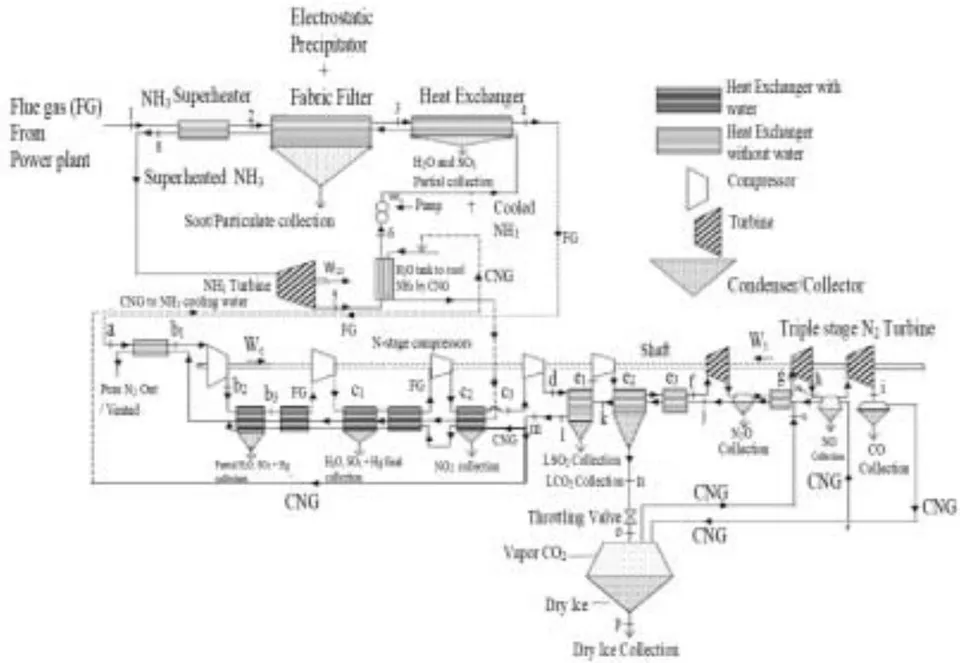
Below we describe our novel technology, NTEC, to capture CO2 and the other components of the FG (Fig. 1). This method is very cost effective, does not require the use of any chemicals, and only needs a fixed amount of water which can be used repeatedly. The basic principle of this new technology has been intensively studied by the authors [5]. We describe below the key novelties of NTEC over other emission capture technologies. A brief description of the key principles and methods involved is given in Appendix D.
a) Key Novelties of NTEC over other Cryogenic Technologies
Fig. 1 schematically describes the methods of NTEC that include the following novelties: (i) generation of auxiliary power (AUP) from the heat of the FG, in order to lessen the dependence on energy from the main output of the power plant, and thus also cooling the FG to the ambient temperature before compression; the theory of this can be seen in detail in the authors' US patent [5]; (ii) isentropic compressions by 15 compressors, each compression being at increasing steps of 1.8 to 2 bars, and cooling the compressed FG after each compression by cold nitrogen gas (CNG), until the FG reaches bars pressure at temperature in a special heat exchanger [5] (at e2 in Fig. 1), where the CO2 of the compressed FG condenses fast (Fig. 2) to liquefied cold CO2 (LCO2 in Fig.1); this reduces the net compression work more than a single compression and cooling (see Appendix E), and to a value much lower than that of previous workers [23b-d,24]; LCO2 can be converted to dry ice as needed (Fig.1); (iii) further cooling the FG (after capture of CO2) in a heat exchanger (at e3 in Fig.1), and generating CNG (at -195 C to -194 C) from the unreacted nitrogen gas by three-stage turbine expansion (at points f-g-h-i in Fig.1); (iv) cooling the FG in heat exchangers (between points a and i in Fig. 1) by the CNG for very fast heat exchange between the flowing FG and the CNG; (v)
utilizing the turbine expansion work for compression of the FG using a shaft (Fig.1); (vi) using no chemicals and only a fixed amount of water that is reusable for many years; (vii) capturing CO2 (with purity ) in the form of a cold liquid after capture of fly ashes, soot, SO3, NO2, H2O, each separately (for details, see Ref. 5); (viii) capturing N2O, NO and CO, each separately, during the three-stage turbine expansions after capture of CO2; (ix) freezing the dry ice by CNG and collecting dry ice in air-tight conditions; (x) taking measures all along to prevent choking of the compressors during compressions of the FG and the capture of components; (xi) all capture being accomplished using a single piece of equipment that can be fitted to a new power plant and retrofitted to an old power plant; (xii) capturing products that all have industrial demands; (xiii) NTEC does not require any storage for cryogens as required by previous works [34].
The processes involved in the capture are given in detail in Appendix D. The theories of energy of capture per ton of CO2 (EC) are provided in Appendix E. Further details can be seen in Ref. 5.
As discussed in section II.3, and seen in Tables A & B (columns A3 & A4), NTEC requires a net EC much lower than the lowest EC by all existing state-of-the-art cryogenic [see Appendix E] and chemical-based technologies [23c-31,33]. It may be noted from column A2 of Table A and Refs. 23c-31 that our technology
would provide a much lower cost of CO2 capture even if we eliminate AUP. With AUP, this is the only technology that would enable capture of and the ATCs from a natural gas power plant (NGPP) without requiring any energy from the main power output and yet would deliver extra energy to the grid after capture, if the FG exit temperature is 250 C or slightly higher and the dry mass CO2 concentration is more than . For a higher temperature of the FG, the temperature can be brought down by a standard air-preheating technique and a combined power and heat cogeneration technique [32].
b) Comparison of NTEC with State-of-The-Art Capture Technologies
With NTEC, depending on the FG temperature and whether coal or natural gas is used for power generation, CO2 can be captured at a low cost (-22.5 per ton of CO2 captured (Table A)) from the FG. The negative dollar value indicates extra energy generated (profit) during capture of CO2 from a NGPP using NTEC when the CO2 dry mass concentration (DMC) in the FG is more than 12.5%. Dry ice has many applications which could be further extended with NTEC. There is no recurrent expense of materials for the capture of emissions and most of the toxic components of the FG are captured at no additional cost. Unlike current state-of-the-art capture technologies [23c-31], there is no secondary emission with NTEC. Many secondary emissions are carcinogenic.
Using high pressure, 100-200 bars, Baxter et al. [23c] found the minimum EC for liquefaction to be 700 MJ per ton of CO2 for an oxyfuel combusted power plant (98% CO2 concentration by weight). The corresponding energy with NTEC would be 191 MJ if we do not use AUP and turbine work (TW). With AUP and TW, these would produce surplus energy with our method. Now, in a simulated model of carbon capture from an oxyfuel combusted FG, Toleuova et al. [24] found that the minimum energy needed was 0.18 MWh, which is equivalent to 648 MJ per ton of CO2.
According to Keith et al. [26], using the latest technology of capturing CO2 directly from the air (using alkali to absorb it and then heating the alkali to regenerate it), the energy cost is approximately 8800 MJ of natural gas, or 5250 MJ of natural gas and 366 kWh of electricity per ton of CO2 captured. The levelized cost now ranges between 232 per ton of CO2 for direct air-capture. Faishi et al. [27] gives an excellent review of all the studies of the cost of direct CO2 capture from the air and the lowest cost (5526 MJ/tCO2) exceeds by far our high cost of carbon capture, 1276 MJ/tCO2 from a coal power plant, and 341 MJ/tCO2 from a natural gas power plant (Table A, columns A3 & A4). Direct CO2 capture from the air has been increasingly discussed as a climate change
mitigation option. However, even with the latest developments, the cost is still quite high.
Zanganeh et al.'s experimental studies [28] showed that the cryogenic technique is most cost effective when the feed gas is available at high pressure and high concentration as in the FG of oxyfuel combustion. For gas mixtures with high initial pressure and high CO2 concentration (90% in a CO2/H2 mixture), Xu et al. [29] studied a technique comprising a two-stage compression, two stage refrigeration, and two-stage separation with recovery of cryogenic energy, and found that CO2 can be captured at 395 MJ/tCO2. NTEC offers much lower EC (maximum 188.5 MJ/ton) for oxyfuel combustion without TW and without AUP (100% CO2 concentration, Table A). With TW and AUP the EC is negative, meaning generation of excess energy.
Song et al.'s studies [30] revealed that under the optimal temperature and flow rate, CO2 recovery of the cryogenic process can reach 96% with 1500 MJ/tCO2 energy consumption. Tuinier et al. [31] found that more than 99% of CO2 could be recovered from a FG containing 10% (v/v) (15% DMC) CO2 and 1% (v/v) H2O with 1800 MJ/tCO2 energy consumption, using a novel cryogenic CO2 capture process that uses dynamically operated packed beds. Comparing results (700 MJ in column A3) & (-237 MJ/tCO2 in column A4) (Tables A & B), one can see that our technique surpasses all the above mentioned technologies. Thus, our patented technology with no secondary emission is superior to previous technologies also in terms of the cost of capture of CO2. Unlike ours, they have not focused on the dependence of the capture energy on the CO2 concentration in the gas mixture. Unlike current SOAs NTEC has potential to produce power with net zero emission.
c) Amount of Dry Ice that can be Captured by NTEC
Considering the case of the total energy generation, J, in the UK in 2010 and the analysis by Dr. Clifford Jones of the total emitted [5a], and considering the fact that NTEC is capable of capturing at a near rate, the total dry ice that can be captured is 587 million tons if the power is generated by coal, and 198 million tons if the power is generated by natural gas [5]. Even utilization of only a capture rate would contribute significantly towards the mitigation of climate change. The vast amount of dry ice thus captured would enable the use of dry ice refrigeration and air conditioning that would contribute further towards climate mitigation (see section III).
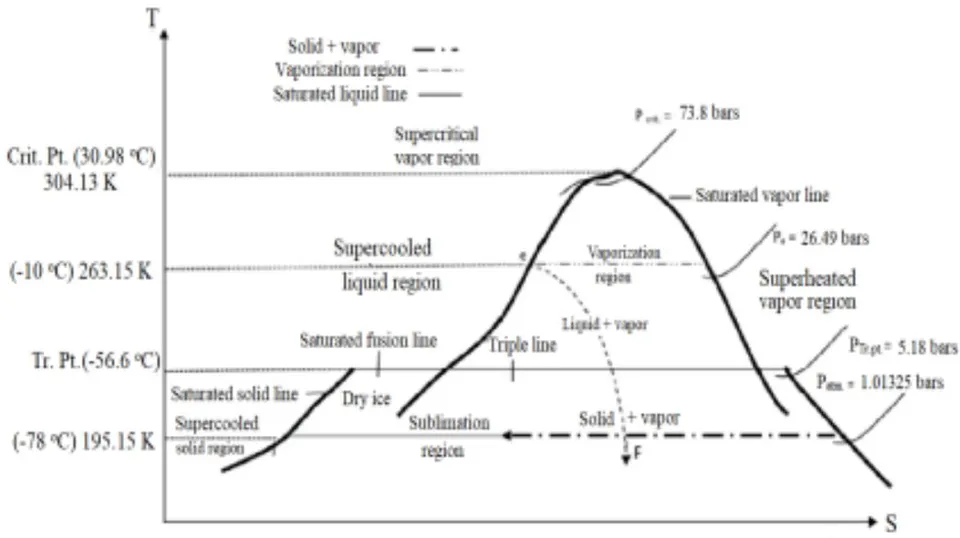
Table A: Modeled values of power plant energy (EC) needed (and the cost) to capture 1 ton of CO2 in liquid form (ELCO2), and most of the ATCs (separately), with different CO2 concentrations under various capture conditions of NTEC, using 15 compressors. (Proprietary of Sustainable Green Power Technologies (SGPT) and US Patent 10670334 B2 dated June 2, 2020)
| DMC of CO2 (%) | DMC of N2 (%) | A1 | A2 | A3 Coal | A4 Natural Gas | ||
| Energy (MJ) | Energy (MJ) | Cost* ($) | Energy (MJ) | Cost* ($) | |||
| 10 | 90 | 2861 | 1744 | 1268 | 23 | 333 | 6 |
| 15 | 85 | 1876 | 1174 | 700 | 12 | -237 | -4 |
| 20 | 80 | 1378 | 879 | 403 | 7 | -532 | -9 |
| 22 | 78 | 1244 | 805 | 329 | 6 | -606 | -11 |
| 25 | 75 | 1082 | 710 | 244 | 4 | -701 | -$13 |
| 30 | 70 | 883 | 594 | 118 | $2 | -817 | -$14 |
| 100!! | 0 | 188.5 | --- | -- | -- | -- | -- |
We assume efficiency of power generation, and that the exit exhaust FG with temperature between 250 C and 300 C can raise the ammonia temperature in the auxiliary power generator to 200 C. If the temperature of the exit FG from the power plant is higher than 300 C, it can be brought down using combined heat and power [32] and an air preheater (APH). See Appendix E for methods of calculations of EC.
DMC (Dry mass concentration) - the percentage of mass in the mixture after H2O, SO3, NO2, SO2, soot, VOCs, etc. are removed from the FG. Vol(%)
The corresponding volume concentration is slightly more than half.
- A1- Energy from a power plant needed to liquefy 1 ton of CO2 (ELCO2) without turbine work (TW), without auxiliary power (AUP), but with cooling by an external liquid nitrogen source (ELNS)
- A2- ELCO2 with TW, with cold N2 gas cooling (CNG), but without AUP and without ELNS
- A3- ELCO2 with TW, with AUP, with CNG, but without ELNS
A4- ELCO2 with TW, with AUP, with CNG, but without ELNS With oxyfuel combustion, the DMC is . For this DMC tentative values are given in columns A2,A3 &A4. Investigation on correct values for these columns are continuing.
*The cost is evaluated using the cost of electricity at generation point, $0.0644/kWh [Table 3 of Ref. 33]. For other concentrations, and for much lower FG temperatures, we are collecting data to compute the energy values. The values with finite AUP are expected to be significantly less than those with no AUP.
Table A (Recalculated): Modeled values of power plant energy needed (and the cost) to capture 1 ton of CO2 in liquid form (ELCO2), and most of the ATCs (separately), with different CO2 concentrations under various capture conditions of NTEC, using 15 compressors. (Proprietary of Sustainable Green Power Technologies (SGPT) and US Patent 10670334 B2 dated June 2, 2020).
| DMC of CO2 (%) | DMC of N2 (%) | A1 | A2 | A3 Coal | A4 Natural Gas | ||
| Energy (MJ) | Energy (MJ) | Cost* ($) | Energy (MJ) | Cost* ($) | |||
| 10 | 90 | 2868 | 1752 | 1276 | 23 | 341 | 6 |
| 15 | 85 | 1876 | 1173 | 697 | 12 | -238 | -4 |
| 20 | 80 | 1379 | 883 | 407 | 7 | -528 | -9 |
| 22 | 78 | 1244 | 804 | 328 | 6 | -606 | -10 |
| 25 | 75 | 1082 | 710 | 234 | 4 | -701 | -12 |
| 30 | 70 | 883 | 594 | 118 | 2 | -817 | -14 |
| 100!! | 0 | 189 | 189 | -287 | -5 | -1292 | -23 |
Table B: Modeled energy (EC) from a power plant needed to capture CO2 at different concentrations in the FG exiting a power plant and under various capture conditions. The lowest energy is in columns A3 & A4. All are the same as in Table A except 10 compressors are used
| DMC of CO2 | DMC of N2 | A1 | A2 | A3 Coal | A4 Natural Gas |
| Energy (MJ) | Energy (MJ) | Energy (MJ) | Energy (MJ) | ||
| 0.10 | 0.90 | 2912 | 1796 | 1320 | 385 |
| 0.15 | 0.85 | 1903 | 1200 | 724 | -211 |
| 0.20 | 0.80 | 1400 | 899 | 423 | -512 |
| 0.25 | 0.75 | 1098 | 726 | 250 | -685 |
| 0.30 | 0.70 | 896 | 607 | 131 | -804 |
III. DESIGN OF THE NEW DRY ICE REFRIGERATION AND AIR CONDITIONING SYSTEM WITH
The new dry ice refrigeration and air conditioning system is very simple compared to the existing chlorofluorocarbon-based systems. It primarily consists of a very well-insulated structure BRW (outside the main house) of inside dimensions
2.3 m, at the center of which there is a metal box (MB) made of aluminum plates of size (see Fig. 3a). The box MB is surrounded on all sides by slabs of dry ice (DRI in Fig. 3a) of total thickness . The DRI are surrounded by very good insulation (INS in Fig. 3a) made of Styrofoam (or polyurethane) and aluminum foil (for reflection). The insulation thickness is . The mass of the dry ice would be adequate to last for three months, assuming that the thermal insulation is good enough. There is also an additional
layer of insulation of thickness outside and all around BRW. The metal box is connected to the house with two tubes one at the top and the other near the bottom. The bottom one conveys cold air to the house and vents it at the top of the house. The top one (HA in Fig. 3a) conveys warm air from the top of the house to the top of the metal box. The fans needed for this circulation of cold and hot air could be run by a small solar panel or a battery or even electric power and are connected to the automatic control system (CS) which sets the temperature of the house. The tubes also
contain CO2 sensors to prevent leakage of CO2 into the main house. For efficient cooling, the structure of the metal box MB is as shown in Fig. 3b. The horizontal metal fins connect the opposite walls of the box with alternate gaps as shown. The walls of the box MB are kept in constant contact with the dry ice slabs through a spring system (not shown in Fig. 3a) attached to BRW. The sublimated CO2 is vented outside the house by a tube (not shown in Fig. 3a). The tube collects the CO2 from the top side of BRW and vents it to the outside near the ground in a garden.
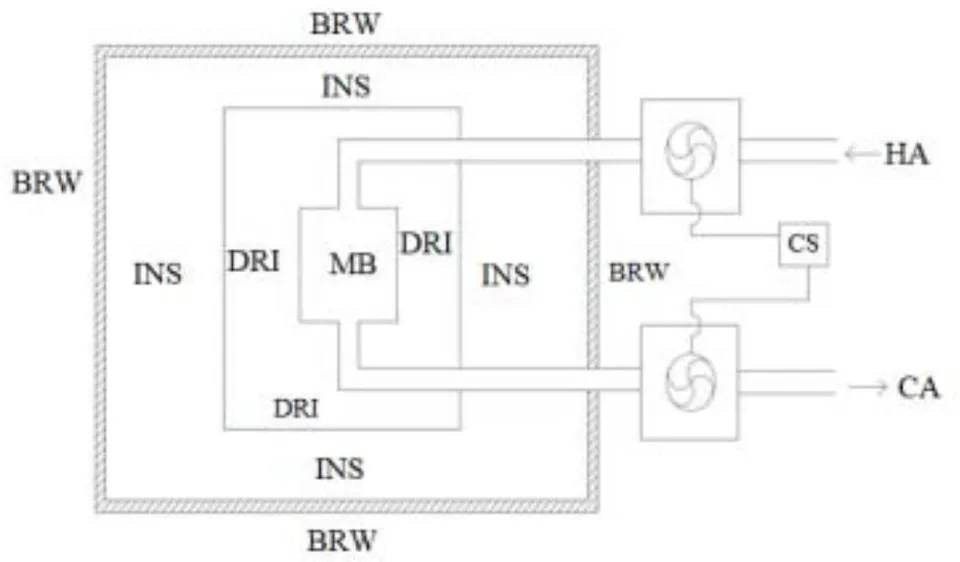
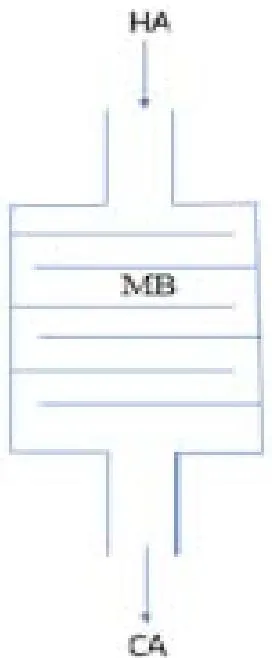
(HA) from the house and generates the cold air (CA) that circulates
a) Cost of Running the Dry Ice Air Conditioning and Comparison with Conventional Ac
We consider a house of 256 sq. m. with internal height 4 m and with the walls and the roof covered with insulation 0.75 m and 1.5 m thick respectively. We assume that the insulation has effective thermal conductivity (0.025 W/mK) of that of rigid expanded board made of polyurethane [6]. We consider the outside temperature to remain at 102 F for 12 hrs of the day and the internal temperature of the house to be kept at 70 F. We assume that every day 25% of fresh air at 102 F enters from outside. Calculation (Appendix A) shows that the monthly consumption of dry ice will be 800 kg, if the BRW of Fig. 3a is well insulated. The consumer cost of this dry ice will be 216 per month at 152 per month during the summer time, it would yield a carbon saving of at least 892 kg if the
entire power is generated from coal (0.94 kg CO2/kWh) and 190 kg if the entire power is generated using natural gas (0.55 kg CO2/kWh). Without NTEC, such cost and emission savings would not be possible using dry ice available at $1000 per ton [4] with current technologies.
Calculations based on a case study (Appendix A and Appendix B) show that if the inside air is at 102 F, it can be cooled to 87 F in 3 hrs, with a cool air flow rate of 0.42 kg/s (Appendix B) from MB (Fig. 3a). In about 6 hrs the house will reach 70 F (controlled by thermostat sensor in the middle of the house). Once at 70 F, the needed cool air flow rate will be 0.075 kg/s into the house to compensate for the heat flow from outside at 102 F. The internal wall temperature can be at 75 F.
Thus, substantial savings of money and carbon can be achieved using the dry ice air conditioning if the CO2 is captured using our technology. Both the new technology for emission capture, NTEC, and the dry ice air conditioning technology can self-sustain without any carbon tax or incentives from the government. Such sustainable technology can go a long way in ensuring clean energy and a green environment at the lowest cost. Moreover, abundantly available dry ice at such low cost can expand industrial uses of dry ice and the pure CO2 that can be obtained from it.
b) Storage of Vast Amounts of Dry Ice that Can Be Produced In The Future From Industrial Flue Gas Using NTEC As discussed, the current technology of sequestrating gaseous CO2 in empty geological formations is quite expensive [1-45a-h in Appendix C]. Below we describe a simple storage technique for the
storage of CO2 in the form of dry ice that could be captured in vast amounts using NTEC in the future.
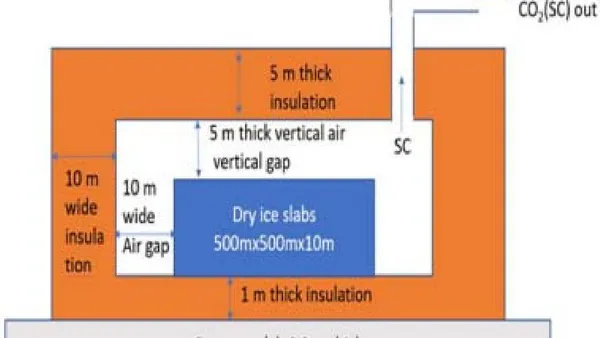
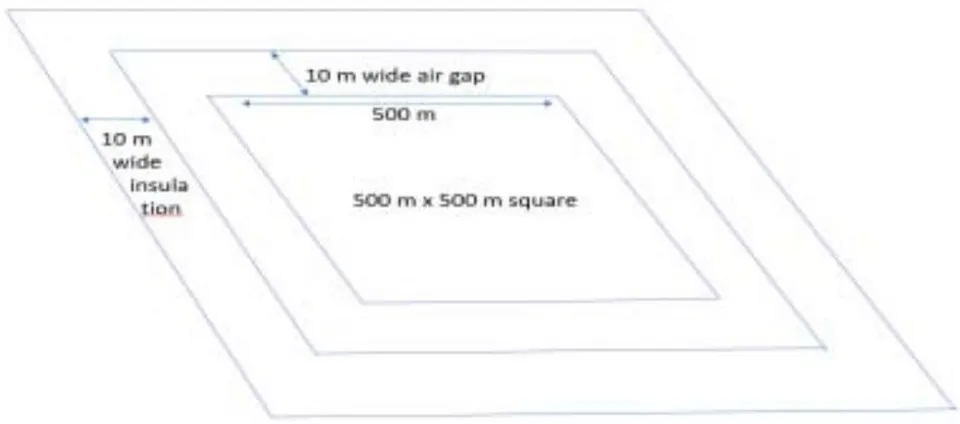
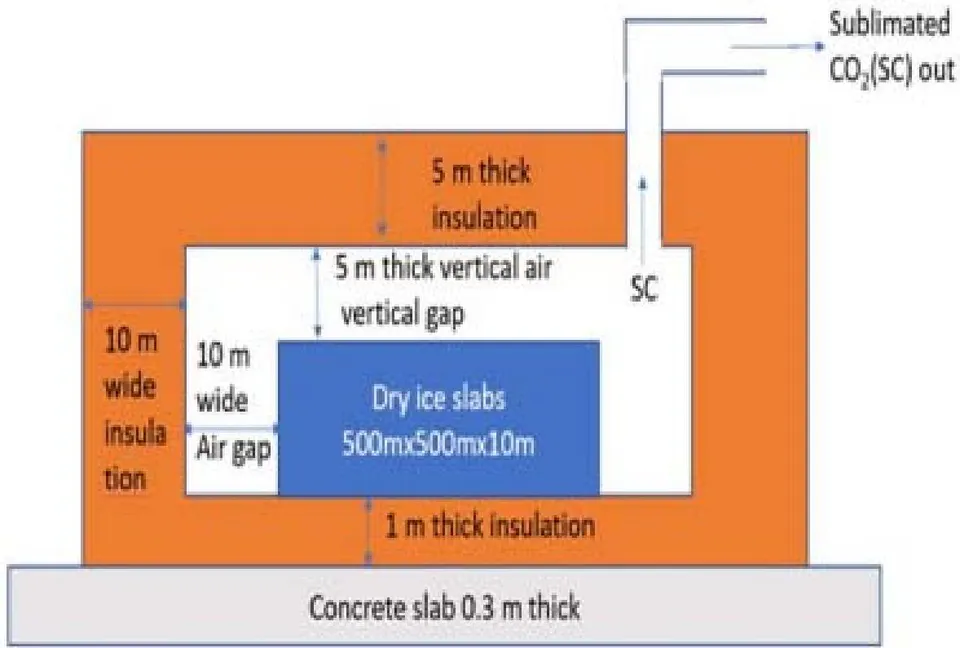
Dry ice can be stored if it is highly insulated. We propose that a structure (Figs. 4a & 4b) x in which compressed dry ice slabs (5 kg to weight) will be stacked to a total volume of m x (height). This is surrounded by a gap of on each side of the square and on the top, with a thick insulation of width, height on all sides. Figs. 4a & 4b show a schematic view of the horizontal and vertical sections of the storage structure. On the top of the structure there is a air gap on top of which there is the thick insulation (Fig.4b). The insulation is made of to (thickness) x x slabs of Styrofoam (heat conductivity, W/mK) or rigid expanded board of polyurethane ( W/mK) [6,25], sandwiched in between shining smooth aluminum foil. The thick insulation is made by pressing together such insulating units. One can use more insulating layers of polystyrene (heat conductivity W/mK), if needed. A simple calculation of heat transmission shows that the maximum annual sublimation (in closed confine) would be 253 tons ( ) if the outside temperature is for 12 hrs a day. (Now the structure of m can contain dry ice of mass tons). With occasional opening of doors, the losses should not exceed 1500 tons annually, if the insulation is kept as mentioned. Thus, more than of dry ice can effectively be stored annually.
Using sunlight, the amount of CO2 released from dry ice can be controlled by adjusting the insulation (5 m thick) of the roof (Fig. 4b).
c) Recapture of Sublimated Co2 From Dry Ice Refrigeration And Air Conditioning Systems And The Storage Structure
- The sublimated CO2 from dry ice refrigeration and air conditioning systems and the storage structure can be quite pure if the initial small fraction of CO2 which would be mixed with air is flushed out. The sublimated pure CO2 can then be captured if needed for enhanced biodiesel production through accelerated growth of algae or jatropha [7-20] or for alcohol production [23a]. It can also be used for soft drink productions, if needed.
d) Risks Involved in Dry Ice Refrigeration and Air Conditioning Systems
The major risk involved in dry ice refrigeration and air conditioning systems would be the leakage of CO2 inside MB from the dry ice in BRW (Figs. 3a & 3b). This can be prevented by having sensors inside MB and in the tubes that convey cool air from MB to the main house. If leakage is detected then repairs can be made. The other risk is the leakage of CO2 out of the dry ice AC unit and a high concentration of CO2 in its vicinity. We assume that it will be dispersed into air with time.
b) Environmental Impact of the Future Dry Ice Air Conditioning
The total number of housing units in the USA in 2018 was 138 million. Assuming of these have
ACs, based on results given in section III.2, the carbon savings in a hot summer month would be million tons if power is generated by coal, and 23 million tons if power is generated by natural gas. Moreover, there will be savings of ATCs. Thus, dry ice AC would, in the future, substantially contribute towards a clean environment and the mitigation of climate change.
IV. CONCLUSIONS
Rigorous theoretical research with a case study (power generation in the UK in 2010) shows in patented technology that it is possible to capture CO2 at a cost - 23 per ton in the form of liquefied CO2 or dry ice, using the new technology, NTEC (Tables A & Table B). Considering all the benefits that the technology will yield, including the revenues that the captured products will bring, the net captured cost becomes either zero or negative. The negative dollar value (Table A) means that the carbon capture can turn out to be profitable without the sale of any captured products.
The new proposed dry ice AC system that can use the abundantly available dry ice with NTEC shows great advantage over conventional AC system. A case study of a 256 sq. m. house reveals that the system can save consumers $147 per month and carbon saving of at least 874 kg and 114 kg in a hot summer month, if the AC is run by electricity generated by coal and natural gas respectively.
Thus, such dry ice (solidified CO2) can be used in air conditioning with substantial cost and carbon savings if the industrial carbon emission is captured using the new technology, NTEC. This would help further achieve the objective of climate mitigation and reduce global warming.
ACKNOWLEDGEMENT
The authors are grateful to Patricia Rubins for going through the manuscript meticulously and suggesting corrections and improvements.
- Air conditioning accounts for about of U.S. home energy expenditures, Today In Energy, U.S. Energy Information And Administration, https:// www.eia.gov/todayinenergy/detail.php?id=36692
- PickHvac Cooling and Heating Guide.... https://www.pickhvac.com/faq/ac-size/
- How Much Does it Cost to Run an Air Conditioner? [ https://asm-air.com/airconditioning/much cost-run-air-conditioner/].
- Dry Ice Delivered - https://www.dryicedelivered.com/Product-8/Dry_Ice_Pellets
- Dilip K. De and Idowu Oduniyi - US patent application 15915007, with provisional patent application No. No.62593828 dated Dec. 2017. US patent Publication No. US-2019-0170436-A1 dated June 6, 2019. References there in. US Patent No. 10670334 B2, June 2, 2020.
- Global Trends and Pattern in Carbon Mitigation, Edition (2013), Dr. Clifford Jones, Booboon Publisher, P.16-19. Global Trends and Pattern in Carbon Mitigation, Edition (2013), Dr. Clifford Jones, Booboon Publisher, P.16-19.
- Akash Kumar Modi et al., A Review on Air Preheater Elements Design and Testing, Mechanics, Materials Science & Engineering, https://www.researchgate.net/publication/330101499_A_Review_on_Air_Preheater_Elements_Design_and_Testing
- Thermal insulation materials, technical characteristics and selection criteria- http://www.fao.org/3/y5013e/y5013e08.htm
- Daniel R. Taub Effects of Rising Atmospheric Concentrations of Carbon Dioxide on Plants © 2010 Nature Education (2010) Nature Education Knowledge 3(10): 21. https://www.nature.com/scitable/knowledge/library/effects-of-rising-atmospheric concentrations-of-carbon-13254108.
- Ainsworth, E. A. Rice production in a changing climate: a meta-analysis of responses to elevated carbon dioxide and elevated ozone concentration. Global Change Biology 14, 1642-1650 (2008).
- Sherry Seethaler, UCSD Study Reveals How Plants Respond to Elevated Carbon Dioxide,
APPENDIX A
Estimation Of The Cost Of Running A Dry Ice Air Conditioner Using NTEC For Capturing Industrial Emissions In A Case Study
To estimate the mass of dry ice needed for the air conditioning of a house we proceed as follows:
- A house of inside area 256 sq. m. and internal height 4 m is considered. The volume is . The density of air is . Thus, the mass of the air in the house is . The specific heat of air is .
- We assume that the outside temperature is . So, the total amount of heat to be taken out of the room on the first day is . MJ. We now assume that the house is well insulated and the furniture and equipment necessitates additional cooling of of this heat reduction. Thus, total heat reduction on the first day is MJ.
- We assume that the outside temperature remains at at night. Every night of the air inside is replaced by fresh outside air. The amount of heat brought into the house from outside is in a hot summer month.
- We suppose that the house of area 256 sq. m. (total floor area) has four sides each of length 16 m and height 4 m (~13 ft) and has effective wall thickness of 75 cm with effective thermal conductivity of that of rigid expanded board of polyurethane (0.025 W/mK at polyurethane density 30 kg/m³) [25]. We suppose that the ceiling (area 256 sq. m.) has an effective thickness of 1.5 m insulation. We assume that the outside temperature stays effectively at for 12 hrs in the daytime and at for 12 hrs at night and a central inner space of dimensions 12mx12mx3m stays at for 24
hours a day. In such a situation the total heat flow into the house is in a hot summer month. This calculation is done by calculating the temperature at the inner wall and roof during equilibrium heat flow in the daytime and at night and then using a simple heat flow equation and calculating the total heat flow for the month through the walls and the roof during the day and during the night.
The additional heat penetrating the dry ice box (Fig. 3a) is MJ. This is calculated considering the total surface area of the dry ice slabs ( m² in the example considered). This will cause additional loss (over that due to (iii) & (iv) above) of dry ice by sublimation.
Thus, after the first day of cooling, the total heat flowing into the house (maintained at hrs a day for 30 days) is for a hot summer month.
This heat would be removed by sublimation of dry ice which has latent heat of evaporation at . Now its temperature will be raised from to ( ). Thus, the temperature change is . The specific heat of CO2 is . Thus, the total heat that can be removed by sublimation of dry ice is .
Thus, the total dry ice that would be needed for cooling the house for the month is MJ/0.667 MJ/kg = 697 kg = ~700 kg.
Considering that with NTEC dry ice can be available to residential customers at 56 for the month. Thus, dry ice AC, which is not affordable with current technology, can be easily affordable with NTEC.
An analysis of the net energy usage in a similar situation (running 12 hrs a day effectively) using conventional AC shows that a 5-ton AC is needed. With a 5 star AC (EER = 3.5) the power consumption for the month is 5kWx12h/dayx30days = 1800 kWh. With 12 cents per kWh in Texas this will cost the consumer $216 for the hot summer month [X] [XX] [XXX].
Thus, we see that the dry ice AC can save 56 = $160 in a hot summer month for a house of 256 sq. m.
As said before, conventional AC would require the generation of 1800 kWh of energy. CO2 emissions are 0.94 kg and 0.55 kg per kWh from coal power plants and natural gas power plants respectively. Thus, the carbon saving by the proposed dry ice AC, in generating the power for the conventional AC (5-ton) in a hot summer month, would be kg if coal is used, and kg if natural gas is used.
This saving in carbon emission assumes that the sublimated CO2 is not captured back.
- If the effective wall and roof insulations are 50 cm and 1 m thick respectively with the same materials as mentioned earlier, then the total heat flow through the walls and the roof into the house in the month is ΔQ4 = 1.5x381 MJ = 572 MJ. The additional dry ice to be sublimated is 286 kg, to keep the house at 70°F for the month. The additional cost is 160 - 137. The total carbon emission savings would be 992 - 286 = 706 kg, if the power is generated by coal. Thus, the dry ice AC would save considerable consumer cost and carbon emission.
- If the effective wall and roof insulations are 50 cm and 1 m thick respectively with the same materials as mentioned earlier, then the total heat flow through the walls and the roof into the house in the month is ΔQ4 = 1.5x381 MJ = 572 MJ. The additional dry ice to be sublimated is 286 kg, to keep the house at 70°F for the month. The additional cost is 160 - 137. The total carbon emission savings would be 992 - 286 = 706 kg, if the power is generated by coal. Thus, the dry ice AC would save considerable consumer cost and carbon emission.
- https://www.quora.com/How-much-electricity-units-is-used-by-1-ton-split-AC
- https://letsaveelectricity.com/power-consumption-of-ac-how-much-power-does-an-ac-use/
- https://asm-air.com/airconditioning/what-size-central-air conditioner-for-my-house/
APPENDIX B
a) Determination of The Size of the Box Mb (Fig. 3b)
We assume the box MB (Fig.3) to be a cube of side a (meters) and the area A of the metal plate is . Let us assume that on the first day we want to cool the entire house by in 3 hours when the air inside (mass ) is at . The specific heat of air is . The rate of heat reduction (section (ii) of Appendix A) is on the first day. Then the maximum heat flow from the walls and roof is 256 (102-86)(5/9)(0.025){1/0.75} + (1/1.5) = 0.11 kJ/s, assuming that the air inside is at during the 3 hours and the air outside is at . This figure (0.11 kJ/s) is somewhat higher than what one would get with rigorous calculations. Nevertheless it will better help the design of the box MB. So, the required heat flow rate out of the house is so that the house cools to from in 3 hours on the first day. This should be the cooling rate of the air inside the box MB. The accuracy of this model of the cooling rate depends on three factors:
We assume the box MB (Fig.3) to be a cube of side a (meters) and the area of the metal plate is . To find the maximum rate of cooling needed, let us assume that on the first day we want to cool the entire house by in 3 hours when the air inside (mass ) is at .
- The conduction from hot air to dry ice through the metal in the box MB (Fig. 3) as hot air from the house is continuously pumped in. Calculation gives the heat conduction rate of .
- We assume that as the hot air from the house is brought into the box, the center of the box is at , while the metal plate surface is at , since it is in contact with dry ice. The maximum radiation from the metal surface to the middle of the box is ( Stefan Boltzmann constant ; the factor 6 comes from the 6 faces of the box). We assume that the volume pump rate of air in the box is . Then balancing the heat flow equation we get: .
Solving this we get . We take the metal plate size as as mentioned earlier. Thus, if the air in the box MB (mass ) is replaced every second (i.e. flow rate ) then the entire house will cool in 3 hrs from to . Here we assume that the dry ice slabs are always kept in contact with the metal walls of the metal box with the use of a spring as mentioned earlier. The flow rate can be adjusted if needed to maintain the time of cooling at approximately 3 hours if needed.
- Heat transfer coefficient as a function of air flow velocity within the box: While this factor is under modeling, we estimate that the effective time of cooling the house by would be somewhat less than 3 hrs on the first day. This is a pretty good rate of cooling. When the air mass attains , approximately after 6 hours, then to maintain this temperature while the outside is at , the cool air flow rate would be . The temperature controller can be made to adjust the fan rates automatically.
APPENDIX C: REFERENCES FOR INTRODUCTION I.1.1 TO 1.1.2.
- L. Moretti AND C.S. Jones, Advanced Emissions Control Technologies for Coal-Fired Power Plants
Technical Paper, BR-1886-Babcock & Wilcox, Power Generation Group, Inc., Barberton, Ohio, U.S.A., Presented to: Power-Gen Asia, Date: October 3-5, 2012, Location: Bangkok, Thailand.
- IUPAC. Compendium of chemical terminology, 2nd ed. (the "gold book") (1997). Online corrected version: (2006-) electrostatic precipitators.
- Air pollution control technology fact sheet, EPA-452/F-03-031 https://www3.epa.gov/ttncatc1/dir1/fsncr.pdf
- NOL-TEC system. Bag-house/Fabric Filters http:// www.nol-tech.com/fabric-filters.html
- 17a Tri-Mer Corporation. Venturi technology, High-Energy Venturi Gas Scrubbers, Technology Leader Multi-Pollutant Control: http://www.tri-mer.com/venturi-scrubbers.html.
- Pollution systems. Industrial air solutions. http://www.polliationsystems.com/particulate-scrubbers-venturi-scrubbers.html
- Air pollution control technology fact sheet. EPA-452-03-031 https://www3.epa.gov/ttncatc1/dir1/fsncr.pdf
- Paul S. Nolan, Babcock & Wilcox Company Barberton, Ohio, USA. Flue gas desulfurization technologies for coal-fired power plants. Presented by Michael X. Jiang, Coal-Tech 2000 International Conference. November 13-14, 2000 Jakarta, Indonesia
- Spray dryer absorber. Babcock and Wilcox http://www.babcock.com/products/Pages/Spray-Dry-Absorber-(Dry-Scrubber).aspx
- Circulating dry scrubber (CDS) technology. Babcock and Wilcox. http://www.babcock.com/products/circulating-dry-scrubber-cds
- 45a. "Introduction to Carbon Capture and Storage - Carbon storage and ocean acidification activity". Commonwealth Scientific and Industrial Research Organisation (CSIRO) and the Global CCS Institute. Archived from the original on 2012-12-08. Retrieved 2013-07-03.
- 45b. Bui M, Adjiman CS, Bardow A, Anthony EJ, Boston A, Brown S, Fennell PS, Fuss S, Galindo A, Hackett LA, Hallett JP. Carbon capture and storage (CCS): the way forward. Energy & Environmental Science. 2018;11(5):1062-176.
- 45c. Postnote-Parliamentary Office of Science & Technology, June 2009, No.335- Carbon capture, and transport and storage.mm.
- 45d. BECCS deployment: a reality check
MATHILDE FAJARDY, DR. ALEXANDRE KÖBERLE,
DR. NIALL MAC DOWELL, DR. ANDREA FANTUZZI,
Grantham Institute Briefing paper No 28 January
2019, Imperial College London. - 45e. Amir Erfani, Daeed Hassan Boroojerdi and A. Dehghani, Simulation of an operational amine based CO2 removal plant as an example of CO2 capture at coal-fired power plants, December 2014, Petroleum and Coal 57(1):85-92.
- 45f. Air pollution impacts from carbon capture and storage (CCS), EEA Technical report No 14/2011
K. DE AND IDOWU ODUNIYI- PATENT NO
Brief Description of Key Principles And Methods to Produce A Vast Amount Of Dry Ice from Industrial Flue Gas At A Very Low Or No Cost.
The key principles of the highly cost-effective industrial emission capture technology to capture carbon are described below in reference to Fig.1:
a. The FG (Fig.1) is brought down to a near ambient temperature by utilizing its heat content for auxiliary power generation by an ammonia (NH3) superheater and a NH3 turbine (Fig.1). The NH3 superheater is kept in the second chamber of the ceramic filter chambers to absorb maximum heat of the FG [5]. The NH3 after expansion is condensed in a water tank (at point 6 in Fig.1) cooled by cold nitrogen gas (CNG) (Fig.1). It is then circulated back by a pump to absorb heat of the FG and to repeat the cycle. After fly ashes are separated by ceramic filters (not shown in Fig.1), an electrostatic precipitator (ESP) and a fabric filter (FF), we employ N number of compressors (Fig.1) to compress the FG to a final pressure bars, by N isentropic compressions at equal increments of pressure. reduces the compression work considerably (see Appendix E). However, can also suffice and would be easier to implement, compression work would be more than that for . b. The FG is cooled in a heat exchanger (H.E.) after each isentropic compression to a temperature below the boiling point of the component to be captured in the specified H.E (Fig.1). The cooling is done by CNG generated in the process. Two types
of H.E.s are used. Type I is used to cool the FG to capture components with a boiling point above , and Type II is used to cool the FG to capture components with a boiling point below . The H.E.s are specially built to ensure good thermal conduction between the FG and the cold surroundings created by the CNG. The inside of the H.E.s are coated with acid-resistant films that are tolerant to a wide range of temperature variations (- to ) in terms of structural changes. These are discussed in US Patent Application No. 15915007.
c. See Ref. 5 for more details on the H.E.s. d. After water vapor (H2O), sulfur trioxide (SO3), nitrogen dioxide (NO2), and sulfur dioxide (SO2) are captured (each separately (Fig.1)), the FG is finally compressed to 26.5 to 27 bars by the Nth compressor and passed through a H.E. at e2 in Fig.1 kept at to so that it attains at least rapidly when it passes through the H.E. This condenses CO2 to liquid CO2 fast (Fig. 2). e. After step d, the compressed FG undergoes three-stage turbine expansions (TE) (f-g-h-i in Fig.1) whereby N2O, NO and CO are condensed separately, and finally CNG is produced which is recirculated to capture each component separately (Fig.1). For details of the capture processes of these components, see Ref. 5 by the authors. Liquid CO2 is converted to dry ice by isentropic throttling (Fig.2) into a flash chamber cooled by CNG to a temperature - . This also condenses the CO2 vapor to dry ice and solidifies more the dry ice already produced by throttling. There is a provision to collect the dry ice without any exposure of the flash chamber to the atmosphere [5]. The dry ice then can be collected and compressed into slabs for storage.
f. The TE work aids compression (see Appendix E) and reduces the net energy requirement for capture. g. The calculations on the temperature of CNG produced by TE, the compression work by N compressors, the TE work received by compressors, the cooling requirements by CNG are all given in Appendix E. The thermodynamics of the auxiliary power generation are however skipped to save space. The interested reader is referred to section I.2 of Ref. 5.
APPENDIX E: SCIENTIFIC ANALYSIS OF THE ENERGY REQUIREMENT IN THE PROCESSES INVOLVED
Estimation of the compression work
Since CO2 and N2 are the major constituents of the FG from coal and natural gas power plants, and since in our technology nitrogen gas is finally cooled to above its boiling point, and this cold nitrogen gas is used to condense most of the component gases of small percentages, it is sufficient to assess the energy required to capture the entire CO2 in the form of liquid and dry ice and the energy required to cool the nitrogen gas. From the methods discussed above, it is obvious that the net work of production of liquid CO2 from the carbon capture, , will involve the difference , where the work input to the N-stage compressor (Wc) - the work output (WTE) of the nitrogen turbine during expansion - the auxiliary energy generated during the capture of CO2. This is the energy of capture (EC) given in Tables A & B. Below we explain how we obtain the values.
From thermodynamic analysis, the specific work done on an N-stage isentropic compressor, Wc, is given as
Where cp is the specific heat at constant pressure
Tx is the temperature at the inlet to each compressor stage
N is the number of stages
Py and Px are the final and initial pressures respectively
is the specific gas ratio.
The specific work output by a turbine, Wt, is given as
where T1 and T2 are the inlet and outlet temperatures respectively.
Here (3)
for the isentropic expansion process.
By the energy conservation law, the work done on the compression of both the and gases in the N-stage compressor is equivalent to the sum of the individual compressions, and for as much reduced compression work as possible, N (number of compressors) is taken as 15 in this study.
The properties of are cp = 0.8464 kJ/kgK and , the states are N = 15 stages, Py= 26.47 bars, Px=1.01325 bars. Then from Equation 1, the specific compression work on the gas will be
(Tx is the temperature of the mixture at state b1 in Fig.1, and it is assumed to be ambient, i.e. ).
Also the properties of are cp = 1.0404 kJ/kgK and , the states are N = 15 stages, Py = 26.47 bars, bars. Then from Equation 1, the specific compression work on the gas will be
Estimation of the cold gas temperature and the turbine work output
For the temperature (T2) of the nitrogen gas at stage i in Fig.1 (i.e. exhaust temperature) to be achieved at the boiling point of nitrogen (77.35 K) at atmospheric pressure (1.01325 bars) for the capture of CO2 (boiling point of ), the temperature at stage g in Fig.1 from equation 3 will be
The pressure at stage h in Fig.1 at the boiling point of NO (121.15K) for the capture of NO under pressure will be
Hence from Equation 2, the specific work output (Wt) by the three-stage turbine will be
Turbine Expansion Work Wt
Estimation of the auxiliary power generated
The interested reader is referred to section 1.2 on page 36 of Ref. 5.
Estimation of the net energy required for the capture of 1 ton of CO2
Using detailed thermodynamic analyses and applying the above mentioned process steps [5] to the case of the total power generated in the UK in 2010 [5a], we find the following:
- (a) Assuming that the anhydrous ammonia could be raised to (which is possible if the initial FG temperature is around to ), then the energy generated by the auxiliary power generator could be of the total energy produced by the steam or gas turbine, assuming a ranking cycle of efficiency for power generation. The calculation is based on the estimation of CO2 produced for the case study as carried out by Dr. Clifford Jones [5a] and detailed thermodynamic analysis as given in Ref. 5. If the FG temperature is such that the ammonia in the ammonia superheater can only be raised to temperature to , then the efficiency of auxiliary power (AUP) conversion from the heat of the FG is only . Here, in the calculations of energy capture, we assume the efficiency of AUP. We skip the details of these efficiency calculations and the specific processes involved to save space. The interested reader is referred to Ref. 5 for details.
- (b) Coal power plant. Assuming the entire energy under the case study is generated by coal then the total emission of CO2 is estimated to be 587 million tons. Our new technique is capable of capturing at a rate, if needed. Thus, the auxiliary energy generated is 476 MJ/tCO2.
- (c) Natural gas power plant. Assuming the entire energy under the case study is generated by natural gas, then the total emission of CO2 is estimated to be 198 million tons. Our new technique is capable of capturing at a rate, if needed. Thus, the auxiliary energy generated is 1411 MJ/tCO2.
An example of the calculation of the values of energy in Table A
In coal power plants the average constituents for of dry FGs containing CO2 and N2 is assumed to be for CO2 and for N2. While in natural gas power plants the average constituents for of dry FGs containing CO2 and N2 is estimated to be for CO2 and for N2 [Y] [YY].
Therefore, for of dry FGs in a coal power plant, the compression work input for CO2 will be and for N2, given a specific
compression work input of for the mixture of the gases (0.25 kg CO2 plus 0.75 kg) N2 by the energy conservation law. Thus, for the capture of 1 kg of CO2, the compression work is Wc = 270.47/0.25 = 1082 kJ. For 1 ton of CO2, Wc = 1082 MJ (column A1 of Table A, for DMC=25%).
By the above method, the natural gas power plant will have a specific compression work input of 281.40 kJ/kg for the mixture of the gases. Thus, Wc = 1876 kJ/kg = 1876 MJ/tCO2 (Table A, column A1 for DMC=15%)
Since the specific work output of the turbine is , the turbine work from the nitrogen in the FGs in a coal power plant is estimated to be , and that from a natural gas power plant is estimated to be .
Therefore, the net work input into the production of of liquid CO2 at state n (Fig.1) from a coal power plant is estimated to be kJ, which is equivalent to per kg of liquid CO2 at state n in Fig.1. This is shown in Column A2 of Table A for DMC=25%.
Also, the net work input into the production of of liquid CO2 from a natural gas power plant is estimated to be . is the net compression work in NTEC per kg of FG containing of CO2 and approx. of N2 gas (i.e., the dry FG containing CO2 gas), which is
equivalent to 1,173.47 kJ per kg of liquid CO2 at state n. This is shown in Column A2 for DMC=15%.
We use the values of auxiliary energy as given above to calculate the net EC (ΔWnet) values. These are given for coal and natural gas in columns A3 and A4.
For , using the above data we get Table A for the EC of CO2 with various dry mass concentrations (DMC). Similarly following the above theory we create Table B for . It appears that would be a good choice since it would be easier and less costly to build the equipment of Fig.1. It is to be remembered that in NTEC we are mainly considering FG produced in coal or natural gas power plants that use normal air instead of pure oxygen for burning the fuel.
Cooling of the flue gas by the cold nitrogen gas produced in the capture processes
Cooling the entire unreacted nitrogen gas of the FG to a temperature or above the boiling point of nitrogen using three-stage turbine expansions of the compressed FG initially at bars, and using the cold nitrogen gas thus produced to cool the incoming FG at various stages, and using only a fixed amount of water that can be repeatedly used, we find that the cold nitrogen gas cooled to is sufficient to cool the FG in various stages of capturing the component gases.
The heat gained by the cold nitrogen gas (assuming it is of the FG; and assuming H2O as steam and approximately CO2 by volume) in rising from to the ambient temperature , is
density and specific heat in gas-form.
The heat lost by the FG in the first cooling to temperature (step 7) is
Thus, H1 is significantly less than HN, a condition necessary and sufficient to carry out all the cooling described in NTEC by only the cold nitrogen gas as said earlier.
After the auxiliary power generation, the temperature of the FG may be in the range to , depending on the initial FG temperature. We assume here.
NTEC captures CO2 from power plants at a cost much lower than the lowest cost of capture by current state-of-the-art technologies (CSOAs)
For example, a typical concentration in the FG from a coal power plant is CO2 and N2 by volume. This corresponds to a CO2 DMC of . From Table A, column A3 we see that the EC is 329 MJ per ton of CO2. This is within to of electricity output per ton of CO2 emission. The energy penalty with CSOAs for oxyfuel combustion (DMC=100%) is [YYY].
The energy penalty with CSOAs can easily reach [YYY]. With NTEC, as discussed earlier in section II.3, the maximum EC for oxyfuel combustion (Table A) is 188.5 MJ/ton of CO2 captured. If the energy is tapped from the output of a supercritical pulverized coal power plant [YYY], the CO2 emitted per MWh is 0.746 ton/MWh. This amounts to the maximum energy penalty by our technology, , without AUP (Table A). With AUP, there would be an energy surplus (not calculated in Table A). For a natural gas power plant a typical FG concentration corresponds to a CO2 DMC of and the EC is , meaning that extra energy is generated during the
- capture. It should be noted that NTEC does not involve any additional cost of chemicals as used in current CSOAs. Thus, the cost is lower than the lowest cost of capture by CSOAs.
- [Y] Rogers and Mayhew 1992
- [YY] Engineering Thermodynamics: Work and Heat Transfer, Gordon F. C. Rogers, Gordon Frederick Crichton Rogers, Yon Richard Mayhew, Longman Scientific & Technical, 1992
- [YYY] Energy Volume 103, 15 May 2016, Pages 709-714
- [YYYY] Energy Environ. Sci., 2009, 2, 193-205
- [YYYY] Ref. 33 for sections I.2 to IV