I. ENERGY AND ENVIRONMENT
During the last decade the attention of the energy policy-makers, globally, was drawn to the impacts of energy use on the environment. More specially, the apparent linkage between the emissions from the fossil energy use and the green house effect made the environmental concerns a critical component of energy planning. The future energy and emission intensities from the developing countries shall be invariably decided by the development patterns. It is neither efficient nor even feasible for the developing countries to follow the past development paths of the industrialized countries.
Transport, manufacturing, the power sector, commercial and residential energy use, all contribute to problems of air quality. Motor vehicles contribute to all forms of air pollution. Residential burning of unprocessed biomass fuel is the single largest source of carbon monoxide and suspended particulate matter. Power generation contributes most of the nitrogen oxides and sulphur dioxide.
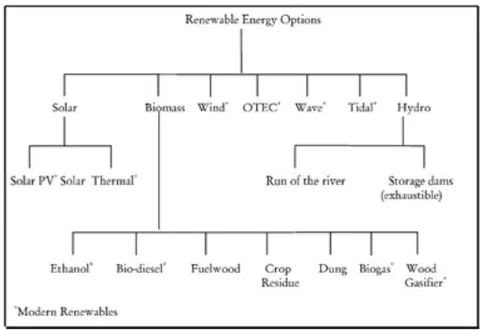
The escalating demand for power, rapid proliferation of motor vehicles, expansion of industries and rising living standards will all combine to have significant impact on the quality of air, especially in urban areas India has huge potentials for the effective use of renewable energy. Various renewable energy sources like small hydro, biomass, and solar energy have power generation potential in India.
II. ANALYTICAL FRAMEWORK
There is a need to develop a framework that will encourage and assist cities in assessing their present energy consumption status, setting clear targets for and preparing action plans for generating energy through renewable energy sources and in conserving energy utilized in conducting urban services.
| S. No. | Objective | Task | Approach |
| 1 | To prepare energy conservation plan | a. Checklist of energy saving devices. | Market survey |
| 2 | To prepare energy generation plan | a. Classify energy generation possibilities at sector level | Literature review, |
| b. P.V application details | Literature review, interview with field experts and manufacturers. | ||
| 3 | To check Technical feasibility | a. Check efficiency | Literature review, interview with field experts and manufacturers. |
| b. Maintenance | |||
| c. Life/durability | |||
| 4 | To check financial feasibility | a. Applicability of subsidies/tax benefit | Review policies |
| b. Calculate cost recovery period | Primary and secondary survey of manufacturers | ||
| c. Insurance policies. | Review policies |
III. CASE STUDY: NASHIK
Nashik is located towards the north west of Maharashtra and lies between and North latitude and and East longitude. It is located 180 Km, towards north of the state capital, Mumbai and 220 Km towards north of Pune. River
a) Study Area Delineation
Godavari divides the city into Northern Nashik and Southern Nashik. Nashik Urban Agglomeration has a population of 1,620,000 (projected year 2014) and a total area of 259.13sq Km. which makes it the fourth largest urban area in Maharashtra in terms of population.
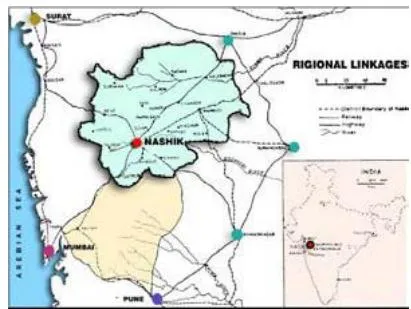
The coal requirement for NTPS is enormous. For full rated generation, Nashik requires 12 to 13 thousand M.T of coal per day. Nashik is linked for coal supplies with Western Coalfields and South Eastern Coalfields. Nashik being located far away from the collieries, the freight component is considerable and is normally 80 to of the cost of coal.
The power situation during summers becomes worst when the small hydro power plants in the district are at the mercy of rain. MSEDC in 2014 enforced power cut from 16 hours to 40 hours a week in Industrial Areas. Residential Areas faced 6-7 hours power cut daily.
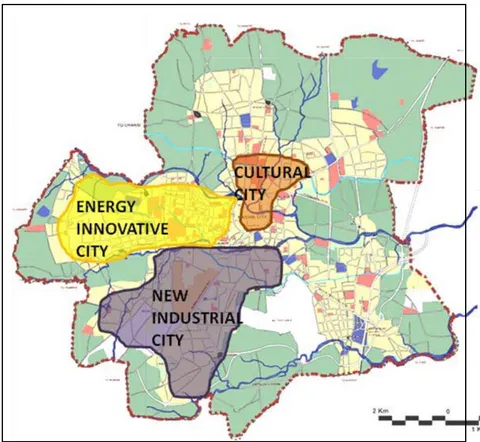
The growth pattern indicates that the western area of the city has high potential for future growth to develop as a commercial, institutional and residential hub. Considering the spatial growth pattern, land use, activities and energy demand, the city can be divided into three zones.
i. Cultural City
The old city is characterized by narrow, shaded, winding streets, peculiar projections onto the street, streets swelling into a public courtyard and the vibrant and active bazaar streets leading towards the river. The housing typology is wada which means a courtyard house with sloping roof. The old city near the Godavari river is established as a rich heritage and pilgrimage centre.
Looking at physical, economical and social characteristics of old city, solar thermal or solar photovoltaic initiatives has very less potential. Area has potential of Energy conservation at existing house hold levels. Alterations or replacing electrical devices with energy efficient devices can reduce the overall energy demand within old city area.
ii. Energy Innovative City
Western Nashik - New development in commercial, residential, and institutional sectors is happening in western Nashik.
Development happening can be seen in a planned approach with uniformity in the land use pattern. There is a majority of higher and higher middle income groups residing in western region.
Thus the western region can be perceived as an energy innovative city, where solar energy resource can find potential in application to reduce the energy demand. New buildings can reduce their energy demands by adopting Green building techniques. Individuals can be active part of the energy management of city, by switching to energy saving devices and solar water heating system installation. Commercial and institutional establishments can generate their own electricity with BIPV systems.
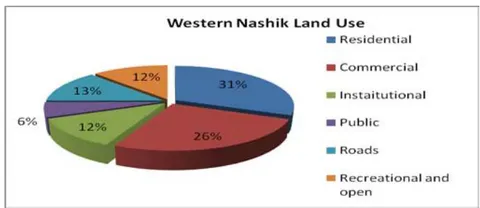
The total area of energy innovative city is 52 . Major contribution is by residential and commercial sector covering and respectively. Institutions cover . Public, Roads, and Recreational has 3.12, 6.76 and area respectively.
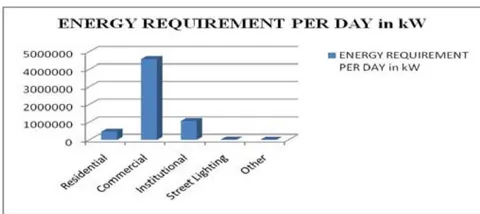
The energy requirement in a day by commercial sector is the highest for western Nashik, followed by institutional which is 4569879.6 and 1065240 kW respectively. Residential sector has an average requirement of 443139.84 kW in a day. Street lighting requires 14919 kW and others like signal lighting, lighting on hoardings and park require 7959.5 kW.
iii. New Industrial City
The industrial activity within Nashik Municipal Corporation area is mainly concentrated at the industrial Estates of Maharashtra Industrial Development Corporation viz, the Satpur Industrial Estate & Ambad Industrial Estate. These well planned and established industrial area has a potential to incorporate industries manufacturing solar technology. The new industrial city will encourage use of renewable technology by providing easy local technological assistance.
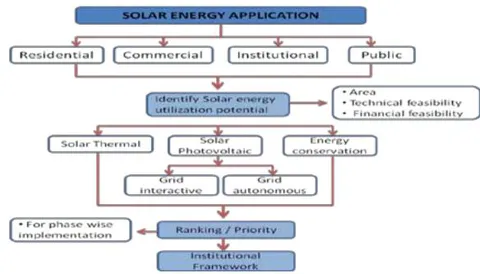
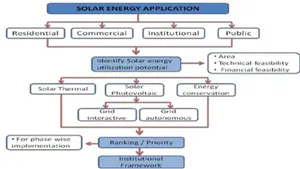
Solar energy is majorly utilized in two forms, as solar thermal and solar photovoltaic. Solar thermal finds its potential into residential sector, where there is hot water requirement. Solar photovoltaic has wide application. There are two ways of utilizing the output.
1. Grid Autonomous
2. Grid interactive
Grid autonomous works without the support of the conventional grid. The output is stored in the battery. For example solar street light and in Grid Interactive the panel's output is connected to the mail utility grid with help of converter.
ii. Energy Saving in Existing House Holds
Replacing all tubular Fluorescent Lamps (TFL) of 48 Watt/36 Watt lamps and electromagnetic ballasts (copper chokes) to energy saving T-8 or T-5 TFL of 28 watt/33 watt and electronic ballasts.
Replacing all general Lighting Service (GLS) bulbs of 100 watt/60 watt to compact Fluorescent (CFL) of 20watt/16watt.
Replacing all existing ceiling fans that consume 60 watt to 80 watt, varying with size and age to energy efficient 50 – watt ceiling fans.
Replacing all existing refrigerators with BEE labeled refrigerators.
Replacing all household electrical irons that consume 1100 watts to energy efficient 750- watt irons.
IV. RESULT
After conservation measures, following are the power consumptions for different categories of houses as per Devices.
a) HIG group Household
b) MIG Household
| Appliance | Wattage of regular device kW | Wattage of energy efficient device in kW | Appliance per house hold | Use per day (hrs) | Power consumption/ day kW | Power consumption after conservation measures/day kW |
| Tube Light with regular ballast | 0.048 | 0.033 | 5 | 3.5 | 0.84 | 0.5775 |
| Incandescent Lamps | 0.06 | 0.02 | 2 | 2 | 0.24 | 0.08 |
| Television | 0.1 | 1 | 10 | 1 | 1 | |
| Fans | 0.075 | 0.05 | 3 | 8 | 1.8 | 1.2 |
| Refrigerators | 0.1 | 1 | 24 | 2.4 | 2.4 | |
| Geysers | 2 | 1 | 0.75 | 1.5 | 1.5 | |
| Electric iron | 1 | 0.75 | 1 | 0.2 | 0.2 | 0.15 |
| Washing machine | 0.5 | 1 | 0.5 | 0.25 | 0.25 | |
| Computer | 0.1 | 1 | 2 | 0.2 | 0.2 | |
| Mixer grinder | 0.5 | 1 | 0.5 | 0.25 | 0.25 | |
| Air cooler | 0.25 | 1 | 6 | 1.5 | 1.5 | |
| TOTAL | 10.18 | 9.1075 | ||||
| Total Energy saving per day | 1.07 | |||||
| Annual Energy saving per HH in kW | 391.46 | |||||
| Tube light with regular ballast | 0.048 | 0.033 | 2 | 4.5 | 0.432 | 0.297 |
| Incandescent Lamps | 0.06 | 0.02 | 3 | 2 | 0.36 | 0.12 |
| Fans | 0.075 | 0.05 | 2 | 8 | 1.2 | 0.8 |
| Television | 0.1 | 1 | 8 | 0.8 | 0.8 | |
| Refrigerator | 0.1 | 1 | 16 | 1.6 | 1.6 | |
| Geyser | 2 | 1 | 0.5 | 1 | 1 | |
| Mixer Grinding | 0.5 | 1 | 0.5 | 0.25 | 0.25 | |
| TOTAL | 5.642 | 4.867 | ||||
| Total energy saving in kW | 0.775 | |||||
| Annual Energy saving per HH in kW | 282.875 | |||||
c) LIG Household
| Appliance | Wattage of regular device kW | Wattage of energy efficient device in kW | Appliance per house hold | Use per day (hrs) | Power consumption/ day kW | Power consumption after conservation measures/day kW |
| Tube light with regular ballast | 0.048 | 0.033 | 2 | 3.5 | 0.336 | 0.231 |
| Incandescent lamps | 0.06 | 0.02 | 2 | 3 | 0.36 | 0.12 |
| Television | 0.1 | 1 | 6 | 0.6 | 0.6 | |
| Fans | 0.075 | 0.05 | 1 | 9 | 0.675 | 0.45 |
| Mixer grinder | 0.5 | 1 | 0.2 | 0.1 | 0.1 | |
| TOTAL | 2.071 | 1.501 | ||||
| Total energy saving per day | 0.57 | |||||
| Annual Energy saving per HH in kW | 208.05 | |||||
V. CONCLUSION
Energy consumption plays an excellent role in every country's sustainable growth and environmental performance. In general, energy capacity has focused on energy efficiency. Being efficient in the use of all resources makes an important involvement toward both environmental and economic sustainability.
The study describes the findings to be aware of the factors and strategies that deal with energy efficiency. The information concerning energy policy and program improvement is important to generate strategies to develop technology with the aim of increasing productivity and optimizing energy consumption. The results highlight the need for policy makers and scientists to increase their attention towards energy efficiency, especially to have a positive impact in non-energy intensive sectors as well.
Less impact on the environment with the avoidance of new plant and related transmission lines. Reduction of electricity demand through the use of more efficient equipment will mean a reduction in the burning of fuel for the generation of electricity, thereby minimizing the emission of pollutants into the atmosphere.
If the entire community uses energy efficient appliances and installations, such as energy efficient lighting and air-conditioning systems, both the demand for electricity and the user's electricity bill will come down.