This study aimed at identifying Management’s attitude towards employees working in retail shops in Bangladesh by exploring some factors that specify attitude. The Study used descriptive statistics design. This study was based on a field survey which was conducted in different areas of Chattogram, Bangladesh. Cluster Random sampling technique was used to pick up the sample. The questionnaire was presented to 160 respondents in person, all of them responded; hence analyzed and presented in frequency distribution tables with their corresponding percentages and some statistics analysis. Other data were sourced from published academic journals, articles, and other relevant materials on the internet. The results indicate that Management in Retail Shop seems to have mildly negative attitude towards their employees. The Study summed up that Management should have more focus on employees’ financial and Non financial benefits as those indicate the attitude of them towards employees in retail shops in Bangladesh.
## I. INTRODUCTION
Management's attitude is the way of Business Growth. Management's Attitude has a profound impact on the way they lead people. Their attitude has a direct impact on how they communicate and collaborate with others, how they contribute to the culture of their work environment, and how they lead a firm/business. A Manager/Department Head/Proprietor with a good attitude breeds motivation within his/her department and/or organization. The attitude of leaders plays a role in developing the behavior, beliefs and attitude of employees. Motivation brings increased production, work satisfaction, work and personal appreciation, personal commitment and personal respect. The motivation of wanting to do a good job comes from within the employee. Motivation has direct relation with the employee performance. Management directs the business. In Retails Shops, Employees represent the Brand as they directly handle the Final consumers/customers. Their attitudes towards consumers/customers reflect on the profit/success of the Business. Consumers/Customers are the Sources of Profit or Growths of Business. Their ultimate satisfactions are essential in the Retail Business. In retail Shops, Consumers/Customers buy the attitudes of related staffs or employees. Employees' in retail shops proactive attitudes towards Consumers/Customers depends on the Management's Attitude. As Management's Attitude breeds Motivation, ultimately it affects Motivational Factors of Employee. It affects the way employees' sell and the way they serve customers. It can be also displayed towards individual job duties, products or services, coworkers or management, or the organization as a whole in the workplace. Attitudes are thought to have three components: an affective component (feelings), a behavioral component (the effect of the attitude on behavior), and a cognitive component (belief and knowledge). Management has the feelings for their employees could be defined as affective component of Attitude. Behavioral component describes how Management behaves with employees in aspects of benefits and relation. A cognitive component describes Management's belief and Knowledge regarding employees. Based on Management's belief and Knowledge employees are treated. As the most of the retail shops' management directly interacts with the employees, Employees can experience their attitudes directly. It could be positive experience or Negative experience. Beside Human Relations between management and employees are important. The Human relations reflect on working environment. Working environment leads to satisfaction and motivation; and increases productivity of employees. Some employees prefer financial benefits to non financial benefits. It varies employee to employee as they experienced different things from different ambiances in different time in their life. We collected some information regarding some financial and non financial motivational factors that specify Management's attitude towards employees from those employees working in different retail shops in Bangladesh. We wanted to know whether Management's attitude is Positive or Negative towards employees. Positive attitude satisfies employees that affects their responses. And Negative attitude dissatisfies employees that affects their responses also. Actually, Management attitude can be come to know by the responses of employees regarding their job working in Retails Shops.
## II. LITERATURE REVIEW
There appears to be a very few literature related to Management's attitude towards employees working in retail shops in Bangladesh. The following section describes Management, attitudes and Employee Salary and Benefits.
### a) Management
The management definition is a single or group of individuals who challenges and oversees a person or collective group of people in efforts to accomplish desired goals and objectives. Furthermore, the definition of management includes the ability to plan, organize, monitor and direct individuals. The management definition is also a person or collective group who possess the executive abilities to lead a group through hardships, aspiring to meet an organization's purpose and visions. According to Mc Farland, "Management is defined for conceptual, theoretical and analytical purposes as that process by which managers create, direct, maintain and operate purposive organization through systematic, coordinated co-operative human effort". As Henry Fayol defines, "To mange is to forecast and plan, to organize, to compound, to coordinate and to control". Harold Koontz says, "Management is the art of getting things done through and within formally organized group". Mary Parker Follett defines management as the "art of getting things done through people".
George R. Terry defines management as a process "consisting of planning, organizing, actuating and controlling, performed to determine and accomplish the objectives by the use of people and other resources".
The management are responsible for setting and achieving the firm's goals with and through other people. There are several management functions and roles that are needed in the management function of planning for an organization's success. Management function examples include the following:
- Accounting
- Business Administration
- Finance
- Human Resource
- Consulting
- Information Technology
- Marketing
- Sales
- Retails
- Operations Management
There have been a number of studies on what management actually do, the most famous of which conducted by Professor Henry Mintzberg in the early 1970s (Mintzberg, 1973). Mintzberg identified ten roles, which he divided into three groups: interpersonal, informational, and decisional. The informational roles link all managerial work together. The interpersonal roles ensure that information is provided. The decisional roles make significant use of the information (Carpenter, Bauer, Erdogan, 2012).
#### 1. Interpersonal Roles are the Following
- Figurehead - Management have social, ceremonial and legal responsibilities. They are a source of
inspiration. People look up to them as a person with authority, and as a figurehead.
- Leader - Management provides leadership for the team, organization, and manages the performance and responsibilities of everyone in the group.
- Liaison - Management communicate with internal and external contacts.
#### 2. Informational Roles are
- Monitor - Management regularly seek out information related to the organization and industry, looking for relevant changes in the environment. They also monitor the team, in terms of both their productivity and their well-being.
- Disseminator - Management communicate potentially useful information to the colleagues and the team.
- Spokesperson – Management represent and speak for their organization. They are responsible for transmitting information about their organization and its goals to the people outside it.
#### 3. Decisional Roles are
- Entrepreneur - Management creates and controls change within the organization. This means solving problems, generating new ideas and implementing them.
- Disturbance Handler - When an organization or team hits an unexpected roadblock, it is the manager who must take charge.
- Resource Allocator - Management need to determine where organizational resources are best applied. This involves allocating funding, as well as assigning staff and other organizational resources.
- Negotiator – Management take part in, and direct important negotiations within the team, department, or organization (Mintzberg's Management Roles).
Performing these roles is the basis of a management's job. The effectiveness of management depends on managements' skills. We have summed up the most important skills for management:
- Leadership skills;
- Influencing, delegating abilities;
- Communication skills;
- Critical thinking skills;
- Collaboration and negotiation skills;
- Project management skills;
- Human resources management skills;
- Time management skills;
- Forecasting skills.
### b) Attitude
"Attitude is everything" is a common quote. Anastasi defined attitude as "A tendency to react favorably or unfavorably towards a designated class of stimuli, such as a national or racial group, a custom or an institution." Thurstone said, "An attitude denotes the total of man's inclinations and feelings, prejudice or bias, preconceived notions, ideas, fears, threats, and other any specific topic." Attitude can and will make a difference in our personal lives and work environment; The attitude that we display towards our superiors, peers and subordinates generally decides their attitude towards us (By JAMES L. MAZUREK; July 1989).
Attitudes can form in different ways (Baron & Byrne, 1991; Eagly & Chaiken, 1993; Fazio & Petty, 2008; Luthans, 2008). Firstly, attitudes can form through situations where people's behaviour is not consistent with their attitudes towards the object (Baron & Byrne, 1991; Luthans, 2008). A negative attitude towards the object can form to balance this inconsistency towards the object (Eagly & Chaiken, 1993; Fazio & Petty, 2008).
Secondly, attitudes can form through the expectancy-value framework, a theory that assumes that the attitude towards the object is based on the sum of the values of all of the attributes that the attitude object is thought to have, which is based on the mental formation of attitudes (Ajzen, 2001; Eagly and Chaiken (1993) explain that this framework is a useful and popular model to explain how a collection of beliefs about objects forms attitudes. The expectancy-value framework attitude formation theory was adopted for this study.
### c) Employee Salary and Benefits
Salary is a fixed amount of money or compensation paid to an employee by an employer in return for work performed. Salary is commonly paid in fixed intervals, for example, monthly payments of one-twelfth of the annual salary. According to Cockman, "Employee benefits are those benefits which are supplied by an employer to or for the benefits of an employee, and which are not in the form of wages, salaries and time rated payments."
The four major types of employee benefits
- Medical insurance
- Life insurance
- Retirement plans
- Disability insurance
In its 2019 Employee Happiness Index, HR tech company distinguishes 4 categories of employee benefits:
- Benefits at Work
- Benefits for Health
- Benefits for Financial Security
- Lifestyle Benefits
- Benefits at Work
This includes working hours & leave, skills development, food & beverage, and employee clubs, activities & gifts.
Working Hours & Leave
Think of flextime here for instance. Flextime gives your employees the possibility to decide about their working hours and/or the location they want to work from. Other examples include additional holidays and, one of the other benefits employees value most, paid parental leave.
Skills Development
Rapid technological developments and the fact that people change jobs more often make skills development more important too. Skills development, however, is not just an important benefit for (younger) employees, it's also essential for organizations if they want to remain competitive.
Food & Beverage
We already mentioned the meal vouchers in France. Other benefits that fall into this category include free lunches, fruit, and coffee. At AIHR, we get to enjoy a free lunch every day and it's something that's very much appreciated by the team. As an added bonus, free lunch and fruit are also a good way to promote healthy eating habits at work.
#### Employee Clubs, Activities & Gifts
There are heaps of possibilities when it comes to this category of the employee benefits package: knitting clubs, running groups, (video) game nights, Secretantas, anniversary gifts, you name it.
#### Benefits for Health
Health and Wellness
More and more companies have employee wellness programs. The possibilities are endless and examples of employee wellness programs vary from a simple gym membership to full suite solutions that include physical, mental and financial wellness. A focus on total employee wellbeing will be one of the key HR trends for 2023, and organizations with the HR departments in the lead will be looking for ways to improve the different aspects of their employees' wellbeing.
#### Healthcare
Healthcare benefits also come in different shapes and sizes. Think of physiotherapy and chiropractic sessions, for instance, but sometimes fertility treatments and psychological support can also be included.
#### Benefits for Financial Security
The number one thing here is pension plans. Other benefits for financial security are insurances, financial benefits for employees, and personal finance benefits.
Pension plans
Interestingly, according to the research study, pension plans are considered as a very important benefit by every generation, but they're not among the top ten most appreciated benefits.
#### Insurances
As we mentioned above, in some countries health insurance is something that comes with the simple fact of being an employee. Other types of insurance benefits for employees cover parental leave or injury.
#### Financial Benefits
Think of commissions, bonuses and the possibility for employees to buy shares of the company they work for.
#### Personal Finance Benefits
The Benify report too shows that stress about personal finances has grown bigger over the past year. Yet another reason for employers to seriously start thinking of benefits such as advice about loans and savings. In other words: employee financial wellness.
#### Lifestyle Benefits
Lifestyle benefits consist of work-life balance and mobility.
#### Work-Life Balance
As employees increasingly attach importance to their work-life balance, it's no surprise that benefits in this area become more popular too. Examples are childcare, grocery delivery, and legal services.
#### Mobility
Mobility benefits can make your employees' life a lot easier. Because even if they can work from home or elsewhere, they'll still have to come into the office - or workplace - regularly. This category covers things like public transport and cars but also bicycles and carpooling.
## III. METHODS
### a) Survey Design
A Likert scale assumes that the strength/intensity of an attitude is linear, i.e. on a continuum from strongly agree to strongly disagree, and makes the assumption that attitudes can be measured. Likert Scales have the advantage that they do not expect a simple yes/no answer from the respondent, but rather allow for degrees of opinion, and even no opinion at all. We used Likert scale for getting participants' opinions regarding management attitudes that everyday employees experience.
### b) Participants
We conducted a survey in different areas of Chattogram (Known as Port City), Bangladesh. The goal of this survey was to know the attitudes of Management toward employees working in the Retail Shop. Some employees were willing to response and some were willful not to response in front of management and behind them. They think it is not essential to response our survey questionnaires as this is not beneficial for them. But We did not lose our hope. We met some employees of retail shops who shared their responses of we survey questionnaires. In this survey 160 Employees participated who were from Different Retail Shops.
### c) Procedure
Eleven Questions were asked to employees working in the Retail Shops as following: "I am happy working Here, I get a Handsome Salary, The working Environment is Good, The Boss is Generous, I enjoy good number of holidays, I get reward while doing good performance, I get punishment while doing bad performance, The pressure is high, I got target list, Fear of getting fired, Rational Working Hours". They were free to give opinion of their own. They could choose one option from strongly agree, agree, not certain, disagree or strongly disagree. We analyzed the responses based on every question. How many employees were strongly agree, agree, not certain, disagree or strongly disagree on Question was our aim to know in this survey.
### d) Ethics
We obtained opinion from every participant in person. So, the opinions were participants' individual opinions. We hid the identity of every participant so that they could not affected by any harassment for participating in our survey.
## IV. ANALYSIS AND DISCUSSION
The data analyzed and findings discussed herein, is based on the respondents' responses to the 11 questions structured according to the Likert 5-point rating scale, with: SD = representing strongly disagree, D= for disagree, U = for uncertain/neutral, A = for agree, and SA = for strongly agree; rated on a scale of 1-5 respectively. Each of 160 Participants answered to each question. And we showed some statistical data, Rounding down to 2, with: X = Mean, σ = Standard Deviation, $s^2$ = Variance and SE = Standard Error.
Table 1: Q 1- I am Happy Working here
<table><tr><td>Q-1</td><td>SA</td><td>A</td><td>U</td><td>D</td><td>SD</td><td>X</td><td>σ</td><td>s2</td><td>SE</td></tr><tr><td>I am Happy Working here</td><td>4(2.50)</td><td>60 (37.50)</td><td>37 (23.13)</td><td>46 (28.75)</td><td>13 (8.12)</td><td>2.98</td><td>1.05</td><td>1.09</td><td>0.08</td></tr></table>
Table 1 above showed that the rate of responses was $100\%$. 4 participants were strongly agreed, 60 participants were agreed, 37 participants were uncertain or chose to be neutral, 46 participants were disagreed and 13 participants were strongly disagreed with the question. The percentage rate is $2.50\%$, $37.50\%$, $23.13\%$, $28.75\%$ and $8.12\%$ respectively. The Mean, Standard Deviation, Variance and Standard Error are X 2.98, σ 1.05, s2 1.09 and SE 0.08. The Table revealed that participants are not more working in their present job place.
Table 2: Q 2- I Get a Handsome Salary
<table><tr><td>Q 2</td><td>SA</td><td>A</td><td>U</td><td>D</td><td>SD</td><td>X</td><td>σ</td><td>s2</td><td>SE</td></tr><tr><td>I Get a Handsome Salary</td><td>2(1.25)</td><td>53 (33.12)</td><td>73(45.63)</td><td>24(15)</td><td>8 (5)</td><td>3.11</td><td>0.85</td><td>0.72</td><td>0.07</td></tr></table>
The above Table presented that 2 participants were strongly agreed, 53 participants were agreed, 73 participants were uncertain or chose to be neutral, 24 participants were disagreed and 8 participants were strongly disagreed with the question. The percentage rate is $1.25\%$, $33.12\%$, $45.63\%$, $15\%$ and $5\%$
respectively. The Mean, Standard Deviation, Variance and Standard Error are X 3.11, σ 0.85, s2 0.72 and SE 0.07. Above data show that participants are neutral in their decision to opine whether they get handsome salary or not.
Table 3: Q 3- The Working Environment is Good
<table><tr><td>Q 3</td><td>SA</td><td>A</td><td>U</td><td>D</td><td>SD</td><td>X</td><td>σ</td><td>s2</td><td>SE</td></tr><tr><td>The working Environment is Good</td><td>4(2.50)</td><td>49 (30.63)</td><td>57 (35.63)</td><td>46 (28.75)</td><td>4(2.50)</td><td>3.01</td><td>0.89</td><td>0.80</td><td>0.07</td></tr></table>
The above Table revealed that 4 participants were strongly agreed, 49 participants were agreed, 57 participants were uncertain or chose to be neutral, 46 participants were disagreed and 4 participants were strongly disagreed with the question. The percentage rate is $2.50\%$, $30.63\%$, $35.63\%$, $28.75\%$ and $2.50\%$ respectively. The Mean, Standard Deviation, Variance and Standard Error are X 3.01, $\sigma 0.89$, $\mathbf{s}^20.80$ and SE 0.07. Participants are neutral also in their decision to opine whether the working environment is good or not.
Table 4: Q 4- The Boss is Generous.
<table><tr><td>Q-4</td><td>SA</td><td>A</td><td>U</td><td>D</td><td>SD</td><td>X</td><td>σ</td><td>s2</td><td>SE</td></tr><tr><td>The Boss is Generous</td><td>0(0)</td><td>42
(26.25)</td><td>58
(36.25)</td><td>59(36.88)</td><td>1 (0.62)</td><td>2.88</td><td>0.81</td><td>0.65</td><td>0.06</td></tr></table>
The above Table specified that none of participants was strongly agreed, 42 participants were agreed, 58 participants were uncertain or chose to be neutral, 59 participants were disagreed and 1 participant were strongly disagreed with the question. The percentage rate is $0\%$, $26.25\%$, $36.25\%$, $36.88\%$ and $0.62\%$ respectively. The Mean, Standard Deviation, Variance and Standard Error are X 2.88, $\sigma 0.81$, $s^20.65$ and SE 0.06. Participants are almost disagreed regarding the generosity of their Boss.
Table 5: Q 5- I Enjoy Good Number of Holidays
<table><tr><td>Q-5</td><td>SA</td><td>A</td><td>U</td><td>D</td><td>SD</td><td>X</td><td>σ</td><td>s2</td><td>SE</td></tr><tr><td>I Enjoy Good Number of Holidays</td><td>1(0.63)</td><td>36 (22.50)</td><td>54 (33.75)</td><td>64(40)</td><td>5 (3.12)</td><td>2.77</td><td>0.85</td><td>0.72</td><td>0.07</td></tr></table>
The above Table specified 1 participant was strongly agreed, 36 participants were agreed, 54 participants were uncertain or chose to be neutral, 64 participants were disagreed and 5 participants were strongly disagreed.
The percentage rate is $0.63\%$, $22.50\%$, $33.75\%$, $40\%$ and $3.12\%$ respectively. The Mean, Standard Deviation, Variance and Standard Error are X 2.77, $\sigma$ 0.85, $\mathrm{s}^2$ 0.72 and SE 0.07. Participants could not be able to enjoy good number of holidays. They get few.
Table 6: Q 6- I Get Reward while doing Good Performance
<table><tr><td>Q-6</td><td>SA</td><td>A</td><td>U</td><td>D</td><td>SD</td><td>X</td><td>σ</td><td>s2</td><td>SE</td></tr><tr><td>I Get Reward while doing Good Performance</td><td>0(0)</td><td>38 (23.75)</td><td>60 (37.50)</td><td>56 (35)</td><td>6 (3.75)</td><td>2.82</td><td>0.84</td><td>0.71</td><td>0.07</td></tr></table>
The above Table stated none of participants were strongly agreed, 38 participants was agreed, 60 participants were uncertain or chose to be neutral, 56 participants were disagreed and 6 participants were strongly disagreed. The percentage rate is $0\%$, $23.75\%$,
37.50%, 35% and 3.75% respectively. The Mean, Standard Deviation, Variance and Standard Error are X 2.82, σ 0.84, s2 0.71 and SE 0.07. Participants do not get enough reward (financially or non-financially) while doing good performance.
Table 7: Q 7- I Get Punishment while doing Bad Performance
<table><tr><td>Q-7</td><td>SA</td><td>A</td><td>U</td><td>D</td><td>SD</td><td>X</td><td>σ</td><td>s2</td><td>SE</td></tr><tr><td>I Get Punishment while doing Bad Performance</td><td>1(0.63)</td><td>24(15)</td><td>75 (46.88)</td><td>47 (29.37)</td><td>13 (8.12)</td><td>2.70</td><td>0.84</td><td>0.71</td><td>0.07</td></tr></table>
The above Table stated 1 participant was strongly agreed, 24 participants were agreed, 75 participants were uncertain or chose to be neutral, 47 participants were disagreed and 13 participants were strongly disagreed. The percentage rate is $0.63\%$, $15\%$,
46.88%, 29.37% and 8.12% respectively. The Mean, Standard Deviation, Variance and Standard Error are X 2.70, σ 0.84, s2 0.71 and SE 0.07. Participants do little experience of punishment while doing bad performance.
Table 8: Q 8- The Pressure is High
<table><tr><td>Q-8</td><td>SA</td><td>A</td><td>U</td><td>D</td><td>SD</td><td>X</td><td>σ</td><td>s2</td><td>SE</td></tr><tr><td>The Pressure is High</td><td>11(6.88)</td><td>40 (25)</td><td>59(36.88)</td><td>46 (28.75)</td><td>4 (2.50)</td><td>3.06</td><td>0.96</td><td>0.91</td><td>0.08</td></tr></table>
The above Table revealed 11 participants were strongly agreed, 40 participants were agreed, 59 participants were uncertain or chose to be neutral, 46 participants were disagreed and 4 participants were strongly disagreed. The percentage rate is $6.88\%$, $25\%$,
36.88%, 28.75% and 2.50% respectively. The Mean, Standard Deviation, Variance and Standard Error are X 3.06, σ 0.96, s2 0.91 and SE 0.08. Participants remained neutral in the question of rush hour.
Table 9: Q 9- I Got Target List
<table><tr><td>Q-9</td><td>SA</td><td>A</td><td>U</td><td>D</td><td>SD</td><td>X</td><td>σ</td><td>s2</td><td>SE</td></tr><tr><td>I Got Target List</td><td>1(0.63)</td><td>29 (18.12)</td><td>60 (37.50)</td><td>30(18.75)</td><td>40 (25)</td><td>2.52</td><td>1.07</td><td>1.15</td><td>0.09</td></tr></table>
The above Table showed 1 participant was strongly agreed, 29 participants were agreed, 60 participants were uncertain or chose to be neutral, 30 participants were disagreed and 40 participants were strongly disagreed. The percentage rate is $0.63\%$,
18.12%, 37.50%, 18.75% and 25.00% respectively. The Mean, Standard Deviation, Variance and Standard Error are X 2.52, σ 1.07, s2 1.15 and SE 0.09. Target to sell or to serve customer is few.
Table 10: Q 10- Fear of Getting Fired
<table><tr><td>Q-10</td><td>SA</td><td>A</td><td>U</td><td>D</td><td>SD</td><td>X</td><td>σ</td><td>s2</td><td>SE</td></tr><tr><td>Fear of Getting Fired</td><td>8(5)</td><td>52 (32.50)</td><td>60 (37.50)</td><td>33 (20.63)</td><td>7 (4.37)</td><td>3.14</td><td>0.94</td><td>0.89</td><td>0.07</td></tr></table>
The above Table displayed 8 participants were strongly agreed, 52 participants were agreed, 60 participants were uncertain or chose to be neutral, 33 participants were disagreed and 7 participants were strongly disagreed. The percentage rate is $5.00\%$,
32.50%, 37.50%, 20.63% and 4.37% respectively. The Mean, Standard Deviation, Variance and Standard Error are X 3.14, σ 0.94, s2 0.89 and SE 0.07. Participants are neutral in question of getting fired.
Table 11: Q 11- Rational Working Hours
<table><tr><td>Q-11</td><td>SA</td><td>A</td><td>U</td><td>D</td><td>SD</td><td>X</td><td>σ</td><td>s2</td><td>SE</td></tr><tr><td>Rational
Working
Hours</td><td>3(1.88)</td><td>42(26.25)</td><td>49(30.62)</td><td>35
(21.88)</td><td>31
(19.37)</td><td>2.69</td><td>1.11</td><td>1.24</td><td>0.09</td></tr></table>
The above Table displayed 3 participants were strongly agreed, 42 participants were agreed, 49 participants were uncertain or chose to be neutral, 35 participants were disagreed and 31 participants were strongly disagreed. The percentage rate is $1.88\%$, $26.25\%$, $30.62\%$, $21.88\%$ and $19.37\%$ respectively. The Mean, Standard Deviation, Variance and Standard Error are X 2.69, σ 1.11, s2 1.24 and SE 0.09. Participants think they do not get Rational Working Hours.
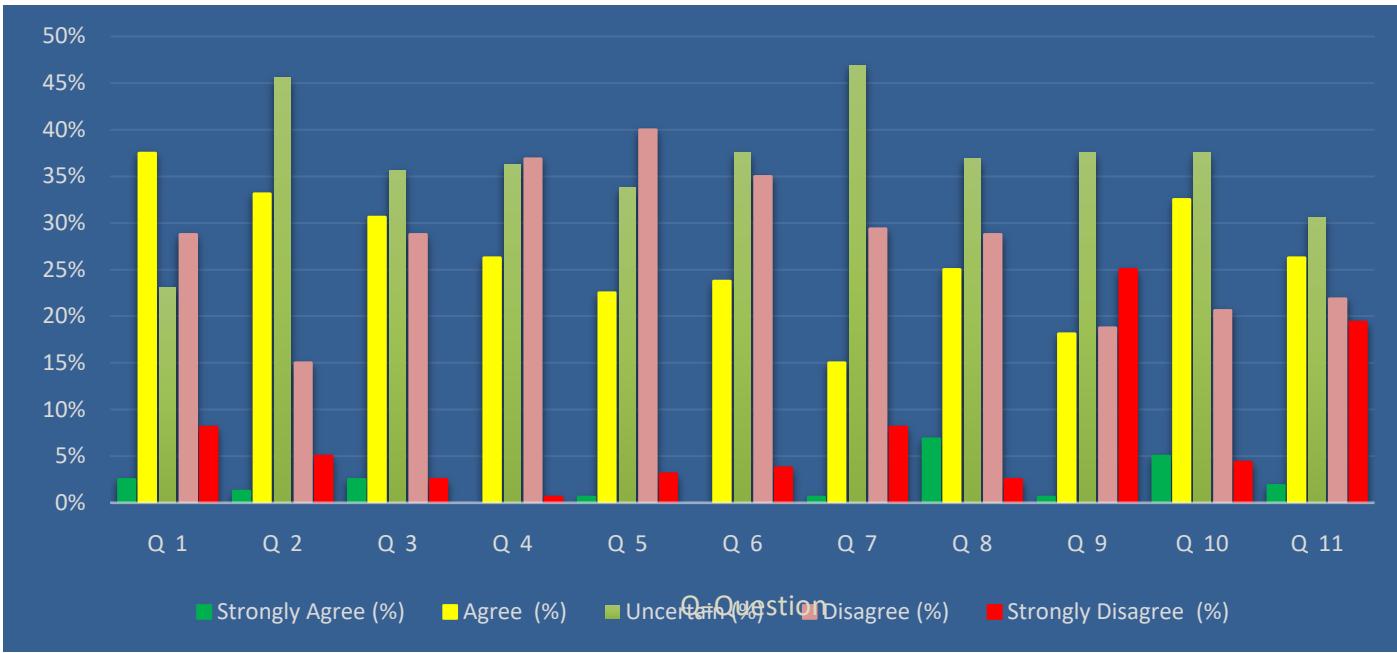 Fig.1: Responses Percentage of Participants
The above figure-1 shows that Responses Percentage of Participants in terms of opinion for every question.
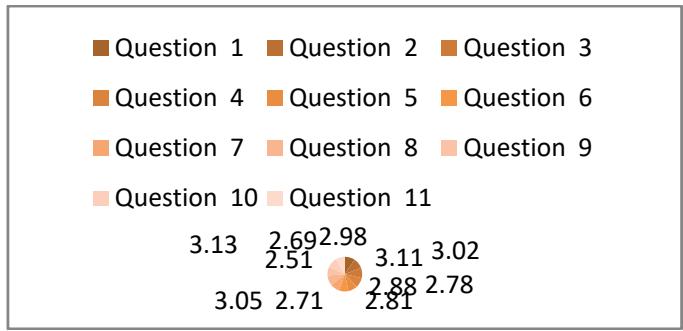 Fig. 2: Mean of Respondents' Scores
The above figure-2 shows Mean of Respondents' Scores in terms of opinion for every question.
Rounding down to 2, the sentiment score of our survey in term of mean of all questions responded by participants is X 2.88, the deviation of Mean of all questions is $\sigma$ 0.20, Skewness is Y1 -0.43, Variance s2
= 0.04, Range is R 0.62, Coefficient of Variation is CV 0.07, Mean Absolute Deviation is MAD 0.16, Relative Standard Deviation is RSD $6.87\%$, Interquartile Range is IQR 0.34, Mid Range is MR 2.82 and Standard of Error is 0.06.
Table 12: Summary of Analysis
<table><tr><td>X</td><td>σ</td><td>Y1</td><td>R</td><td>s2</td><td>CV</td><td>MAD</td><td>RSD</td><td>IQR</td><td>MR</td><td>SE</td></tr><tr><td>2.88</td><td>0.20</td><td>-0.42</td><td>0.62</td><td>0.04</td><td>0.07</td><td>0.16</td><td>6.87%</td><td>0.34</td><td>2.82</td><td>0.06</td></tr></table>
## V. CONCLUSION
We asked mentioned questions to the employees that defines Management's attitude. Questions were related to employees financial issues and Non-Financial issues that give them mental satisfaction and they can spend more time with family. Most of the participants were uncertain or neutral regarding their job security, Salary, Pressure in work place, Target, Working Hours and Working environment. They enjoy very few holidays in a calendar year. Normally Management does not take strict actions against employees regarding doing bad performance. Employees are not happier working their work place, they accept the situation as most of them comes from needy family and they need a job for living a life. The relation between management and employees are mildly bad. The results indicate that Management in
Retail Shops seems to have mildly negative attitudes towards their employees.
## VI. RECOMMENDATIONS
Management should have more focus on employees' financial and Non financial benefits. A Retail Shop is only as strong as its employees, which is why it is imperative for managers to ensure employees are happy and valued. Getting to know team can make a world of difference in creating a happy culture and a happy workplace. Maintaining happiness and Motivation at the workplace is a team effort. As the old saying goes, "Teamwork makes the dream work."Due to the lack of opinions of whole employees working in retail shops in Bangladesh, the results may vary. The current study can be interpreted as a first step in the study on Management's attitude towards employees in retail shops in Bangladesh. However, the results of this study should be treated with caution due to the small sample size and the lack of details regarding the participants' Opinions. Future research could collect further data and engage more participants for making sample size big regarding Management's attitude towards employees for more accurate results. It could also contribute to a deeper understanding of the Management Attitude.
Generating HTML Viewer...
References
14 Cites in Article
James Mazurek (1989). ATTITUDE: AN IMPORTANT MANAGEMENT TOOL.
Erica Lizano,Michalle Mor Barak (2015). Job burnout and affective wellbeing: A longitudinal study of burnout and job satisfaction among public child welfare workers.
C Anastasi (1957). Attitude of in-service and preservice primary school teachers.
L Thurstone (1928). Attitudes Can Be Measured.
D Mcgregor (1960). The human side of enterprise.
A Eagly,S Chaiken (1993). The psychology of attitudes. A.H. Eagly & S. Chaiken. Fort Worth, TX: Harcourt, Brace, & Janovich, 1993, 794 pp. Reviewed by Christopher Leone, University of North Florida.
R Fazio,R Petty (2008). Attitudes.
R Baron,D Byrne (1991). Social psychology: Understanding human interaction.
Fred Luthans,Julie Broad (2008). Positive Organizational Behavior and Psychological Capital.
I Ajzen (2001). Nature and operation of attitudes.
Gayane Tovmasyan (2017). The Role of Managers in Organizations: Psychological Aspects.
Gayane Tovmasyan (2012). The Role of Managers in Organizations: Psychological Aspects.
(null). CHAPTER ONE. MANAGEMENT AND LEADERSHIP THE ROLES OF MANAGERS.
P Cantrell (2001). Temperament, Stress, and Soothing.
No ethics committee approval was required for this article type.
Data Availability
Not applicable for this article.
How to Cite This Article
Md. Mayeen Uddin. 2026. \u201cManagements Attitude Towards Employee Working in the Retail Shop in Bangladesh\u201d. Global Journal of Management and Business Research - A: Administration & Management GJMBR-A Volume 23 (GJMBR Volume 23 Issue A2).
Explore published articles in an immersive Augmented Reality environment. Our platform converts research papers into interactive 3D books, allowing readers to view and interact with content using AR and VR compatible devices.
Your published article is automatically converted into a realistic 3D book. Flip through pages and read research papers in a more engaging and interactive format.
Our website is actively being updated, and changes may occur frequently. Please clear your browser cache if needed. For feedback or error reporting, please email [email protected]
Thank you for connecting with us. We will respond to you shortly.