Brazil and the US are world’s largest soybean exporters, and account for more than 80% of the global exports, most of which, destined to China. Hence, the producers of both countries compete directly to place their grain in the same market, and their logistic costs are essential to their competitiveness. For the producers in Mato Grosso (MT), Brazil’s largest producing state and most distant from ports, choosing the best route and transport mode materially impacts their competitiveness. The farm to port logistics, which refers to the inland transportation from the agricultural production point to the exporting shipping port, is central to reducing the total logistics costs, and depending on the transport mode choice, also impacts the environment differently. Various studies have evaluated routes or transport modes individually by analysing their impact, and some give an insight into the least cost (LC) choice, yet to the best of our knowledge, there are none determining the detailed spatial geographic boundaries of the optimum choice transport corridors for each micro geographic location within MT.
## I. INTRODUCTION
Since 2013, Brazil is the leading global exporter of soybeans (Lee et al., 2016; Salin, 2014; Salin; Somwaru, 2018), and together with the United States (US) account for more than $80\%$ of global soybean exports, which means that they are competitors in importing markets. China, which was responsible for $62.6\%$ of the global imports of soybeans in 2017, is the largest importer. Brazil was responsible for $48.4\%$, and the US for $39.4\%$: together, they represented $87.8\%$ of all Chinese imports of soybeans (Clever, 2018). That same year, Brazil produced 103.8 million tons, of which $70.3\%$ was exported (CONAB, 2017a), implying that $62\%$ of the Brazilian exports were destined to China. Soybeans accounted for US$ 25.7 billion, or $11.8%$ of the country's exports, and were the single most relevant item in the balance of trade (MDIC, 2018).
In both countries, the major soybean producing regions are located in the heart of the country, distant from the exporting deep-water ports (EDP). In the US, the main producing area, is the Midwest (Salin and Somwaru, 2018), which can be considered the equivalent of the Centro-Oeste, which is Brazil's Midwestern region, and also the country's leading producer (CONAB, 2017a). In both regions, China is the primary destination, and the port of Shanghai is commonly used as the port of reference (Lopes et al., 2017; Lopes; Lima; Ferreira, 2016; Salin, 2014; Salin; Somwaru, 2018; USDA, 2018a). In Brazil, the Midwest was responsible for $41.9\%$ of the country's soybean exports, and the state of MT alone accounted for $28.2\%$ in 2017 (CONAB, 2017a), but is also the most distant from the EDP (IMEA, 2018a).
Therefore, the main competition between Brazilian and US producers, responsible for more than $80\%$ of the global exports of soybeans, is in the total cost at which the commodity is delivered at the port of destination, which includes all costs from the production to the international shipping, and the transport costs from the producer's farm through to the EDP known by the term of "farm to port" (Salin and Somwaru, 2018).
Compared to the US transport costs, the farm to port cost of MT is higher than that of the US Midwest,
whereas the difference of the international shipping costs between the Brazilian and the US EDP to China is not as expressive as those of the farm to port (USDA, 2018a). Therefore, to compete in the international market, the negotiated Brazilian soybean farm gate prices must necessarily be lower to have the same total landed cost at the port of Shanghai. While the average farm to port transport costs in the US represent $13.7\%$ of the total landed cost in Shanghai, that of northern MT stands at $18.4\%$ in the 4th quarter of 2018 (USDA, 2019).
The cost difference of farm to port logistics in MT, of nearly $5\%$ more than those of the US Midwest, are materially relevant to the competitiveness of the producers in MT.
Soybeans are grains that will not deteriorate for many months if the principles of adequate storage and handling are ensured (Charles and Hurburgh, 2008). The grain should be kept free from humidity, high temperatures, and plagues. Therefore, the time variable of the transport logistics is not as important as that of the costs. Considering the distance of MT from the EDP and the high costs of road transportation, which is typically used to transport grains in Brazil, multimodal transport, which is the combination of different modes of transport, can be the best option to reduce domestic transport costs, or farm to port costs, despite often being slower.
With the rapid increase in export volumes of soybeans using the EDP capable of handling the commodity in the last decade, attention has been given to the Northern Arc ports, responsible for an increase in exports from 7.2 million tons of maize, soybean grains and meal in 2009, to 27.7 million tons in 2017 (Fayet, 2018). The Northern Arc, which is a term that started to be used by the Brazilian Confederation of Agriculture (CNA) in early 2000 (Marinha, 2013, 2010), was initially considered the EDP of the Amazon Basin and the port of São Luis, located on the northern part of the Brazilian coast. By 2009, the concept evolved to consider the Northern Arc all EDP northwards of the sixteenth parallel south and started to be used in formal reports (CONAB, 2017a; Deputados, 2016; Fayet, 2018). Studies suggest that the Northern Arc should be favoured by the producers north of the sixteenth parallel south, but do not address the optimal balance between the Northern Arc and the remaining EDP considered the Southern Arc. The imaginary line of the sixteenth parallel south is also not a precise division of the areas of influence of the Northern and Southern Arcs. Hence, producers located in MT, which is divided by sixteenth parallel south, have the option to use both the Northern and Southern Arcs, and no clear indication of the optimal choice for each micro geographic location.
This Operational Research (OR) is an exploratory case study based on empirical research and quantitative modelling (Will M. Bertrand and Fransoo,
2002), comparing the currently available transport options to identify the LC corridors for farm to port exports of soybeans from MT. It covers the identification of the LC corridors for each specific municipality within the state of MT, aiming to determine the geographic spatial borders that will present the optimum choice export corridor, and generates a detailed geographic map based on the model indicating the most competitive system-wide final cost of the exported soybeans. Additionally, this research also aims to identify the most competitive transport mode or combinations of modes for each one of the identified transport corridors, and as a result, will identify the ideal balance of which of the two exporting arcs the producers of MT should favour. The findings are also valuable to other stakeholders, such as policymakers and logistics operators, that can benefit from insights to further enhance competitiveness through targeted public policies and logistics investments.
Furthermore, current global supply chains are under duress, with a string of events since 2018 that directly impact logistics costs and operational challenges to international shipping trade. The most impacting events consist of the US-China trade war that flared in 2018 with a $25\%$ Chinese tariff on numerous items originating in the US, including soybeans (Biesheuvel, 2018); the global Coronavirus epidemic and subsequent disruptions in 2020 and 2021 (Vilko and Hallikas, 2024); and more recently, the Red Sea crisis (Economist, 2023) and severe drought of the Gatun Lake in Panama since 2023 (Barnes et al., 2024), causing disruptions to the Red Sea and Panama Canal shipping routes and resulting in severe delays in international shipping routes and logistics costs which persist to date. In this harsh environment, potential cost reductions of farm to port logistics are ever more important to producers in MT, as these are more predictable and a choice of the producer, once aware of the LC transport corridors options and their respective costs and shipping routes.
The scope of this paper does not evaluate the available capacities of the individual transport modes and corridors, and we suggest further complementary studies that can identify restrictions and therefore strengthen the framework of investment opportunities for the private and public sector to enhance the competitiveness of the farm to port transport costs from soybeans originated in MT.
## II. THEORETICAL FRAMEWORK
The theoretical framework contextualizing and defining the key concepts are organized two sections for a clear comprehension work being developed.
### a) Background
Production and exports of soybeans in MT, a leading producer and exporter of agricultural
commodities, have dramatically increased in the last two decades at a faster pace than the expressive growth of the rest of Brazil, (IMEA, 2018a). In 2018, MT exported $79.4\%$ of its soybean production, including soybean meal and oil. In the same year, $45.2\%$ of the 19.8 million tons of soybean grains were transported to the EDP in northern Brazil, and the remaining $54.8\%$ to the EDP in southern Brazil (IMEA, 2019a), indicating two distinct logistic directions. This increase in production and competition in global markets has caught the attention of the academic community, addressing different questions and knowledge gaps in their research, such as production costs, transport costs, logistics constraints, competitiveness, and other related issues.
Some studies are regional, and others analyse Brazil or its relations with other nations. This is also true for soybeans, with concentration only in the last decade. However, less research can be found related to the farm to port costs and the optimal choice of transport corridors associated with the different geographic locations within the state of MT.
The regional studies are mostly limited to states or large macro regions. The increase in soybean production and consequent spatial geographic expansion encompassing larger areas, often further from the major logistics infrastructure such as roads, railways, or inland waterways, imply in higher farm to port costs. Therefore, studies related to macro regions in MT that are as large as countries the size of Qatar or Kuwait, are less likely to successfully address the farm to port logistics for stakeholders, such as producers or policymakers, with a more specific approach. MT is not only a large state, but grappling with logistics infrastructure limitations, partially due to its expanding agriculture, but also other aspects, such as no relevant inland waterways, and counting on only 366km of railroads in the southern part of the state (SINFRA, 2024). These factors contribute to making the logistics a challenge to the various stakeholders, and the choice of the ideal solution a relevant factor. Furthermore, the Outlook 2034 report published by IMEA (2024), which is the economic and agricultural body linked to the state of MT, predicts an increase of $24.06\%$ in crop productivity between 2024 and 2034, and of $65.22\%$ in total soybean production, pointing to more logistics challenges in the near future.
While researching, we found none, explicitly identifying the spatial geographic boundaries of the individual micro-regions within MT, determining the optimum choice for the LC transport corridor and the consequent ideal modal choice or combination of the transport modes available for each distinct corridor of soybean exports, motivating this paper. Additionally, it also covers the perspective of the ideal balance between the EDP of northern and southern Brazil to enhance the competitiveness of the exported soybeans of MT: is the current balance ideal, with the best direct
benefits to the producers? How does a potential adjustment of the balance and choice for the LC transport corridor impact the logistics? What are the environmental implications of the choice for the different transport corridors?
We searched the $\text{CAPES}^1$ base for academic production using the keywords "Mato Grosso", "Soybeans", "Transport", and "Cost". The search returned 256 results, of which $75\%$ were from the last decade, which coincides with the period of substantial expansion in the production of soybeans in Brazil's Midwest region and the consequent difficulties in managing to transport the commodity to the EDP (Fliehr, 2013; Ripoll, 2012; Soliani, 2015). 17 of these 256 results are related to the subject of interest and MT, and only three are relevant to this paper (Fliehr; Zimmer; Smith, 2019; Lopes et al., 2017; Melo et al., 2018), but do not address the specific objective. To ensure that the search for academic production was as encompassing as possible and avoid bias, a similar search was conducted on the Google Scholar base, which returned 278 results, many of which were the same. In this second search, only two additional articles with relevance were found (Assis et al., 2018; Lopes et al., 2016). Of the total five relevant articles, only that of Assis, Gonçalves and Silva (2018) covers the LC modal choice but is limited to 7 macro-regions of MT - a state that is larger than France and Germany together (IMEA, 2017), based on the premise that transport costs are homogeneous throughout each macrolegion, and suggests further studies in its conclusion. Therefore, to the best of our knowledge, there are no academic papers regarding the specific aim of this paper. A possible explanation of the limited number of results was outlined by Macharis and Bontekonig (2004), who indicated that "the use of OR in intermodal transport research is still limited. The intermodal transport system is more complex to model than the mono-modal one and thus more difficult to research".
### b) Literature Review
The literature review of this paper is detailed in five sections to allow for a better understanding of the terms employed.
## i. Commodities
A commodity is "a physical asset that has standardized characteristics, widely negotiated in diverse localities, [and] which can be transported and stored for a long period of time" (Pereira, 2009), and can, therefore, be easily substituted by another sourced from a different region or country. In the case of the soybean plant, the commodity is their beans, due to
their high protein value (Mandarino, 1987), and are usually classified together with maize as grains. In 2016, the global production of soybeans amounted to 133 million tons and was consumed in more than 150 countries (FAO, 2018).
## ii. Production and Exports of the Soybean Complex
The Ministry of Development, Industry and Foreign Trade of Brazil (MDIC), defines the soybean complex as that encompassing soybean grains, meal, and oil. It made public that in 2017, the soybean complex was the single most relevant product or service of the balance of trade, ahead of traditional items such as minerals, automobiles, and aeroplanes, representing US( 25.7 billion, or (11.8%) of all of Brazil's exports (MDIC, 2018). In a report dedicated to the theme of the Brazilian soybean complex, the United States Department of Agriculture (USDA) recognized that "in 2013, Brazil for the first time surpassed US soybean
exports, becoming the top world soybean exporter" (Salin, 2014). In another report published by the USDA, Lee et al. (2016) states that "the United States and Brazil account for over 80 percent of global soybean exports". Therefore, the export of soybeans is relevant to both the US and especially to Brazil.
Since 2008, China is the largest importer of soybeans, with imports in 2017 totalling 93.5 million tons (FAO, 2018). Of these imports, Brazil was the origin of 45.3 million tons, and the US for 36.8 million tons, and together the two countries accounted for $87.9\%$ of the Chinese imports (Clever, 2018). In its sixth report on the Brazilian 2016/2017 crop, the Brazilian National Supply Company $(\mathrm{CONAB})^2$ estimated the 2017 exports at 72.97 million tons, representing $70.3\%$ of the 103.78 million ton production (CONAB, 2017a). The Brazilian Midwest has the most significant production, responsible for $41.9\%$ of the exports in 2017 (Table 1).
Table 1: Export Estimates for Brazil's Soybean Complex by Region and Exported Production
<table><tr><td>Region</td><td>Soybean Production (thousand tons)</td><td>Exports Soybean Complex (thousand tons)</td><td>Exports / Production (%)</td></tr><tr><td>North</td><td>5,380</td><td>4,115</td><td>76.5</td></tr><tr><td>Northeast</td><td>9,100</td><td>6,762</td><td>74.3</td></tr><tr><td>Midwest</td><td>47,350</td><td>30,558</td><td>64.5</td></tr><tr><td>Southeast</td><td>7,400</td><td>6,068</td><td>82.0</td></tr><tr><td>South</td><td>34,550</td><td>25,471</td><td>73.7</td></tr><tr><td>Brazil</td><td>103,780</td><td>72,974</td><td>70.5</td></tr></table>
The state of MT was responsible for $28.2\%$ of the soybean complex exports in 2017, making it the biggest exporter in the country (CONAB, 2017a). That is slightly more than the $26.6\%$ that is the combined production of the two most important producers in the US: Illinois $(13.8\%)$ and Iowa $(12.8\%)$ (USDA, 2018b). Moreover, in these two countries, the largest producing states are also the farthest from the EDP, with an average distance of about $2,000~\mathrm{km}$. to the EDP (IBGE, 2017; USDA, 2018c).
Both in the US and Brazil, the largest producing region is the Midwest (CNA, 2012; CONAB, 2017a; USDA, 2018b), and China is the leading destination of exported soybeans, having Shanghai as the port of reference (Salin, 2014; USDA, 2018a). Therefore, both the US and Brazil, the main producing regions, require a logistics effort to transport the grains from the farms in the country's interior to China, often involving a complex combination of various factors that influence the grain's competitiveness.
## iii. Transportation Modes
Ballou (1993) defines transportation modes as "the modes of transport" that move people and cargo
and can include intangibles. He listed five basic transportation modes that move most of the cargo: air, rail, road, water, and pipelines. When more than one transportation mode is used to integrate the services, it is defined as multimodal.
Soybeans can be moved from the farms to the EDP using the road, rail, and water transportation modes. However, of these three, road transportation will necessarily have to be used, independently of the other mode options or combinations, to move the grains from the farm to the point where it is loaded onto the preferred mode. The physical structure where the grain is passed from one transportation mode to another is called a terminal or transshipment facility (TF), and typically for grains, transfer the products from the road to rail or to inland water transportation modes.
The US soybean exports modal share is quite different from that of Brazil, indicating a clear preference in the US for inland waterways, with $42\%$ of the US exports favouring inland waterways, $29\%$ each using rail
and road in 2016 (USDAAMS, 2017). In the same year in Brazil, road transportation accounts for $52\%$ of the modal share, rail for $38\%$, and only $10\%$ using inland waterways (CONAB, 2017b; MTPA, 2017).
Inland waterway transportation is the best cost option to transport low-value commodities such as
soybeans due to its capacity to transport large quantities in barge tows (a set of barges and a towboat), as can be noted in Figure 1 below, extracted from a presentation published in 2018 by the Illinois State Freight Advisory Council (ISFAC):
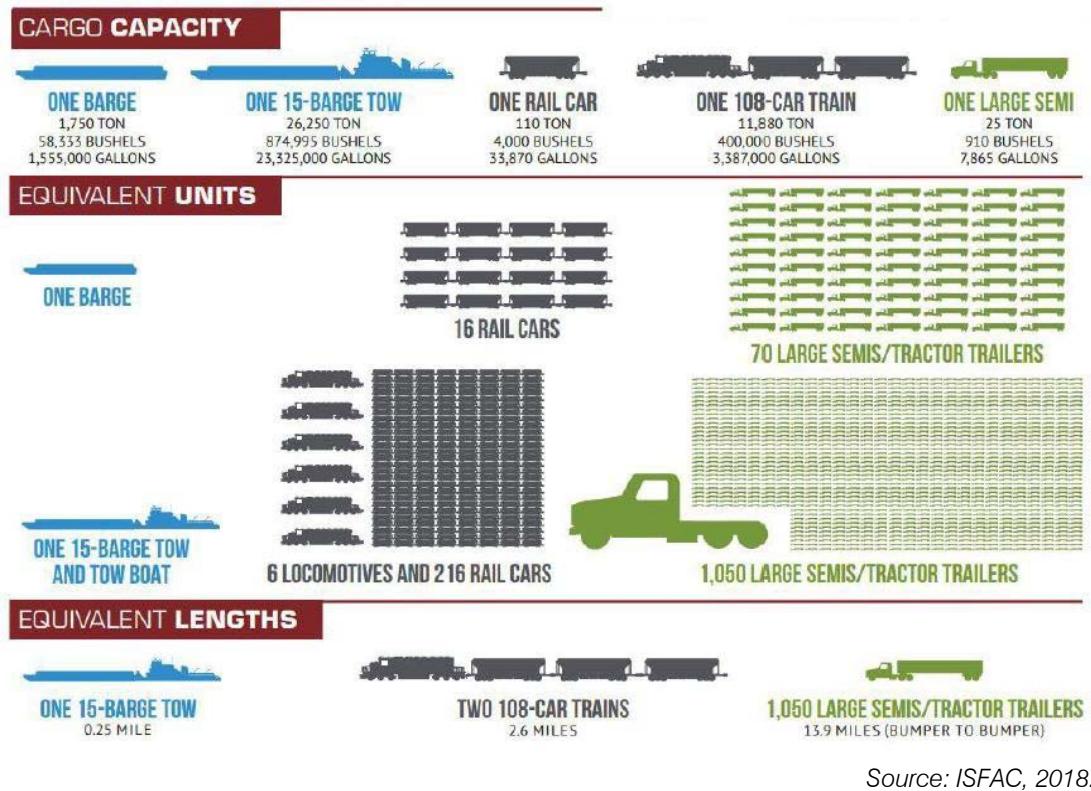 Figure 1: Comparison of capacities, equivalent units and equivalent lengths of different types of transportation modes used to transport grains from Illinois to EDP in the US Gulf of Mexico
Additionally, the ISFAC presentation not only indicates the cost effectiveness of using barge tows to transport grains on inland waterways compared to rail and road transportation modes in the US, but also highlights various positive environmental factors related to inland waterway transportation using barge tows. The major factor is the carbon footprint, related to the emissions of carbon dioxide $\left(\mathrm{CO}_{2}\right)$ in the atmosphere, which is comparatively $89.9\%$ lower than road and $26.4\%$ lower than rail transportation (ISFAC, 2018). Another study about $\mathrm{CO}_{2}$ emissions, based on transportation of chemicals in Europe, corroborates the
ISFAC findings, by identifying that short sea bulk transport, which is similar in characteristics to inland waterway transportation, with emissions $74.2\%$ lower than road transport (McKinnon and Piecyk, 2010).
Other important numbers related to comparisons of transport modes and their environmental impacts, are fuel efficiency, spills of hazardous materials, and fatalities. In all three impacts, the use of inland waterway transportation has a favourable impact when compared to the other transport modes typically used for bulk transportation, as can be noted in Table 2 below:
Table 2: Comparison of different environmental impacts in major bulk transportation modes
<table><tr><td>Freight Transportation Mode</td><td>Energy efficiencyton-miles travelled perUS gallon of fuel</td><td>Hazardous materialsspillsComparative ratio offatalities</td><td>Fatality recordUS gallons spilled perone million ton-miles</td></tr><tr><td>Inland Waterway Transportation (barge tows)</td><td>647</td><td>1</td><td>2.12</td></tr><tr><td>Rail Transportation</td><td>477</td><td>22</td><td>5.95</td></tr><tr><td>Road Transportation</td><td>145</td><td>79</td><td>6.04</td></tr></table>
When referring to ports, it must be considered that there are a variety of port facilities with different characteristics and functions. This paper only focuses on TF, and EDP, both on the Amazon River and along the Brazilian coast.
## iv. Logistics Costs
There are a variety of services available to transport users based on the five basic transportation modes, which can be used individually or combined. Ballou (1993) explains that among the available alternatives, the taker of transportation services should choose the service or combination of services that offers the optimum balance between costs and service quality, indicating that four criteria are fundamental: costs, delivery times, transit time, and damages or losses of the product being transported.
Due to its attributes as a commodity, when choosing transportation modes, the cost criterion is
generally the single most influential factor for soybeans, based on the main transportation modal choice criteria listed by Ballou (1993), with the lowest cost and theft and damages for the three typical transportation modes for soybeans, despite being the slowest.
Considering that road transport is the most expensive option of the transport mode choices to move soybeans in large quantities, multimodal transportation is possibly the best option to reduce the farm to port costs.
Comparing the US farm to port costs with those of MT, it is noticeable that MT's costs are considerably higher than those of the US Midwest, while the transport costs from the EDP in Brazil and the US to China have lower differences which are not that relevant (Salin, 2019), as can be observed in Table 3.
Table 3: Cost Comparison in US$ per ton from Different Regions of the US Midwest and the Centre-north of MT to Shanghai, China, in the 4th quarter of 2018
<table><tr><td colspan="8">Origin</td></tr><tr><td>Country</td><td>USA</td><td>USA</td><td>USA</td><td>USA</td><td>USA (average)</td><td>Brazil</td><td>comparison (%)</td></tr><tr><td>Region</td><td>Minneapolis/MN</td><td>Davenport/IA</td><td>Fargo/ND</td><td>Sioux Falls/SD</td><td>northern MT</td><td>centre-north MT</td><td></td></tr><tr><td>Exporting Port Region</td><td>U.S. Gulf of Mexico</td><td>U.S. Gulf of Mexico</td><td>U.S. Pacific Northwest</td><td>U.S. Pacific Northwest</td><td>Santos</td><td>vs. average USA</td><td></td></tr><tr><td colspan="8">Costs (USD/Ton)</td></tr><tr><td>Farm value</td><td>312.08</td><td>313.55</td><td>299.83</td><td>294.81</td><td>305.07</td><td>312.04</td><td>2.3%</td></tr><tr><td>Truck</td><td>12.10</td><td>12.10</td><td>12.10</td><td>12.10</td><td>12.10</td><td>28.68</td><td>137.0%</td></tr><tr><td>Barge/Rail</td><td>31.66</td><td>24,28</td><td>56.11</td><td>57.10</td><td>42.29</td><td>48.63</td><td>15.0%</td></tr><tr><td>Total farm to port transportation costs</td><td>43.76</td><td>36.38</td><td>68.21</td><td>69.20</td><td>54.39</td><td>77.31</td><td>42,1%</td></tr><tr><td>Maritime transport costs</td><td>47.52</td><td>47.52</td><td>25.97</td><td>25.97</td><td>36.75</td><td>30.00</td><td>-18.4%</td></tr><tr><td>Total transportation costs</td><td>91.28</td><td>83.90</td><td>94.18</td><td>95.17</td><td>91.13</td><td>107.31</td><td>17.8%</td></tr><tr><td>Total landed cost in Shanghai,</td><td>403.36</td><td>397.45</td><td>394.01</td><td>389.98</td><td>396.20</td><td>419.36</td><td>5.8%</td></tr><tr><td colspan="8">Proportion of Costs (%)</td></tr><tr><td>Farm to port/Total transport costs</td><td>47.9%</td><td>43.4%</td><td>72.4%</td><td>72.7%</td><td>59.7%</td><td>72.0%</td><td></td></tr><tr><td>Maritime transport costs/Total transport costs</td><td>11.8%</td><td>12.0%</td><td>6.6%</td><td>6.7%</td><td>9.3%</td><td>7.2%</td><td></td></tr><tr><td>Farm to port/Total landed costs</td><td>10.8%</td><td>9.2%</td><td>17.3%</td><td>17.7%</td><td>13.7%</td><td>18.4%</td><td></td></tr><tr><td>Farm value/Total landed cost</td><td>77.4%</td><td>78.9%</td><td>76.1%</td><td>75.6%</td><td>77.0%</td><td>74.4%</td><td></td></tr></table>
Therefore, to be competitive, the production costs of soybeans in MT necessarily have to be lower for the total landed cost in Shanghai to be able to compete with the US soybeans. While the average farm to port costs represents $13.7\%$ of the total landed costs of US soybeans in Shanghai, in the case of the Brazilian soybeans from MT, it is $18.4\%$.
## v. Transport Corridors
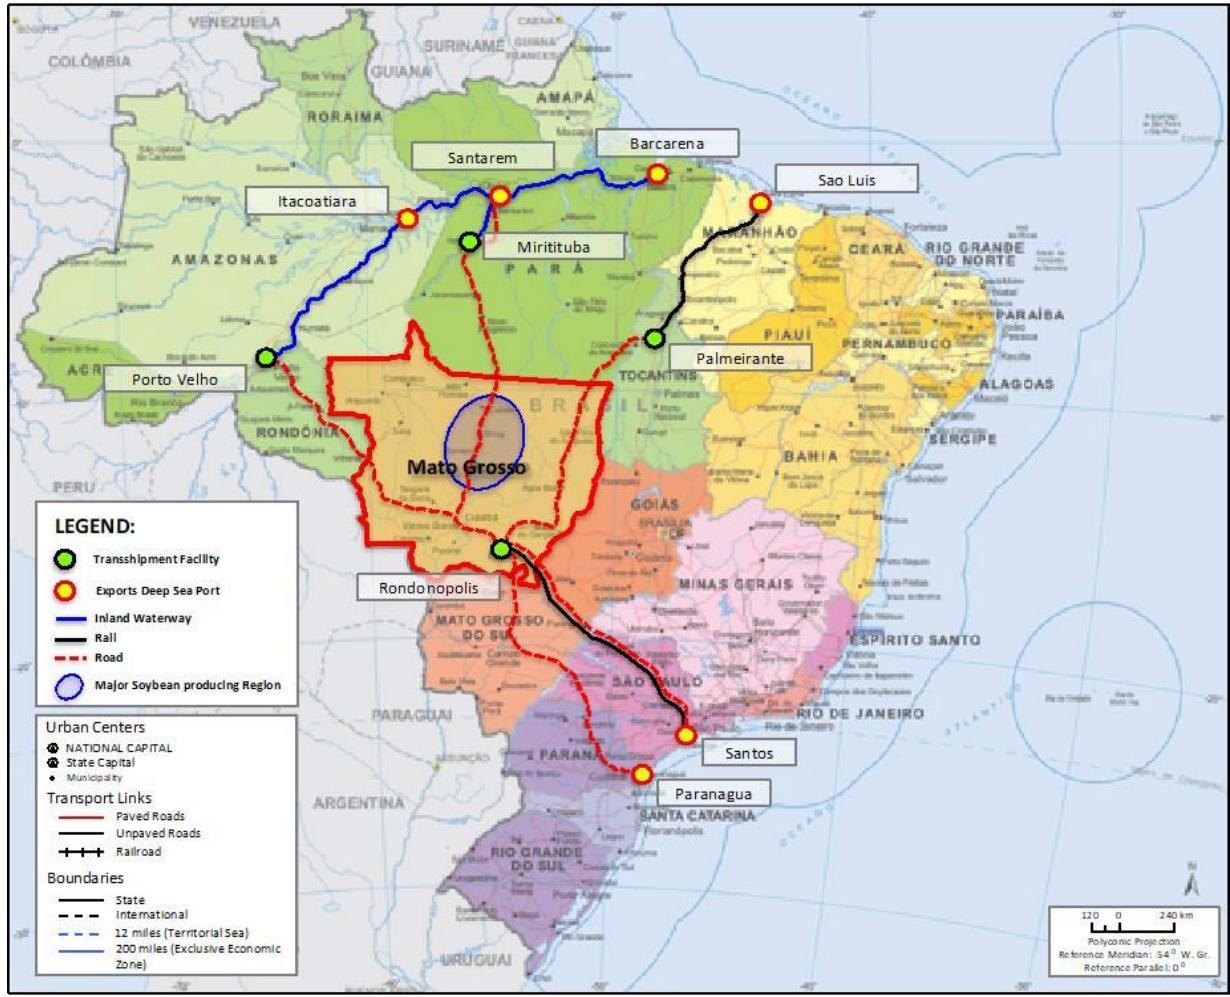
MT's most significant soybean production is in the macro-region of the Medium-North (IMEA, 2017), which was responsible for $35\%$ of the production in 2017, and Sorriso the most prominent single municipality producing 2.16 million tons of the grain
(IBGE, 2018a). The road distance from Sorriso to the nearest EDP is more than $2,000 \mathrm{~km}$, or about $600 \mathrm{~km}$ to the TF of Rondonópolis, in MT, where the soybeans can switch to rail to reach the EDP of Santos. The other ports of the south and southeast of Brazil, collectively known as the "Southern Arc" ports, are more distant. The other export option is using the "Northern Arc" ports, which are EDP along the Amazon River and the coast of Brazil's northeastern region. Besides the river ports of the Amazon River, Itaqui is the only coastal port with relevant soybeans exports in the Northern Arc, which can be reached by road or rail. Most river ports that can handle deep-sea Panamax class ships on the
Amazon require multimodal transport solutions, as they are all reached by inland waterway transport on barges (Rubio and Kirkpatrick, 2017). These exporting river ports are reached using TF at the first navigable points of the Madeira and Tapajós rivers, where the grains change transportation mode from the road to the inland waterways. In the case of Itaqui, the distance from Sorriso is more than $2,300\mathrm{km}$, and therefore, the soybeans are transhipped to the rail after travelling about $1,500 \mathrm{~km}$ by road to Palmeirante, with the rest of the distance covered by rail. It is possible to use different routes from MT to reach the EDP, as can be observed on the map below (Figure 2), which indicates the most used transport corridors, responsible for $92.9\%$ of the soybean exports of MT in 2017 (IMEA, 2018b).
 Figure 2: Map of Brazil Indicating the Main Transport Corridors of Soybean Exports from MT to EDP used in 2018
Source: IBGE, 2018b; IMEA, 2018b; Lopes et al., 2017; Salin, 2014; USDA, 2018b.
## III. METHODOLOGY
Based on the criteria of basic scientific research designs, this research is a case study, as its focus is related to the study of contemporary phenomena inserted in the context of reality (Easterbrook et al., 2008; Prodanov and Freitas, 2013), and uses an empirical quantitative approach. A large variety of secondary data, reports, and presentations were collected using official sources and government agencies, but also literature, institutional reports, academic articles, and articles in the press regarding logistics, transport costs and agricultural commodities were used in this research. Esterbrook et al. (2008) cite that "A variety of different data sources are typically used in case study research", which is the base of this research to obtain the most data and information available on the specific topics of this paper. The case study approach was also chosen, with the intent of producing results as close to reality as possible, given the availability of the specific secondary data needed.
The Sensitivity Analysis (SA) method was applied to evaluate how the model reacts to changes with its variables, and the focus based specifically on costs. Due to the low product differentiation of soybeans, as they are a commodity, the logistics cost is critical to competitiveness. As the major cost difference between the soybeans exported from MT and its main competitor in the US Midwest is related to farm to port costs, the SA of this research was limited to evaluating these logistics cost. SA is a valuable methodology for diverse quantitative operations research (Borgonovo and Plischke, 2016). There are various categories of SA and is defined by Ferretti, Saltelli and Tarantola (2016) as "critical to gauge the relevance and plausibility of models". In this paper, we applied the SA method known as one-at-a-time (OAT), which means observing changes to the model, applying one change to a variable and its outcome to the model after the single change, and all other variables are maintained unaltered (Ferretti et al., 2016). After determining the base case with the LC choice, additional SA was performed on the road transport costs, which are the most relevant in the model, to analyse its impact when this specific cost changes. The OAT method has limitations, as it only
manages to identify how one specific variable interacts with the model, being unable to capture more complex interactions between them in a system. However, as the focus of this research was based on the costs of different transport modes, we understand that the limitations do not have a significant impact on the outcome.
As a premise to construct the farm to port transport cost model, the total transport costs from the farm gate in MT to the port of Shanghai, considered the origin (O) and destination (D), respectively, were determined for each of the eight main transport corridors to export soybeans from MT, as shown in Figure 3 below:
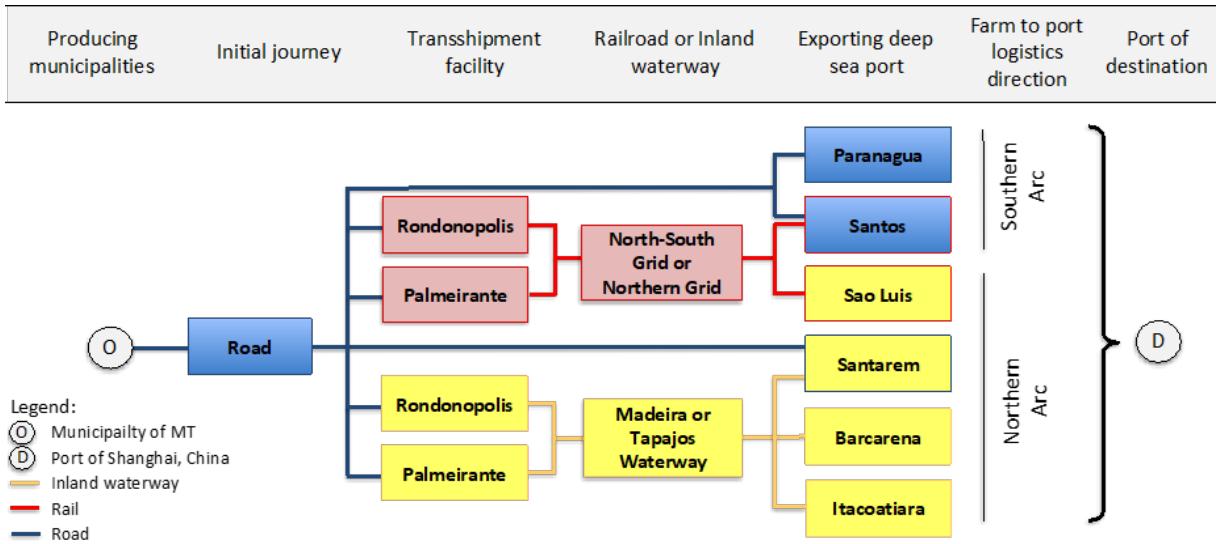 Source: Prepared by the authors Figure 3: Model of the Main Soybeans Exporting Transport Corridors from MT to Shanghai For these routes, the costs of all the different transport modes and that of the TF were added, obtaining the total logistics cost from the origin of each municipality in MT to the final destination port in Shanghai, allowing for a cost comparison for every option and selection of the LC transport corridor. With the definition of these premises, a matrix of the routes from each municipality of MT was elaborated, and the total logistics cost to the destination was calculated, generating a base case scenario with the sum of the total LC transport corridors of each municipality weighted with the proportional production volumes. These values were compared with the reports published by the USDA on the transport costs of soybeans, validating the model.
The transport costs of each transport mode were obtained using reference values of the third quarter of 2018. For values of prior periods, a monetary correction of the Brazilian currency was applied using the currency variation with the USD (Amorim; Lopes, 2017; CONAB, 2019; Dartora, 2015; FreteBras, 2018;
IMEA, 2019b, 2018b; USDA, 2019, 2018a). To eliminate currency variations and permit comparisons with other studies, the model was elaborated in USD.
The individual costs used to model the base case for each of the 50 municipalities and eight transport corridors are: road, rail, inland waterway, TF, exporting port service costs, and the maritime shipping costs, resulting in 400 total landed cost alternatives in USD, per metric ton. After calculating the cost for each of the eight corridors, the LC total transport combination for each municipality in MT to Shanghai was chosen, and the transport mode or combination of transport modes was identified, together with the direction as to whether the preferred option should be the Northern or Southern Arc.
The premises for the model simulating each transport mode available are the following:
### a) Origin
Of the 141 municipalities of MT, only 119 produced soybeans in 2017, and of these, 50 produced $89.4\%$ of the state's soybeans in that year. Therefore, this case study was limited to the 50 largest producing municipalities in 2017 (IBGE, 2018a).
### b) Destination
For this case study's simulations, the port of Shanghai in China was considered the only final destination, as was the case in many other studies, including formal studies of the USDA (Salin, 2014; USDA, 2018a).
### c) Export Corridors
The model simulations were limited to the most significant export corridors from MT to the six most-used EDP. Two of these ports can be reached by different transport modes (IMEA, 2018a), resulting in eight different corridors (Table 4). These corridors are grouped into the two specific farm to port logistics directions in Brazil: the Northern and Southern Arcs.
Table 4: Major Export Corridors from the Top Soybean-Producing Municipalities in MT and their Transport Modes, Transshipment Centres and EDP to Shanghai
<table><tr><td>#</td><td>Origin</td><td>Transport mode(s)</td><td>Transshipment facilities</td><td>Exporting deep sea port</td><td>Port of destination</td><td>Farm to port logistics direction</td></tr><tr><td>1</td><td rowspan="8">Top 50 producing municipalities of MT</td><td>road/inland waterway</td><td>Porto Velho</td><td>Itacoatiara</td><td rowspan="8">Shanghai, China</td><td rowspan="5">Northern Arc</td></tr><tr><td>2</td><td>road/inland waterway</td><td>Miritituba</td><td>Santarem</td></tr><tr><td>3</td><td>road</td><td>-</td><td>Santarem</td></tr><tr><td>4</td><td>road/inland waterway</td><td>Miritituba</td><td>Barcarena</td></tr><tr><td>5</td><td>road/rail</td><td>Palmeirante</td><td>Sao Luis</td></tr><tr><td>6</td><td>road/rail</td><td>Rondonopolis</td><td>Santos</td><td rowspan="3">Southern Arc</td></tr><tr><td>7</td><td>road</td><td>-</td><td>Santos</td></tr><tr><td>8</td><td>road</td><td>-</td><td>Paranagua</td></tr></table>
### d) Road Transport
The transport costs for the road transport mode were obtained using 82 transport values for grains transported from MT to port or TF in October 2018 (CONAB, 2019; FreteBras, 2018; IMEA, 2019b). The secondary data used, was based on real freight costs charged by transporting companies and individuals, specifically related to bulk grain transport, to ensure a reliable dataset, and mitigate potential biases to the costs. FreteBras is an online marketplace where prices are published for individual transport demands, and CONAB and IMEA are institutes that are linked to agricultural research and statistics funded by the public sector. All three sources provide reliable data regarding transport costs. A more abundant, but also more generic dataset of freight values would have included other types of cargo, such as general cargo, cement, and bulk liquids, which have different freight values and logistic requirements, and would therefore risk alterations to the transport costs. By limiting the data to consider only bulk grain transport value, we were mitigating potential alterations to the transport costs. Furthermore, the time span necessarily needs to be limited, not to be influenced by external factors like changes in fuel prices, or changes to transport availability caused by seasonal impacts, such as the start of a different crop competing for transport availability.
Linear regression was applied to validate the data quality, comparing the distance travelled with the freight rates, obtaining a total $R^2$ value of 0.6685, which prompted further analysis into the road freight values, as their impact on the total domestic freight is by far the most relevant single cost factor, representing $69.3\%$ of the total farm to port transport costs in the base case.
It should be noted that the road transport costs from MT to the north using the federal highway BR-163 to Miritituba and Santarém was higher than the other road transportation costs relative to the distance travelled. The main reason is attributed to the precarious conditions of the federal highway within the state of Pará at the time, with vast stretches unpaved and muddy in the rainy season (Patroni, 2019), and little prospects of return freight (Souza, 2018). On the other hand, the northbound federal highway BR-364 to Porto Velho has comparatively less cargo transported to the sparsely populated states of Rondonia and Acre, is well paved and has no tolls. The southbound highways are well paved but bear most of the movement of all kinds of products and are all tolled. This provoked the stratification of the road freight values to be analysed in three distinct groups, depending on the route: northbound to Porto Velho, northbound to Miritituba and Santarém, and all other destinations. After evaluating the $R^2$ results of the three distinct linear regressions with better regression prediction fits, they were then used in the model, as can be observed in Figure 4 below.
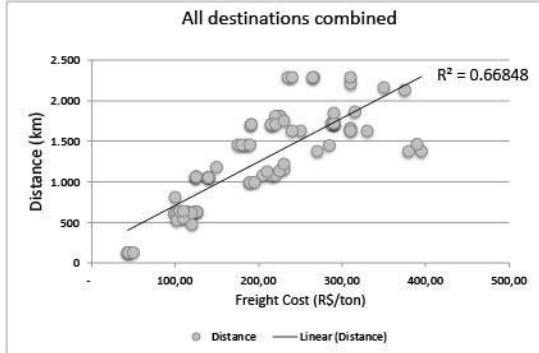
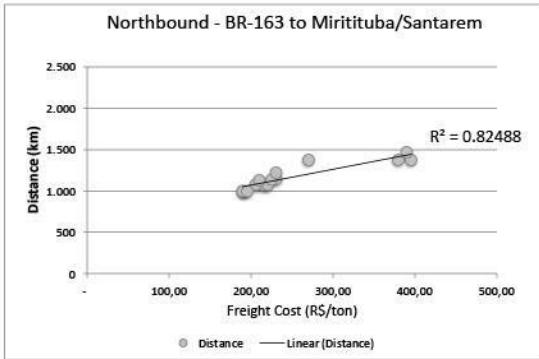
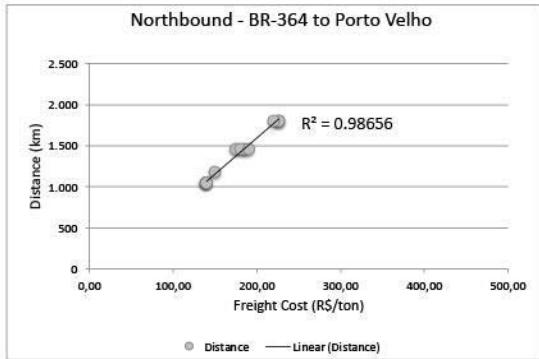
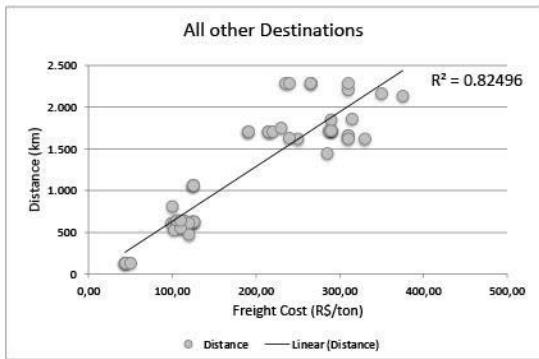 Figure 4: Linear Regression Applied to Road Freight Costs According to Destination Groups
Source: Prepared by the authors
### e) Variables not Simulated
## i. Time
This case study did not consider the impact of time on the total logistics as an appropriate variable, as soybeans are a commodity where cost variables are much more relevant in the global competition scenario (Pereira, 2009).
ii. TF Facility Costs and Service Costs between Different Transport Modes from Farm to Port and at the EDP
The TF costs are not significant compared to the total transport costs and were therefore all considered the same, based on research published by Amorim and Lopes (2017).
Considering that the maritime transport costs from the various Brazilian EDP to Shanghai are relatively similar to that of the US ports (Table 3), variations in the marine transport costs were not simulated in the model. Applying the same concept, variations in the TF costs were also not applied to the model, as they do not bear relevance to the total transport costs.
It is also important to note, that the TF of the transport corridors studied, are all private sector facilities, and do not publish their service charges. Most are factored in the costs of a larger logistics solution, such as the TF where grains are transferred from road to rail, where the actual TF cost is included in the total rail costs, and therefore difficult to obtain.
## iii. Capacity Constraints
For this study, capacity constraints were not considered, as the objective is to model a base case determining the optimum choice available to each producer. This resulted in the identification of the most competitive export transport corridor from each municipality in MT.
## iv. Environmental Factors
For this study, environmental factors were not directly considered, though the comparative differences of the environmental impacts of the different transport modes was discussed.
Brazil is a member of the Conference of Parties (COP) meetings, coordinated by the United Nations Framework Convention on Climate Change (UNFCCC), which aims to stabilize greenhouse gas concentrations in the atmosphere, and limit global average temperature rise this century to 1.5 degrees Celsius above preindustrial levels. One of the major factors that impact the greenhouse gas concentrations, are $\mathrm{CO}_{2}$ emissions (UNFCCC, 2024). At the COP26 conference held in Glasgow, Scotland, Brazil pledged to reduce the $\mathrm{CO}_{2}$ emissions by $50\%$ until 2030 (BRASIL, 2022), an later, in the 78th United Nations General Assembly held in September 2023, increased the pledge from $50\%$ to $53\%$ (Agência Gov, 2023). The direct impact on transport directives, are targeted at the diesel oil (fossil fuel) composition used by road transportation. After a brief period of trials between 2005 and 2007, where $2\%$ of non-fossil fuel was added to the fossil fuel, the mixture became mandatory in January 2008. In March 2021, the mixture was increased to $13\%$, and the percentage adjusted various times that year until finalizing at $10\%$ in November. Then it was adjusted to
12% in April 2023, and to 14% in March 2024 and is expected to reach 15% in 2025. The mixture is aimed at reducing $\mathrm{CO}_{2}$ emissions, and has been adjusted gradually to allow industry and users to adjust (ANP, 2024).
However, the impact of adding non-fossil fuel to diesel oil, called biodiesel in Brazil, is not as positive as changing transport modes. A $50\%$ biodiesel mixture, consisting of $50\%$ non-fossil fuel and $50\%$ diesel oil, would only mitigate about $4\%$ of the emissions, and $100\%$ non-fossil biodiesel would effectively only mitigate $8.71\%$ of the emissions (Bartholomeu, Daniela Bacchi; Pera, Thiago Guilherme; Caixeta-Filho, 2015).
The addition of non-fossil fuel to diesel oil, has also generated controversy in the transport sector. There are claims that, adding a greater percentage of non-fossil fuel to the diesel oil, demands new engine technology and also reduces the engine efficiency, as pointed out by a study of the University of Brasília, which states that there is a double cost impact, as the newer engine technology is costlier, and the lower efficiency will demand more fuel consumption (Feltrin, 2023). This is also corroborated by declarations made by the Brazilian National Confederation of Transport (CNT), who state that the addition of non-fossil fuels will increase the cost of the biodiesel, which in turn will increase freight costs. The CNT also note that increasing the percentage of non-fossil fuel will not help the environment, due to the lower engine efficiency (Canal Rural, 2023). It is therefore a controversial topic, and there are not enough studies to indicate the benefits of adding non-fossil fuel to diesel oil, or if there is an ideal mix that obtains the best results.
## IV. RESULTS AND DISCUSSIONS
The results are detailed and subdivided below for a more coherent comprehension of the findings.
# a) The LC Option to Export Soybeans
The base case was modelled simulating 400 possible transport combinations for the 50 municipalities of the research scope. As detailed in Figure 3, there are eight main transport corridors for the farm to port logistics. By considering each possible transport corridor for each of the 50 municipalities, the result was 400 possible combinations, mitigating any bias by excluding unlikely combinations. The result indicated that $68.4\%$ of the production should use the Northern Arc's EDP of Itacoatiara and Santarém on the Amazon River and that this LC transport corridor choice was the optimal choice for 30 of the 50 municipalities of MT modelled. Of the two possible transport options from MT to Santarém, the multimodal transport option using road transport to Miritituba and then switching to inland waterways to the port of Santarem is the LC option, compared to using only the road transport option. The remaining $31.6\%$ of the soybeans destined for exports had the EDP of Santos, on Brazil's southeastern coast, as the LC port destination in the Southern Arc. Of these 20 municipalities of MT, 13 (61.1%) should use the multimodal transport option of road and rail using the TF to rail at Rondonópolis for the most competitive farm to port transport costs. In contrast, the other 7 (38.9%) should opt solely for road transport. Therefore, only 12.3% of the soybeans exported from the 50 largest producing municipalities of MT should opt exclusively for the road transport mode from farm to port, while the absolute majority, 87.7%, should opt for multimodal transport. Combining road transport with inland waterway transport should be the choice for 68.4% of the volume of exported soybeans, followed by the combination of road with rail transport for the remaining 19.3% of the volumes, represented in Figure 5, which also indicates the optimal balance between the Northern and Southern Arc export corridors. Figure 6 indicates the micro-regions that are encompassed by the balance of the LC transport modes and corridors. Additionally, the names of the individual micro-regions and the respective LC transport mode is detailed in Annex A.
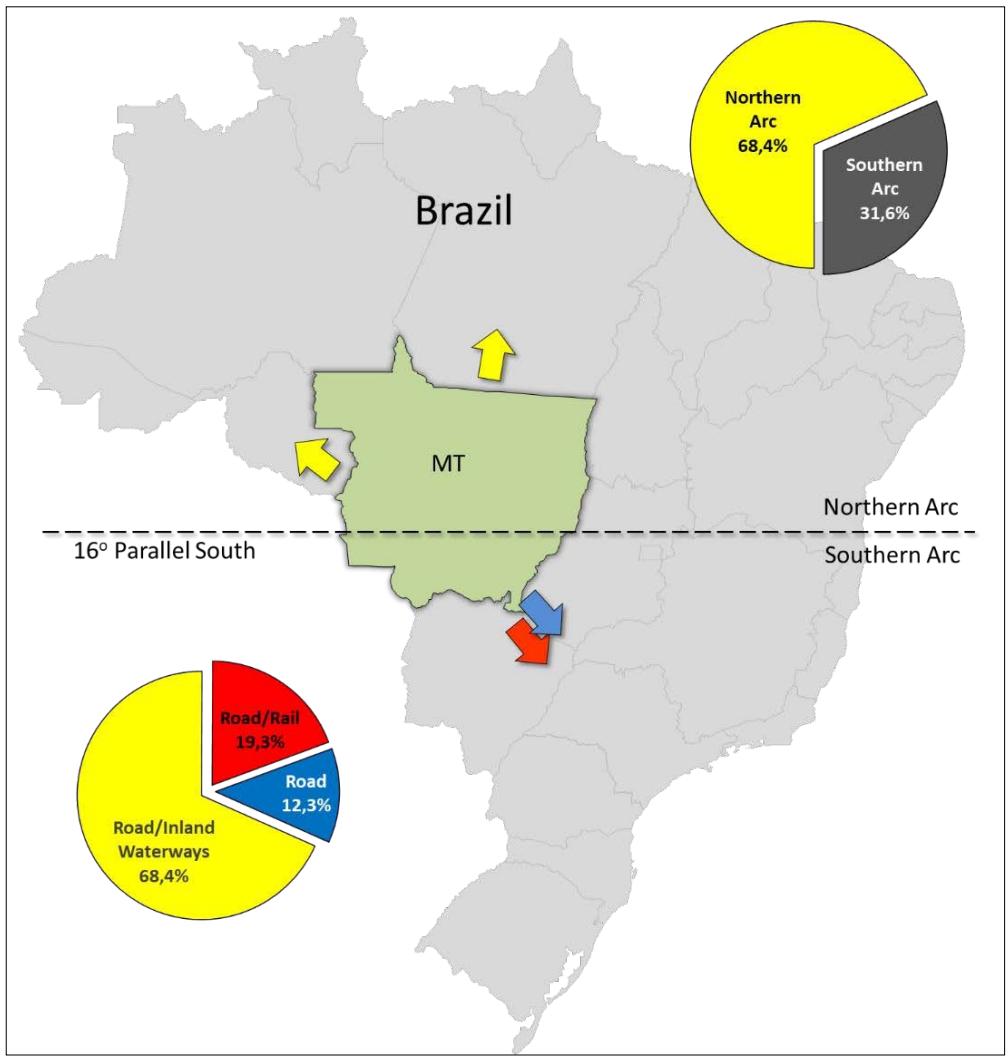 Source: Prepared by the authors Figure 5: Representation of the simulation results of the total logistics costs and the optimal LC choice by Arc and Transport Mode
Not only does the appropriate use of the LC transport corridor directly reduce the farm to port costs for the producer, as it also increases efficiency in balancing a more adequate use of infrastructure. The Southern Arc corridors are burdened by other cargoes, and already at their limits in many cases. Policy makers have been aware of this burden and launched studies to privatize roads and make new public concessions for railroad infrastructure. In aiding competitiveness by stimulating the ideal transport corridors and modes, policymakers can not only reduce the farm to port costs, but also reduce unnecessary use of southbound corridors while at the same time reduce $\mathrm{CO}_{2}$ emissions resulting from the use of multimodal transport including inland waterways. Projects related to improving road access to the TF in the Northern Arc, and addressing restrictions on the inland waterways, also help making the Northern Arc a more competitive and reliable logistics option. Currently, the federal government is invested in launching the first public concession of an inland waterway, notably the Madeira River, which would directly impact some of the issues related to barge tows during the low water season. Currently, none of the Amazon Basin's rivers are managed by public authorities to prevent limitations during the dry season, when the water levels naturally drop by as much as 17 metres from the high-water levels, reducing the size of barge tows and the volumes normally transported, and even interrupting the transportation for weeks in years of severe drought, as in 2023 and 2024. If successful, the public concession model could be expanded to other inland waterways and enhance competitiveness by guaranteeing a minimum draught and size of barge tows throughout the year (INFRA, 2024).
### b) Border Definition of the LC Transport Mode Choices
Plotting the LC transport options of the base case from the 50 largest producing municipalities of MT to the EDP on the political map with the individual municipalities (IMEA, 2019c), identified the boundary between the Northern and Southern Arc, clearly indicating the optimal transport direction (Figure 6), as well as the transport mode or combination of modes
that each municipalities' producer should favour to obtain the LC farm to port transport costs.
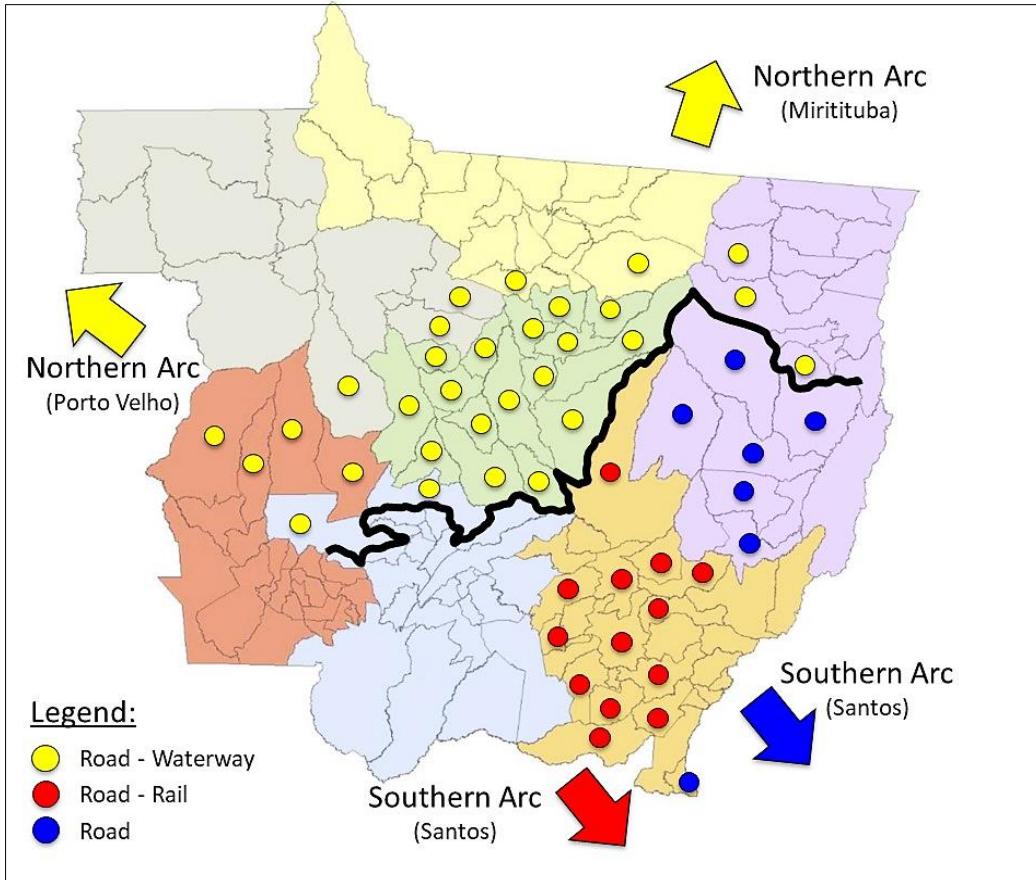 Source: Prepared by the authors, adapted from IMEA, 2019c. Figure 6: Illustrative Map Indicating the LC Choice Transport Direction and Optimal Modal Choice of the 50 Largest Soybean Producing Municipalities in the Macro Regions of MT
### c) Road Transport Costs SA
After simulating the base case, a SA with the road transport costs was applied, as this specific transport mode's costs represent $69.3\%$ of the total farm to port transport costs, making it the single most relevant cost factor. The results shown in Table 5 indicate that the total costs vary relatively little, with a $20\%$ cost reduction, increasing the share from $69.3\%$ to $71.0\%$ of the total farm to port transport costs, and increasing transport costs by $20\%$ impacts the model, reducing the share to $61.8\%$, indicating a certain resiliency. Comparing the same SA exclusively for the Northern Arc, a reduction in road transport costs of $20\%$ only increases its share from $77.0\%$ in the base case to $78.3\%$. An increase in costs by $20\%$ reduces the share to $73.7\%$, again implying a relative resilience to the border between the Northern and Southern Arc's influence regions. However, analysing the SA of the Southern Arc transport costs, road transport cost variations have a more pronounced impact, ranging from $53.6\%$ in the base case to $65.5\%$ with a $20\%$ road transport cost reduction, increasing the share, and suffering a more accentuated reduction in share to $32.1\%$ when the road transport costs increase by $20\%$.
The analysis indicates that a change in road transport costs will not impact the Northern Arc bound soybeans using inland waterways to reach the EDP as much, increasing the volume of soybeans by a mere $1.2\%$ compared to the base case with a $20\%$ road transport cost reduction, or a shift from 30 municipalities to 31 that should opt for the Northern Arc as their LC export choice. On the other hand, an increase in $20\%$ of the road transport costs will cause a reduction of $5.7\%$ in the volume that should prefer the Northern Arc, and the total amount of municipalities to reduce from 30 to 29. Hence, even relatively large fluctuations in road transport costs, which are the most relevant cost factors in the LC transport choices available, do not cause significant changes in the boundary between the Northern Arc and Southern Arc. The competitiveness of the inland waterway transport costs compared to the road transport costs, which are $67.7\%$ lower than the southbound road transport costs, maintain the border between the Northern and Southern Arc relatively unchanged.
The more significant variation in this SA on the Southern Arc is due to direct competition between road and rail to the southbound EDP. In the base case, 7 of the 20 municipalities should prefer road and 13 rail as the LC transport. When the road transport costs increase by $20\%$, only one of the 21 municipalities remains competitive by road, that should opt for the
Southern Arc, and with a decrease of $20\%$ in the road transport costs, 11 of the 19 municipalities should opt for the road as the LC transport choice.
Table 5: SA of the proportion of total road transport costs compared to the total farm to port transport costs of the model for the 2017 production of soybeans of the top 50 municipalities in MT
<table><tr><td>Farm to Port logistics direction</td><td>-20%</td><td>Base Case</td><td>20%</td></tr><tr><td>Northern Arc</td><td>78,3%</td><td>77,0%</td><td>73,7%</td></tr><tr><td>Southern Arc</td><td>65,5%</td><td>53,6%</td><td>32,1%</td></tr><tr><td>Total</td><td>71,0%</td><td>69,3%</td><td>61,8%</td></tr></table>
Source: Prepared by the authors
The outcome indicates that changes to the road transportation costs, such as an increase in fuel prices or tolls, will not materially impact the Northern Arc bound soybeans as much as the Southern Arc destinations. For stakeholders, the information obtained points at the need to be vigilant – if the road transportation costs are impacted by increases, the southbound soybeans will require studies to compare the farm to port costs with northbound costs and evaluate if the option that once seemed viable remains competitive. Policymakers should also be aware of the sensibility of the southbound soybeans related to road transportation costs and the competitiveness of Brazil's number one export product. Changes to toll strategies on roads or fuel price policies can have an impact on competitiveness, or if the increases favour a shift from southbound to northbound farm to port logistics, could pose new challenges to the infrastructure to handle larger volumes.
Public and private sector stakeholders can also evaluate, if a shift from the Southern Arc to the Northern Arc EDP and hence favouring the use of inland waterways, has a trade-off that is not directly attributed to the farm to port costs, but has the benefit of a relevant environmental factor with reductions in $\mathrm{CO}_{2}$ emissions. Depending on the final customer of the exported produce, of company policies of the private sector stakeholders, or public policies, stimulating the shift from southbound to northbound farm to port logistics may be in the interest of the parties involved.
Multimodal transportation not only reduces $\mathrm{CO}_{2}$ emissions, even though less when combining road with railroad transportation as opposed to road with inland waterway transportation, with rail transportation emitting $86.3\%$ less $\mathrm{CO}_{2}$ than road transportation, and inland waterways $89.9\%$ less, but also reduces the necessity of more roadworks and urban mobility issues along the highways and in the port cities of the EDP. The ports of the Southern Arc are mostly ports that have developed in urban areas, which have grown as much or more than the ports, unlike the ports of the Northern Arc, mostly served by inland waterways to export soybeans. The multimodal choice reduces the necessity of road transportation within the urban centres, as both railways, or barge tows, have routes that do not impact the urban mobility of the cities and transport the cargo directly to the EDP. By stimulating the use of multimodal transportation, urban mobility issues of port cities are mostly bypassed, and the need of expensive infrastructure solutions avoided.
The increase of using multimodal transportation is also in line with the US, that has a share of $71\%$ using inland waterways and rail transportation (USDA-AMS, 2017), and an important factor of its farm to port competitiveness.
## V. CONCLUSION, LIMITATIONS, AND FUTURE RESEARCH DIRECTIONS
The results of this paper confirmed that using inland waterways to transport commodities such as soybeans is the LC transport option from farm to port. At current transport costs, the inland waterway transport costs in USD per kilometre per ton (USD/km/ton) is a significant $55.6\%$ lower than rail, and $67.7\%$ lower than road transportation, leaving no doubt as to its importance in reducing the total transport costs and improving the competitiveness of the exported grains, similar to observations of other articles.
With present transport costs to export soybeans produced in MT, the largest soybean producing state in Brazil and responsible for $28.2\%$ of the country's exports, the LC scenario of the base case should export $68.4\%$ of the soybeans through the Northern Arc, favouring the north-bound road network from the producing municipalities to the TF in Porto Velho or Miritituba, where the grain is transferred to barges that carry the journey onward on the inland waterways to the EDP of the Northern Arc. The remaining $31.6\%$ should head to the Southern Arc EDP, with $61.1\%$ using the multimodal combination of road and rail, and the remaining $38.9\%$ relying solely on road transportation. Therefore, the optimal balance of EDP between the
Northern Arc and the Southern Arc would be a shift from the current $45.2\%$ of MT's soybeans using the Northern Arc to $68.4\%$.
30 of the 50 top soybean-producing municipalities located in the central and northern region of MT should export using the Northern Arc multimodal transport corridors, determining a clear and resilient border with the remaining 20 municipalities opting for the transport corridors of the Southern Arc to export the commodity, as depicted in Figure 6. We Applied a SA altering the road transport costs, which confirmed the resiliency of the border, as it did not significantly alter the base case simulation of the model: a $20\%$ reduction in road transport costs only increased the volumes of soybeans exported using the Northern Arc by $0.8\%$ of the total produced by the top 50 municipalities, whereas an increase of $20\%$ in the road transport costs reduced the total volume of the Northern Arc by $3.9\%$.
The deterministic simulation of the model clearly indicates the importance of using inland waterways in the intermodal transport combination and the direct impact of the transport costs from farm to port in determining the LC transport option. It also points out the optimal exporting logistics direction and preferred exporting transport corridor to maximize the competitiveness of the exported grain, with evident benefits to the producers - especially those located in the area of influence of the Northern Arc.
The findings, which point at a shift from the current $45.2\%$ to $68.4\%$ of soybeans using the Northern Arc are not only detrimental to reducing farm to port costs. The increase of approximately 7 million tons based on the data of 2017, requires the infrastructure to support the increase. Policymakers and logistics providers have been aware of the potential. In 2023, a new player to the traditional sector started operating from a new EDP in Itacoatiara, on the Amazon River. The EDP called Terminal Porto Ario Novo Remanso is strategically located close to the mouth of the Madeira River and handled 1 million tons in its first year of operations, due to increased production and shift of soybeans exported using the Northern Arc. The project will initially handle 2.7 million tons (TPNR, 2015), but has a potential of handling over 5 million tons after expansions. Other private sector investments include new TF in Porto Velho that will initially handle 4 million tons, being developed by the international Trading company Cargill, and is expected to initiate operations in 2025 (Cargill, 2018). Policymakers are also preparing a concession of the inland waterway of the Madeira River, setting their sights on enabling the inland waterway to transport barge tows all year round, with permanent dredging included in the concession package. This research highlights the necessity for these actions to enable the potential of the Northern Arc's expansion.
Our findings noted that the absence of public subsidies and stimulus programmes related to enhancing competitiveness in the export supply chain actually increases competition between logistics providers, with expansions of existing transport assets and infrastructure facilities in the past decade, such as rail, road, inland waterway providers, TF and EDP alike, enabling the producers to opt for different transport corridors. However, it also stimulated a large concentration of relatively few companies – most global Trading companies – as infrastructure and logistics are capital intensive and usually require investors to endure a number of years before the business starts returning yields. These in turn, are opting not to add value to the commodity within Brazil, exporting low value-added commodities, often to their own facilities abroad. Despite of this, it is notable that even though the transport infrastructure could be better with greater public investment, it is sufficiently competitive to allow producers of MT to compete with major producers like those in the US Midwest, with the adequate choice of the LC transport corridors, and without depending on subsidies or large public infrastructure investments.
Another important aspect related to the results of this study, which indicate cost benefits in increasing the use of multimodal transport corridors that use inland waterways transportation, is the environmental impact. By favouring inland waterways transportation over rail or road transportation, the carbon footprint of the farm to port logistics is drastically reduced, as are other factors, such as hazardous materials spills and accidents with fatalities. Therefore, the benefits are not only cost related, but also environmental. This is a positive action that can favour stakeholders yearning to reduce their carbon emissions and could even entail choosing a transport corridor over another, despite not necessarily being the most cost effective, but providing the opportunity to reduce $\mathrm{CO}_{2}$ emissions as a conscious choice. Policymakers can also potentialize the environmental benefits by stimulating advancements in public policy that further promote the use of multimodal transport corridors which incorporate inland waterways transportation in the farm to port logistics.
As the case study relied on publicly available secondary data, not all data was readily available, though we do not believe that there was a relevant impact. This included data for TF, both rail and inland waterways, as they are all private sector logistics providers that do not disclose the values publicly. However, other studies indicated that these costs do not vary considerably, and are usually similar, not altering the results of the study. To mitigate potential distortions of transport costs, data was obtained using reference values of the third quarter of 2018, and for prior periods, a monetary correction of the Brazilian currency was applied.
The difficulties in obtaining primary data for freight costs from different microregions to the various destinations of the model, would have made a reliable data collection much more complex, unless a large amount of resources were allocated to sourcing primary data in a short timeframe, which was not a consideration for the study. We understand that the freight costs sourced from secondary data related to the productive sectors were a reliable source of data to model the LC transport corridors.
The study was also limited to the top 50 municipalities of MT, possibly excluding smaller producers from the study. However, of the 141 municipalities of MT, 22 did not produce any soybeans in 2017, and the remaining 69 combined only produced $10.6\%$ of the state production in 2017. As the study produced a map indicating all 141 micro-regions of MT, we understand that even the producers in municipalities not encompassed by the study will be able to identify the ideal LC transport corridor for their production.
This case study did not take system restrictions into account, and we recommend further studies concerning capacity constraints to identify potential opportunities that should strengthen the framework of investment decisions of the public and private sectors to achieve the optimal LC transport costs of the soybeans exported from MT to Shanghai or other destinations. Furthermore, with ongoing government investment plans directed at improving precarious or unpaved roads and public concessions of some highways and the inland waterway of the Madeira River, which will be improved as a result, but result in tolls along the way, the costs of road and inland waterway transportation are dynamic over time. Fuel prices, which impact all transport modes, labour costs, and infrastructure changes all affect the current farm to port costs. Other changes, despite increasing costs, could be beneficial, as proposed by the concession of the inland waterway of the Madeira River, which would ensure barge tows of a minimum size throughout the year, even during the seasonal low waters, maximizing assets related to inland waterway transportation. They should be revisited, despite the model indicating a certain resilience regarding road transport cost variations. New TF and EDP being planned are also a relevant factor to consider. These further studies will certainly contribute by identifying if the current infrastructure of available transport fleet of the road, rail and inland waterways modes are sufficient, and if not, where additional availability is necessary. These studies should also encompass the handling capacities of the different TF, as the available fleet capacity alone will not necessarily be the only restriction to the system. Eliminating all constraints of the entire system will enable the exporters of MT, the country's largest producing state, to further improve their competitiveness in international markets, and especially China, which is the largest importer of the commodity.
Disclosure Statement
No potential conflict of interest was reported by the authors.
Funding
The authors reported that there is no funding associated with the work featured in this article.
Author Contribution
All authors approved the submitted manuscript and contributed actively to the study.
Data Availability Statement
All the data used in this research was public and found on the internet at the time of research.
[^2]: CONAB (Companhia Nacional de Abastecimento) is a public company linked to the Brazilian Ministry of Agriculture (MAPA) _(p.4)_
Generating HTML Viewer...
References
73 Cites in Article
Agência Gov (2023). Governo amplia para 48% a meta de redução da emissão de gases de efeito estufa até 2025.
J Amorim,D Lopes (2017). ESTUDOS DE VIABILIDADE DA HIDROVIA DO TAPAJÓS/TELES PIRES/JURUENA.
Anp (2024). Biodiesel.
Tássia Assis,Daniel Gonçalves,Marcelino Silva (2018). ASSESSING THE AGRICULTURAL COMMODITIES TRANSPORTATION IN THE STATE OF MATO GROSSO: SCENARIOS DESTINED TO EXPORTATION.
R Ballou (1993). Logística Empresarial -Transporte, Administração de Materiais e Distribuição.
C Barnes,S Paton,R Stallard,H De Lima,B Clarke,M Vahlberg,A Amakona,K Izquierdo,S Sivanu,F Otto (2024). Low water levels in Panama Canal due to increasing demand exacerbated by El Niño event.
Daniela Bartholomeu,Thiago Bacchi; Péra,; Guilherme,J Caixeta-Filho (2015). Impactos do Aumento do Teor de Biodiesel no Diesel sobre as Emissões de GEE no Transporte de Carga Líquida a Granel.
T Biesheuvel (2018). As China Fires Back in Trade War, Here Are the Winners And Losers.
Emanuele Borgonovo,Elmar Plischke (2016). Sensitivity analysis: A review of recent advances.
C Brasil (2022). Brasil se compromete a reduzir emissões de carbono em 50%, até 2030.
(2023). Aumento de biodiesel ao diesel encarece frete e aumenta poluição.
Danilo Israel,Marife Ballesteros (2016). Review and Assessment of Programs Offered by State Universities and Colleges.
Cargill (2018). Relatório de impacto ambiental.
R Charles,J Hurburgh (2008). Soybean Drying and Storage.
J Clever (2018). China's Robust Demand Expected to Drive Soybean Imports to 100 Million Metric Tons in MY18/19.
Cna (2012). Audiência com a Ministra Izabella Teixeira -MMA -em 08 de Novembro de.
Conab (2017). Compendio de Estudos Conab/ Companhia Nacional de Abastecimento V.
Conab (2017). Acompanhamento da Safra Brasileira de Grãos.
Conab (2019). Unknown Title.
H Dartora (2015). Estudo de Caso: Comparativo Entre o Modal Ferroviário e Rodoviário no Transporte de Grãos de Milho e Soja no Alto Uruguai-RS.
C Deputados,Dos (2016). Arco Norte: um Desafio Logistico.
Steve Easterbrook,Janice Singer,Margaret-Anne Storey,Daniela Damian (2008). Selecting Empirical Methods for Software Engineering Research.
T Economist (2023). Navigating Troubled Waters: Impact to Global Trade of Disruption of Shipping Routes in the Red Sea, Black Sea and Panama Canal.
(2018). FAOSTAT: Download Data from the FAOSTAT Database.
L Fayet (2018). Agronegocio Brasileiro -Alavanca do Desenvolvimento -Oportunidades e Desafios -MP 832.
A Feltrin (2023). Produo de teres do glicerol para uso em mistura com biodiesel.
Federico Ferretti,Andrea Saltelli,Stefano Tarantola (2016). Trends in sensitivity analysis practice in the last decade.
O Fliehr (2013). Analysis of transportation and logistics processes for soybeans in Brazil.
Olivia Fliehr,Yelto Zimmer,Linda Smith (2019). Impacts of Transportation and Logistics on Brazilian Soybean Prices and Exports.
Fretebras (2018). FreteBras -Consulta de Fretes.
Orlandina Da Silva Damian Preve (2016). A participação do boletim geografico do IBGE na produção da metodologia do ensino da geografia.
Orlandina Da Silva Damian Preve (2018). A participação do boletim geografico do IBGE na produção da metodologia do ensino da geografia.
Benjamim Neves (2018). O Mapa Geológico do Nordeste Oriental do Brasil, Escala 1/1.000.000.
N Torma,I Kopolovets,M Frankovičová,Z Tormová,V Lacková,G Kopolovets,A Olos (2017). Minimally Invasive Treatment Methods of Lower Limb Varicosity of C5-C6 Classes (CEAP).
Imea (2018). Agronegócio no Brasil e em Mato Grosso.
N Torma,I Kopolovets,M Frankovičová,Z Tormová,V Lacková,G Kopolovets,A Olos (2018). Minimally Invasive Treatment Methods of Lower Limb Varicosity of C5-C6 Classes (CEAP).
Imea (2019). Unknown Title.
Imea (2019). XIXes Actualités du Pharo : Symposium « Résistance aux anti-infectieux » organisé par le Groupe d’intervention en santé publique et épidémiologie (GISPE) en partenariat avec la Société de médecine des voyages (SMV) et l’Institut de médecine et d’épidémiologie appliquée (IMEA).
Imea (2019). Map of the Municipalities and Macro Regions of Mato Grosso.
Infra (2024). EDITAL DE LEILÃO -CONCESSÃO DA HIDROVIA DO RIO MADEIRA.
Timothy Stark,Abedalqader Idries,Lucia Moya,Abdolrzea Osouli (2018). Beneficial Use of Dredged Material from the Illinois Marine Transportation System.
T Lee,A Tran,J Hansen,M Ash (2016). Major Factors Affecting Global Soybean and Products Trade Projections.
H Lopes,S Lima,R Da,S Ferreira,R (2016). A cost optimization model of transportation routes to export the Brazilian soybean.
Harlenn Lopes,Renato Lima,Fabiano Leal,Aline Nelson (2017). Scenario analysis of Brazilian soybean exports via discrete event simulation applied to soybean transportation: The case of Mato Grosso State.
C Macharis,Y Bontekoning (2004). Opportunities for OR in intermodal freight transport research: A review.
J Mandarino (1987). Composicaõ quiḿica média da soja e valor nutricional das suas proteińas, Embrapa -Soja.
Marinha (2010). Unknown Title.
Marinha (2013). Unknown Title.
A Mckinnon,M Piecyk (2010). Measurement of CO2 emissions from road freight transport: A review of UK experience.
Luiz Ambrósio,Náscar Do Carmo,Rayssa De Oliveira,Otávio Teixeira,Isabela Faria,Elisa Costa (2018). INCIDÊNCIA DE INTERNAÇÕES POR FRATURAS EM IDOSOS ENTRE JANEIRO DE 2020 E DEZEMBRO DE 2021 EM GOIÂNIA-GO.
I Melo,P Junior,A Perico,M Guzman,D Rebelatto,N Do (2018). Benchmarking freight transportation corridors and routes with data envelopment analysis (DEA).
Mtpa (2010). Anuário Estatístico de Transportes 2010 -2016, Anuário Estatístico de Transportes.
Meiresângela Muniz,Benedito Pereira (2024). ÍNDICES DE DESENVOLVIMENTO RURAL: COMPARAÇÃO ENTRE OS MUNICÍPIOS DO VALE DO RIO CUIABÁ E OS DEMAIS MUNICÍPIOS DE MATO GROSSO: 2000 E 2008.
L Patroni (2019). Atoleiros na BR-163 já provocam fila de 40 km de caminhões Atoleiro na BR-163 Atoleiro na BR-163 Atoleiro na BR-163.
L Pereira (2009). Modelo de Formação de Preços de Commodities Agrícolas Aplicado ao Mercado de Açúcar e Álcool.
C Prodanov,E Freitas,De (2013). Metodologia do trabalho científico: métodos e técnicas da pesquisa e do trabalho acadêmico.
F Ripoll (2012). Proposta de uma análise logística no agronegócio como fator competitivo para a distribuição e comercialização da soja em grão no Estado de Mato Grosso.
N Rubio,R Kirkpatrick (2017). Infrastructure Developments in Brazil's Northern Arc.
D Salin (2014). Soybean Transportation Guide: Brazil.
Delmy Salin (2019). Brazil Soybean Transportation Indicator Reports. November 2013.
D Salin,A Somwaru (1992). The Impact of Brazil’s Infrastructure and Transportation Costs on U.S. Soybean Market Share: An Updated Analysis From 1992-2019, November 19, 2020.
Sinfra (2024). DESAFIOS NO COMPARTILHAMENTO INTERNACIONAL DE INFORMAÇÕES SOBRE ATAQUES CIBERNÉTICOS: UMA ANÁLISE COMPARATIVA ENTRE BRASIL, ESTADOS UNIDOS E EUROPA.
R Soliani (2015). Night Bars on the Coast of Paraná- Brazil: A Brief Overview on Consumption.
H Souza (2018). Preço para transportar soja em Mato Grosso tem variação desde imposição da tabela de frete.
Tpnr (2015). RIMA -TERMINAL PORTUÁRIO NOVO REMANSO S/A.
(2024). United Nations Framework Convention on Climate Change (UNFCCC) Secretariat.
(2017). A Reliable Waterway System is Important to Agriculture.
Christy Haynes,Richard Van Duyne (2018). Nanosphere Lithography: A Versatile Nanofabrication Tool for Studies of Size-Dependent Nanoparticle Optics.
Ilya Polyak (2018). Historical Records.
(2018). Communicating with Charts: Maps.
Department Of The Air Force Washington Dc (2019). Final Environmental Planning Technical Report. Transportation.
J Vilko,J Hallikas (2024). Impact of COVID-19 on logistics sector companies.
Will Bertrand,J Fransoo,J (2002). Operations management research methodologies using quantitative modeling.
No ethics committee approval was required for this article type.
Data Availability
Not applicable for this article.
How to Cite This Article
Ramesh M. Thadani. 2026. \u201cMapping Least Cost Transport Corridors for Soybean Exports from Mato Grosso: A Case Study of Logistics from Farm to Port\u201d. Global Journal of Human-Social Science - E: Economics GJHSS-E Volume 24 (GJHSS Volume 24 Issue E4): .
Explore published articles in an immersive Augmented Reality environment. Our platform converts research papers into interactive 3D books, allowing readers to view and interact with content using AR and VR compatible devices.
Your published article is automatically converted into a realistic 3D book. Flip through pages and read research papers in a more engaging and interactive format.
Brazil and the US are world’s largest soybean exporters, and account for more than 80% of the global exports, most of which, destined to China. Hence, the producers of both countries compete directly to place their grain in the same market, and their logistic costs are essential to their competitiveness. For the producers in Mato Grosso (MT), Brazil’s largest producing state and most distant from ports, choosing the best route and transport mode materially impacts their competitiveness. The farm to port logistics, which refers to the inland transportation from the agricultural production point to the exporting shipping port, is central to reducing the total logistics costs, and depending on the transport mode choice, also impacts the environment differently. Various studies have evaluated routes or transport modes individually by analysing their impact, and some give an insight into the least cost (LC) choice, yet to the best of our knowledge, there are none determining the detailed spatial geographic boundaries of the optimum choice transport corridors for each micro geographic location within MT.
Our website is actively being updated, and changes may occur frequently. Please clear your browser cache if needed. For feedback or error reporting, please email [email protected]
Thank you for connecting with us. We will respond to you shortly.