The search for an economy that is not riddled with externalities is an ongoing one. However, to reach this objective, policy making must shift its focus from the end of pipe solutions and obtain a deeper understanding of the connection that economic development and growth holds with environmental degradation. This study focuses on the connection that the economy holds with waste generation and via the application of the Waste Input Output model, it puts forward estimatesillustrating how a €1-million injection in final demand impacts total waste generation, considering, both direct and indirect production and waste generation effects. The research is based on the Maltese Islands and uses 2015 as a base year. This is in view that the most recent input-output tables published by the national statistics office are built on this year. Results note that the waste generated by the construction industry remains by far the largest with 1,535.07 tonnes generated for every €1 million. Other concerning figures arise from the health and social work and agricultural sectors which result in 523.33 and 135.57 tonnes of waste respectively when there is an injection of 1 million euros.
### INTRODUCTION
Over the past few years, the search for an economic growth model that is not riddled with externalities has become an integral part of the agenda of many decision makers. While economic expansion has, for a long time, been given precedence, the repercussions are now evident. More economies are seeking to sustain growth while consuming less resources and avoid environmental degradation – a goal that for a long time has eluded many.
Waste generation represents one such side effect - which was secondary to the immaterial economies of finance, knowledge, and hi-tech. However, the consistent escalation in generation figures shifted waste's marginality to a more central role necessitating heightening attention towards the requirements of collection, disposal and treatment (Massarutto, 2007). In the case of islands, the impacts felt by escalation in waste generation figures are amplified. The limited land availability together with the challenges posed by insularity and high population density remove any possibility of making waste management straightforward. Furthermore, islands often have limited treatment facilities which in turn requires transportation of waste fractions over long distances while areas that are of special interest including protected and sociocultural heritage make the siting of waste facilities more difficult (Santamarta et al., 2023).
The rising waste generation figures caused supranational administrations like the European Union (EU) and the United Nations (UN), have introduced measures like the Circular Economy Action Plan and Sustainable Development Goals (SDGs) respectively (Alcay & Montañés, 2021). While the Circular Economy Action Plan, aims to "scale up the circular economy from front-runners to the mainstream economic players" (European Commission, 2020), SDG 12.5 seeks to substantially reduce waste generation through prevention, reduction, recycling, and reuse and ultimately decouple waste from economic growth. However, to achieve this goal, a deep understanding of economic correlations is required.
This paper aims to highlight the relationship between waste generation and economic growth using waste input-output analysis (WIOA). This model extends the standard Leontief demand-driven model which views the economy as an interconnected system where industries affect one another directly and indirectly (Miller & Blair, 2009). Here, the Leontief model is expanded to include the "dynamics of waste treatment" to measure the waste footprint of the different industries within that economy. A distinctive aspect of the input-output model is its ability to determine both direct and indirect waste generation, whereby direct waste generation refers to waste generated directly from the industries being examined while indirect waste generation refers to all materials required along the production chain to manufacture a final product (Salemdeeb et al., 2016).
In view of the publication 'Supply, Use and Input Output tables: 2015" by the National Statistics Office, Malta (NSO, 2021), the research is based on 2015 and focuses on the Maltese Islands. This research builds on a previous (unpublished) study by the same authors which was centred on 2010 data whereby the clear connected between waste and the economic sectors stressed the necessity for a policy effort that does not burden societies with externalities The study also points out that the out-of-mind, out-of-sight measures are no longer viable particularly in the case of islands (Camilleri-Fenech, M., Cassar, I.P., Gabarrell., X., Oliver-Sola, J. Farreny, 2018).
Malta presents an ideal scenario since the island measures $316~\mathrm{km}^2$ and hosts a population of 542,051[^1] people. Therefore, the quantities and type of waste generated is of great concern not only aesthetically but also from a space and management perspective. Additionally, prior to the negative impact of the Covid-19 pandemic, Malta underwent extensive economic expansion. In fact, between 2012 and 2019, the Maltese economy experienced an average growth in its GDP of $6.4\%$ per annum (National Statistics Office, 2020). However, this positive development was not without any negative repercussions. The State of the Environment Report, 2018 notes that "waste generation per capita (in Malta) remains high when compared to EU countries". It further adds that "resource productivity, as compared to previous years, has dropped, indicating that we have become more 'wasteful' of resources" (ERA, 2018).
This study utilizes the Leontief Input-Output Analysis (IOA). The analysis undertaken will employ the latest available Symmetric Input-Output Table (SIOT) for the Maltese Economy, that of 2015, obtained from the National Statistics Office of Malta (NSO). The WIOA will seek to demonstrate the in-depth relationship that waste generation has with economic intensification while comparing results obtained utilizing an SIOT for 2010[^2] in order to identify any potential important shifts in sectoral behaviour between the two periods. IOA has long been extended to account for environmental pollution generation and abatement which are associated with industrial activities - examples include, Moll & Acosta, 2006 and Kjaer et al., 2015, while more focused studies on waste generation include Tsukui et al., 2015 and Dimitrios Hristu-Varsakelis, Karagianni et al., 2012.
## I. LITERATURE REVIEW
Input-output analysis was extended to environmental pollution generation and the abatement measures required with industry activity in the late 1960s (Miller & Blair, 2009 p. 446). Miller & Blair, 2009 point to three categories of models, namely, (1) generalized input-output models – which are formed by augmenting the technical coefficient matrix with additional rows and/or columns to reflect pollution generation and abatement activities; (2) economic-ecological models – which extends the interindustry framework to include additional "ecosystem" sectors where flows are recorded between the economic and ecosystem sectors and (3) commodity-by industry models which express environmental factors as commodities in a commodity-by-industry input-output table (Miller & Blair, 2009 p.446). The model utilized in this study will take the form of a generalized input-output framework whereby a technical coefficient matrix with additional rows and/or columns will reflect pollution, that in this study is represented in the form of commercial and industrial waste. This approach will assist in the identification of both impacts and future planning applications (Miller & Blair, 2009). Ultimately, this study aims to provide a physical dimension of the economy and assist in identifying which industries are causing the highest waste impact as a result of their production activities. Additionally, the results generated will identify the type of waste originating from the different industries and will therefore potentially be of assistance for policy makers in the planning of treatment facilities.
IOA has been used extensively for the measurement of sustainability impacts across the supply chain. The possibility to couple monetary with physical data on various environmental indicators allows for a transformation of monetary transactions to reveal environmental impacts which in this case consist of solid waste generation (Malik et al., 2021).
While. (Liao et al., 2015) have the possibility of utilising a high-resolution waste generation WIO model that consists of more sophisticated waste types and treatments, in this case a low-resolution table was utilised. However, both studies employ two components of the WIO model, which evaluate the amount of upstream waste production embodied in the downstream supply chain thus allowing for a more holistic perspective of waste generation, while making it possible to move away from end-of-pipe strategies (Liao et al., 2015).
Salemdeeb et al., 2016, utilize waste input-output analysis to understand the link between economic activity and waste generation with the aim of quantifying the waste that arises in the supply chain. Using the original extended model to define the matrix of environmental outputs, which in this case refer to waste generation, results point to the construction sector, followed by the mining and quarrying industry as the two top waste producers in the UK. Tsukui et al., 2015, on the other hand, utilize interregional waste input-output (IRWIO) analysis to examine how consumption by metropolitan residents in Tokyo releases repercussions on landfill sites in other regions. The use of IRWIO allowed the authors to investigate the direct and indirect effects of consumption by Tokyo residents on other regions in Japan. Consumption is often the go-to solution to stimulate economic activity however it also increases industrial waste produced by these regions. Since post-consumer waste is exported to regions outside Tokyo it also impacts waste treatment and landfill sites within an interregional context. The research concludes that although consumption in Tokyo promoted production activities in outside regions, the value of induced production in industrial sectors was only half as much as that of the Japanese capital city, while value added was only about third that of Tokyo. Furthermore, although Tokyo residents stimulated recycling of municipal solid waste thus reducing waste quantities that needed to be treated outside the city, the total amount of induced landfill volume was 1.7 million cubic meters, which is 2.4 times greater than that of Tokyo. Additionally, the environmental burden in terms of carbon emissions was the same in Tokyo as in other regions (Tsukui et al., 2015). Varsakelis et al., 2012, utilize input-output analysis to allocate the production of Greenhouse Gases (GHG) and waste to the various sectors of the economy. The authors emphasize the interdependence of sectors with respect to changes in the final demand and correlate pollution and energy usage to economic production on a sectoral basis. The research, together with quantifying the macroeconomic effects arising from optimizing production to meet environmental goals, serves to translate pollution targets to sectoral production targets. Additionally, it determines whether a reduction in one pollutant automatically creates savings into another.
## II. MATERIALS AND METHOD
### a) Data
This study shall employ the an SIOT for the reference year of 2015 published in 2021 as it is at present the most recent SIOT published by the National Statistics Office (NSO) of Malta.Waste generation data, including the treatment figures were supplied by the NSO and the Waste Management Unit within the Environmental Resource Authority (ERA). Minor clarifications, mainly focused on waste originating from hotels, was requested to WasteServ Malta Ltd. Figures in the sectoral waste generation table were compiled by the authors to adapt them to the European Statistical Classification of Economic Activities (NACE) Rev 2. In view that the Maltese economy is an open one, as evidenced by the relatively high trade to GDP ratio of $283.5\%$, the SIOT for domestic production and the respective imports table were aggregated into a single 17 by 17 industry by industry SIOT representing now total input requirements and total supply of output. The imports and SIOT of domestic production table were summed (see Annex A) since the items listed in the imports table refer to materials imported by economic sectors to supplement production and therefore contribute to process waste. This allows for a lifecycle approach whereby process waste includes both the indirect waste generated from imports and the direct waste during processing until they reach final treatment including when this requires exportation.
Table 1: Sectoral waste generation in 2015[^4]
<table><tr><td></td><td>A: Agriculture [1-3]</td><td>C to E: Production [5-36]</td><td>B&F: Quarry & construction [41-43]</td><td>G: Distributio n [45-47]</td><td>I: Hotels & restaurants [55-56]</td><td>Q: Health & Social Work [86-88]</td><td>S: Other services [94-96]</td><td>Total</td><td>% of total</td></tr><tr><td>Landfill</td><td>1,736</td><td>766</td><td>589</td><td>0</td><td>5,532</td><td>0</td><td>340</td><td>84,053.0</td><td>5.5</td></tr><tr><td>Incineration</td><td>5,166</td><td>564</td><td>0</td><td>0</td><td>0</td><td>424</td><td>7</td><td>6167.32</td><td>0.4</td></tr><tr><td>Recovered</td><td>20</td><td>4,678</td><td>890,853</td><td>0</td><td>0</td><td>0</td><td>8</td><td>900,756.6</td><td>59</td></tr><tr><td>Recycled</td><td>4</td><td>3,907</td><td>320,829</td><td>10,908</td><td>0</td><td>0</td><td>27,839</td><td>414,485.5</td><td>27.2</td></tr><tr><td>Physico-chemical treatment</td><td>16</td><td>0</td><td>0</td><td>0</td><td>0</td><td>0</td><td>0</td><td>40.73</td><td>0</td></tr><tr><td>Mineral waste dumped at sea</td><td>0</td><td>0</td><td>111,560</td><td>0</td><td>0</td><td>0</td><td>0</td><td>111,560</td><td>7.3</td></tr><tr><td>Other</td><td>0</td><td>8,704</td><td>0</td><td>0</td><td>0</td><td>0</td><td>0</td><td>8,704</td><td>0.6</td></tr><tr><td>Total</td><td>6,942</td><td>18,620</td><td>1,323,831</td><td>10,908</td><td>5,532</td><td>424</td><td>28,194</td><td>1,526,147</td><td>100</td></tr></table>
The figures presented in Table 1 refer to commercial and industrial waste and construction and demolition waste. Municipal Solid Waste (MSW) is excluded in view that it refers to waste that is "mixed or separately collected from households" and which "does not include waste from production, agriculture... or construction and demolition waste" (European Parliament and Council, 2018). Input-output methodology on the other hand, emphasizes the economy's production side, accounts for the interdependence between industries and focuses on upstream environmental impacts (Kitzes, 1987). It should also be noted that Sectors E37-39, which refer to water supply and waste collection treatment and disposal activities are also excluded as this avoids issues of double counting since the output of these sectors refers to remediation facilities for waste originating from the other economic sectors.
The research is therefore focused on commercial and industrial waste together with construction and demolition waste. The Long-Term Waste Management Plan 2021-2030 for Malta refers to industrial waste as the by-product of industrial processes such as manufacturing of goods and the extraction and treatment of minerals. Commercial waste, on the other hand, arises from the tertiary or service sector e.g., retailers, catering establishments etc., The plan also notes that commercial waste is frequently discarded with the MSW collection thus creating a data gap which is not possible to identify with the provided information (Ministry for the Environment, 2020).
As can be noted in Table 1, the major waste flow originates from the construction industry reaching 1,323,831 million tonnes. In the same Waste Management Plan, although the majority of waste stream is inert, the sheer volume poses significant challenges in terms of void space necessary to continue the practice of landfilling. Although, dumping at sea is an internationally approved option, studies on the topic are limited with the most recent one dating 2005[^5]. Impacts of this practice are largely undocumented, and the spoil ground is largely considered an underwater quarry. Additionally, spillage from the barges transporting construction debris to the spoil ground is a regular occurrence with rubble being detected 4 km to the north-west of the designated zone (Deidun, 2020).
Table 1 shows only those sectors for which waste generation data is available. This is a limitation of this study as some sectors are not included. While the quality of the raw data of waste figures for 2015 improved as compared to $2010^6$, the collated table still cannot be considered as a high resolution. This imposes limitations in that the more sophisticated waste types and treatments cannot be accounted for and therefore it is not possible to trace the trajectories of the more detailed waste flows into their corresponding treatments and identify the wastes that are embodied in those streams that are driven by each category's final demand (Liao et al., 2015).
### b) Method
This research does not seek to contribute to the Leontief Input Output analysis (IOA) but utilizes the methodology to determine the waste footprint of the industrial sector in Malta. IOA has been utilised extensively to determine the environmental and, more specifically the waste impact (amongst others, see Reynolds et al., 2014, Saito, 2013, Salemdeep et al., 2016, Meng-i Liao et al., 2015). The input output framework evaluates backward linkages which represent the demand side and forward linkages, which represent the supply side. This allows for the identification of the most important sectors in the economy (Bartokova, 2018) and in the case of waste IOA, for the exposure of the industry responsible for the highest waste impact within that economy. Nakamura & Kondo, 2009, (p.220) define waste footprints as "the amount of waste that was generated directly and indirectly to deliver a unit of its product to the final demand". The method applied in this research follows the approach utilised in Butnar & Llop, 2007 but focus is shifted from greenhouse gas emissions to waste. An advantage of this methodology is its ability to estimate both direct and indirect waste arising from changes to the final demand of each specific sector. However, while several research papers mention the terms 'direct and indirect' waste arisings, few define them. In this paper, the definition utilized in this study is that adopted by Reynolds et al., 2014, which describe direct waste generation as the "waste generated by an industry's own on-site production processes". Indirect waste generation, on the other hand, is defined as the "volume of waste generated throughout the supply chain as a result of the production processes of all industries in that supply chain underpinning the production of the final product by each sector."
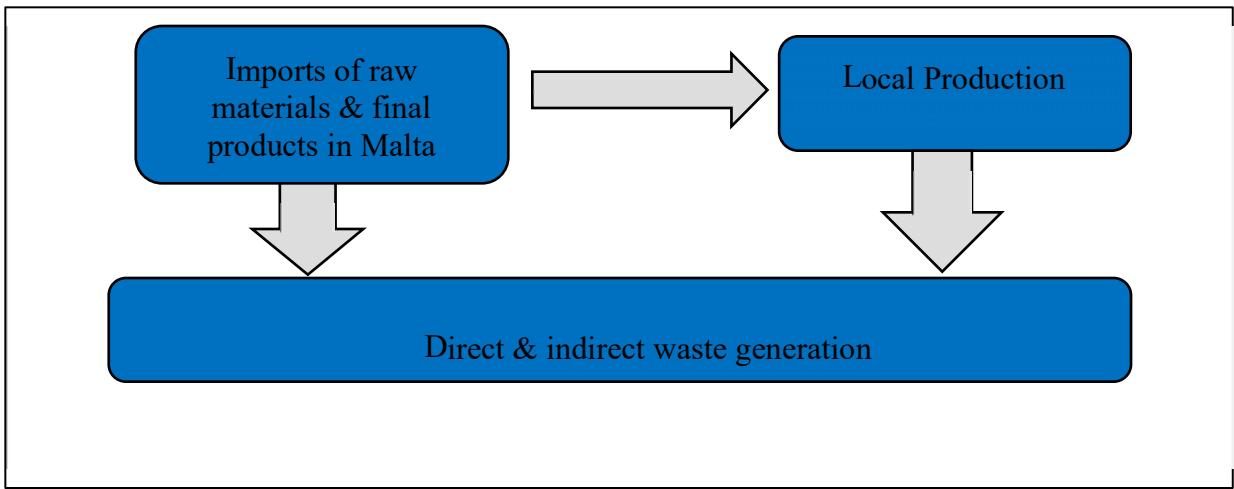 Figure 1: Direct & Indirect waste generation
Source:Authors'Own
Together with quantifying the waste footprints of industries operating in Malta, the research will determine how a hypothetical increase of €1 million injection in final demand[^7] will impact upon waste generation. The calculation method utilised is explained in the methodology below.
Equation 1: Leontief Inverse
$$
L = (I - A) ^ {- 1}
$$
Where $L =$ Leontief Inverse Matrix
$$
I = Identity matrix
$$
A= matrix of technical coefficient of imports + domestic consumption
Matrix A is obtained by adding the imports and domestic production and then calculating the resulting matrix of technical coefficients. This allows for the examination of the underlying system of interactions and interdependencies (Bartokova, 2018) and is essential since the imports table refers to the materials brought in the country to supply the different production sectors and therefore contribute to process waste. Additionally, it corresponds to a life-cycle methodology whereby waste generated is accounted for from its inception until its final treatment including export. Matrix A measures the fixed relationship between outputs and inputs of a sector and thus calculates the proportions that in the Leontief model are assumed to be constant. Every column in the A Matrix represents the partial cost of the input (excluding costs of primary inputs) which are sustained when a euro's worth of commodity is produced for each sector.(Chiang & Wainwright, 2005).
Equation 2: Linking sectoral waste generation with final demand
$$
F = G (I - A) ^ {- 1} Y
$$
Where,
$F = a$ column vector of aggregated waste generation by type of treatment
G = matrix of sectoral waste output per unit of production
Y = a column vector of sectoral final demand
Column Vector F represents the aggregated waste generation by type of treatment for each sector under consideration whilst. Matrix $\mathbf{G}^8$, represents the matrix of sectorial waste output per unit of production, whereby every element represents the quantity of waste generated by sector (in tonnes) per monetary unit of final production in activity of each respective sector. The elements in column vector Y put forward the level of final demand for each sector. From this input-output model it may be inferred that when final demand increases the sectoral volume of waste generation will also increase. This increase in waste generation will also capture the resulting waste generation as a result of the direct and indirect production effects generated as a result of the initial increase in final demand. In applying this methodology, it is possible to quantify how a shift in the demand of activities, for example, a change in consumption, will impact waste generation both directly and indirectly and across all the sectors to satisfy a unit of final demand for the sector. This analysis is therefore of value to understand avenues through which environmental, and specifically waste, burdens are spread across the economy and makes the development of a waste policy that is integrated with economic policy.
Equation 3: Quantity of sectoral waste generated due to an exogenous shift in demand.
$$
\tilde{\partial} F = G (I - A)^{-1} \tilde{\partial} Y
$$
Equation 3 measures the changes in the quantity of sectoral waste generated ( $\delta F$ ) which results from an exogenous shift in final demand ( $\delta Y$ ) (Nakamura, 1999). It notes an entire sequence which commences with an exogenous shock in sectoral demand causing impacts on the total amount of waste generated (Butnar & Llop, 2007 p.390).
The research put forward in this study may be considered of policy relevance because it highlights how shifts in economic activity extend to treatment facilities particularly for islands like Malta where space is of essence and expansion of treatment facilities is subject to extensive nimbyism. The results are of value not only to identify and quantify the connection between economic sectors and waste generation but also to highlight the impact this will have on treatment facilities.
## III. RESULTS
One of strengths of IO methodology lies in its ability to capture both direct and indirect waste arisings across the supply chain. Both direct and indirect waste generation arisings can be found in Figure 2 as simple waste multipliers which demonstrate the quantities of waste generated by different economic sectors when final demand increases by 1 million euro. These figures quantify the impacts resulting from economic decisions including the repercussions certain decisions will have to the waste treatment facilities. Consequently, WIOA can also serve as a form of environmental accounting on a macroeconomic level. To this end, environmentally extended input-output analysis (EEIOA) has the ability to map impacts resulting from the purchase of goods and services and has been proposed as a tool to measure sustainability related issues across supply chains (Malik et al., 2021).
As indicated in Section 2.1, the workings commenced with the addition of the imports and domestic production table which is referred to as the intermediate demand table (Annex A). This step was followed by the removal of the E37-39 sector (see Annex A). This sector is subsequently removed in view that waste originating from the industry which is subsequently treated in the waste facilities is not double counted. Therefore, the waste generated from the various industrial sectors is accounted for only within the sectors from where it originates. If the E37-39 sector is retained, this same waste would be accounted for also at the treatment stage leading to the double counting of waste.
The calculation and summation of the column vectors of the results of the first equation $L = (I - A)^{-1}$ determines the sector output multiplier (SOMs).
SOMs measure the effects of one monetary unit change in the final demand for each sector on the total output production of all sectors, considering direct and indirect effects. The SOMs demonstrate which industrial sector would generate most waste when 1 million euros are injected into the economy. The magnitude of a SOM is driven by the level of intermediary inputs that a sector generates as a ratio of total inputs compared to its primary inputs. These exert a direct influence on the size of the multiplier, therefore the higher this ratio, the higher stronger the multiplier effect. Furthermore, the higher the backward inter-industry linkages the larger the magnitude of the SOMs (Cassar, 2013).
In this case, since the imports have been included in the initial summation of the A-matrix, it is possible to examine the impact that increases in production will have on the demand for imports. In the WIOA presented in this research, these linkages are crucial to examine the impact that a €1 million injection in the economy will have on waste generation and on the treatment facilities available.
Table 2: Matrix G – Waste input-output multipliers for 2015
<table><tr><td>tonnes</td><td>A</td><td>Cto E [36]</td><td>B & F</td><td>G</td><td>H</td><td>I</td><td>J</td><td>K</td><td>L</td><td>M</td><td>N</td><td>O</td><td>P</td><td>Q</td><td>R</td><td>S</td><td>T, U</td></tr><tr><td>Landfill</td><td>7.51</td><td>0.90</td><td>1.05</td><td>0.21</td><td>0.38</td><td>5.64</td><td>0.21</td><td>0.15</td><td>0.18</td><td>0.21</td><td>0.44</td><td>0.18</td><td>0.10</td><td>0.23</td><td>0.18</td><td>2.38</td><td>0.00</td></tr><tr><td>Composting</td><td>0.00</td><td>0.00</td><td>0.00</td><td>0.00</td><td>0.00</td><td>0.00</td><td>0.00</td><td>0.00</td><td>0.00</td><td>0.00</td><td>0.00</td><td>0.00</td><td>0.00</td><td>0.00</td><td>0.00</td><td>0.00</td><td>0.00</td></tr><tr><td>Incineration</td><td>21.88</td><td>1.47</td><td>0.68</td><td>0.35</td><td>0.56</td><td>1.78</td><td>0.37</td><td>0.96</td><td>0.33</td><td>0.32</td><td>0.51</td><td>1.63</td><td>0.78</td><td>468.07</td><td>0.38</td><td>0.48</td><td>0.00</td></tr><tr><td>Recovered</td><td>69.12</td><td>70.82</td><td>1029.66</td><td>39.98</td><td>77.03</td><td>60.06</td><td>26.63</td><td>15.10</td><td>94.51</td><td>31.45</td><td>35.09</td><td>40.67</td><td>33.07</td><td>35.74</td><td>22.54</td><td>51.23</td><td>0.00</td></tr><tr><td>Recycled</td><td>26.84</td><td>28.50</td><td>372.89</td><td>22.46</td><td>29.47</td><td>25.30</td><td>10.74</td><td>6.40</td><td>34.66</td><td>12.22</td><td>13.58</td><td>15.26</td><td>12.28</td><td>14.01</td><td>9.04</td><td>191.71</td><td>0.00</td></tr><tr><td>Physico-chemical</td><td>0.07</td><td>0.00</td><td>0.00</td><td>0.00</td><td>0.00</td><td>0.00</td><td>0.00</td><td>0.00</td><td>0.00</td><td>0.00</td><td>0.00</td><td>0.00</td><td>0.00</td><td>0.00</td><td>0.00</td><td>0.00</td><td>0.00</td></tr><tr><td>Stored</td><td>0.00</td><td>0.00</td><td>0.00</td><td>0.00</td><td>0.00</td><td>0.00</td><td>0.00</td><td>0.00</td><td>0.00</td><td>0.00</td><td>0.00</td><td>0.00</td><td>0.00</td><td>0.00</td><td>0.00</td><td>0.00</td><td>0.00</td></tr><tr><td>Mineral waste dumped at sea</td><td>8.54</td><td>8.50</td><td>128.81</td><td>4.97</td><td>9.58</td><td>7.41</td><td>3.30</td><td>1.87</td><td>11.80</td><td>3.91</td><td>4.37</td><td>5.07</td><td>4.12</td><td>4.42</td><td>2.79</td><td>6.32</td><td>0.00</td></tr><tr><td>Other</td><td>1.61</td><td>5.54</td><td>1.99</td><td>0.58</td><td>0.92</td><td>1.69</td><td>0.54</td><td>0.27</td><td>0.51</td><td>0.48</td><td>0.40</td><td>0.37</td><td>0.26</td><td>0.86</td><td>0.41</td><td>1.28</td><td>0</td></tr><tr><td>TOTAL SECTORAL WASTE MULTIPLIER</td><td>135.57</td><td>115.72</td><td>1535.07</td><td>68.55</td><td>117.94</td><td>101.88</td><td>41.78</td><td>24.77</td><td>142.00</td><td>48.58</td><td>54.38</td><td>63.17</td><td>50.61</td><td>523.33</td><td>35.35</td><td>253.41</td><td>0.00</td></tr></table>
Table 2 provides the results of the WIO 2015 applied in this study. As can be noted, the construction industry generates, by far, the largest quantity of waste (1,1535.7 tons) when there is a €1 million injection in final demand. This is not unique to Malta. In fact, the construction sector produces the highest amount of waste when compared to other sectors on a worldwide basis (Osmani & Villoria-Saez, P., 2019) and also within the EU (Wahlström et al., 2020). The sector is typified by high recovery rates, which suggests an elevated circularity, however, in many cases the recovery rates are largely met because of backfilling which is considered as a low grade recovery application and therefore not an optimal solution (EEA, 2020). Backfilling characterizes the CDW treatment practices of many EU member states including Malta but, despite contributing to the recovery rates, it reduces the potential to shift towards a circular waste management that is steadfast and consistent (EEA, 2021).
The shift to backfilling results in a reduction in landfilling. However, it must be pointed out that prior to 2010, CDW placed in quarries was registered as landfilled. In fact, in 2015, the amount of CDW landfilled is negligible and used for landfill capping. The shift towards recovery was induced by the Waste Framework Directive 2008/98/EC which in Article 11 required that by 2020 Member States (MS) recover $70\%$ by weight of this waste (European Parliament and Council, 2008).
Recycling gained ground in various industrial sectors including construction. Although difficulties still exist since the materials generated from work related to demolition and renovation are often not suitable for reuse and closed-loop recycling (EEA, 2021), it is positive to note that recycling within the construction industry registered a significant increase. Generally this takes the form of aggregates for concrete and roadworks, crushed and other material used for renovation works and the recovery of metals (ERA & Ministry for the Environment, 2021). In a recently published standard (SM510:2022), the Malta Competition and Consumer Affairs Authority (MCCAA), examines the current practices within the construction industry with regards to the C&D waste that results from the demolition, excavation, and construction activities. The standard provides guidance for good practice, particularly building owners, developers, architects, and contractors and includes (1) the need to minimise the generation of waste and (2) the reduced dependency and consumption of natural raw materials, while underlining the importance of reusing and recycling the material generated during demolition, excavation and construction activities. Furthermore, the standard provides guidelines that facilitates the process during the planning stage to facilitate practices towards recycling-orientated deconstruction and controlled excavation methodologies that minimise or eliminate waste disposal. The standard aims to reduce dependency on backfilling (Malta Competition and Consumer Affairs Authority, 2022).
However, barriers to achieve high circularity remain. These include (a) the price competition with virgin material, (b) confidence in quality & structural properties, (c) the content of hazardous substances, (d) lack of sufficient and reliable data and (e) the time delay between implementing a circular action and its benefits (EEA, 2020). The Construction and Demolition Waste Strategy for Malta 2021 - 2030, nonetheless points out that more effort needs to be placed to move towards increased recycling and reuse within this industry (ERA & Ministry for the Environment, 2021).
Recycling has in fact, garnered interest throughout all sectors. This treatment method, together with it contributing to resource efficiency thus reducing environmental impact, also boasts of financial benefits. Technological improvements have facilitated the process and reduced costs. All NACE sectors register a steady multiplier including agriculture (26.84), transport (29.47), information and communication (25.30) and other services (129.09).
Recovery has also accumulated additional interest from all industrial sectors. Although, as discussed in the previous paragraph, the benefits of this activity in the case of CDW are questionable, interest in this treatment sector is increasing. Additional interest in recycling and recovery, particularly within industrial areas, can be generated with the introduction of industrial symbiosis. The potential for industrial symbiosis within the Hal Far cluster in Malta was recently studied by Vella (2022). The study noted that the potential for symbiosis exists for cardboard, chemicals and solvents, metals, polymer and wood. It also highlights that presently there are already 4,319 kg/week of by-products that are re-circulated within the economy, additional possibilities of re-circulation exist for 362 kg/week. In addition to this the potential for energy recovery from 11,429 kg of waste materials can be tapped into (Vella, 2022).
Changes are also noted in treatments like composting which, while they feature in 2010 with 302.72 tonnes, in 2015 composting is absent. Despite Malta's highly calcareous soils (ERA, 2018), composting continues to be unpopular, to the extent that it no longer features amongst the treatment options. One should keep in mind that farmers are likely to be doing this practice on their own initiative and therefore the figures are not registered in the national statistics. Furthermore, animal dung is widely available with an average of 26,000 kgs of manure (including chicken and cow manure) produced. However, the continuous and over usage of manure and slurry can be of concern since its nutrient content needs to carefully managed as it can result in significant enrichment of surface and groundwaters (Green, 2019). For this reason, the usage of such materials is controlled under what was previously known as the Nitrate Directive (now forms part of the Water Framework Directive) (Green, 2019). In the Malta Rural Development Programme (National), specifically under the Agri-Environment Climate Measures (AECM) 5, composting was one of the activities promoted (European Agricultural Fund for Rural Development 2014-2022, 2014), however the impact of the initiative was limited. The same document states that $30\%$ of manure produced is applied in fields (p.57) with manure management contributing to one-third of the greenhouse gas (GHG) emissions generated by agriculture (European Agricultural Fund for Rural Development 2014-2022, 2014). Storage is another 'treatment' option that is missing. This is generally used when waste owners retain items under a better market price is found.
## IV. DISCUSSION
This section provides an overview of the shifts registered in waste generation and treatment between on the basis of the SIOT for 2010 and the SIOT for 2015 to gain an insight into the impacts resulting from recovery and recycling measures together with the policies abounding from the EU.
Notable shifts were mainly recorded in the recycling and recovered categories. Recycling figures increased from 161,732 tonnes to 414,485 tonnes amounting to $61\%$ increase. The main changes were registered in the C&D waste category and in the Sector S: Other services. In the case of the former, recycling consists of metal mainly originating from demolition activities and the recycling of excavated material. These shifts are mainly motivated by financial gain since the legislation promised in the Waste Management Plan for Maltese Islands 2014-2020 (Pg. 133) (MSDEC, 2014) was published recently as Subsidiary Legislation 549.161 Construction and Demolition Waste Framework Regulations.
Recycling figures also increased for Sector S. In this case these figures consist mainly of paper, cardboard plastic packaging but also of other forms of paper and cardboard waste metallic and glass waste, rubber waste and finally wood and textile waste. While Malta registered various difficulties with the recycling targets (MSDEC, 2014) [Pg.135], the initiatives were starting to register some changes.
While total industrial waste generation increased from 1,224,516.29 tonnes in 2010 (See Annex B) to 1,526,146.9 tonnes in 2015, shifts in the treatment methods employed changed considerably. In fact, while in 2010, a total of 707,022.61 tonnes of waste were landfilled, in 2015 this went down to 84,053 tonnes. On the other hand, recovery increased substantially (from
68,793.66 to 900,756.6 tonnes in 2015) with changes registered mainly in Sector: 41-43 Quarrying and Construction. In fact, prior to 2012, C&D waste disposed of in quarries was registered as landfilled. However, after this year this type of disposal is registered as recovery. In fact, the recovery figure increased from 15,809 tonnes to 900,756 tonnes. This shift also assisted Malta to achieve the targets set by Article 11 of the Waste Framework Directive which required Member States that "by 2020, the preparing for reuse, recycling and other material recovery of non-hazardous construction and demolition waste.... shall be increased by a minimum of $70\%$ be weight". This legislative requirement also resulted in a decrease in the quantity of mineral waste disposed at sea which fell from 290,120 tonnes in 2010 to 111,560 tonnes in 2015.
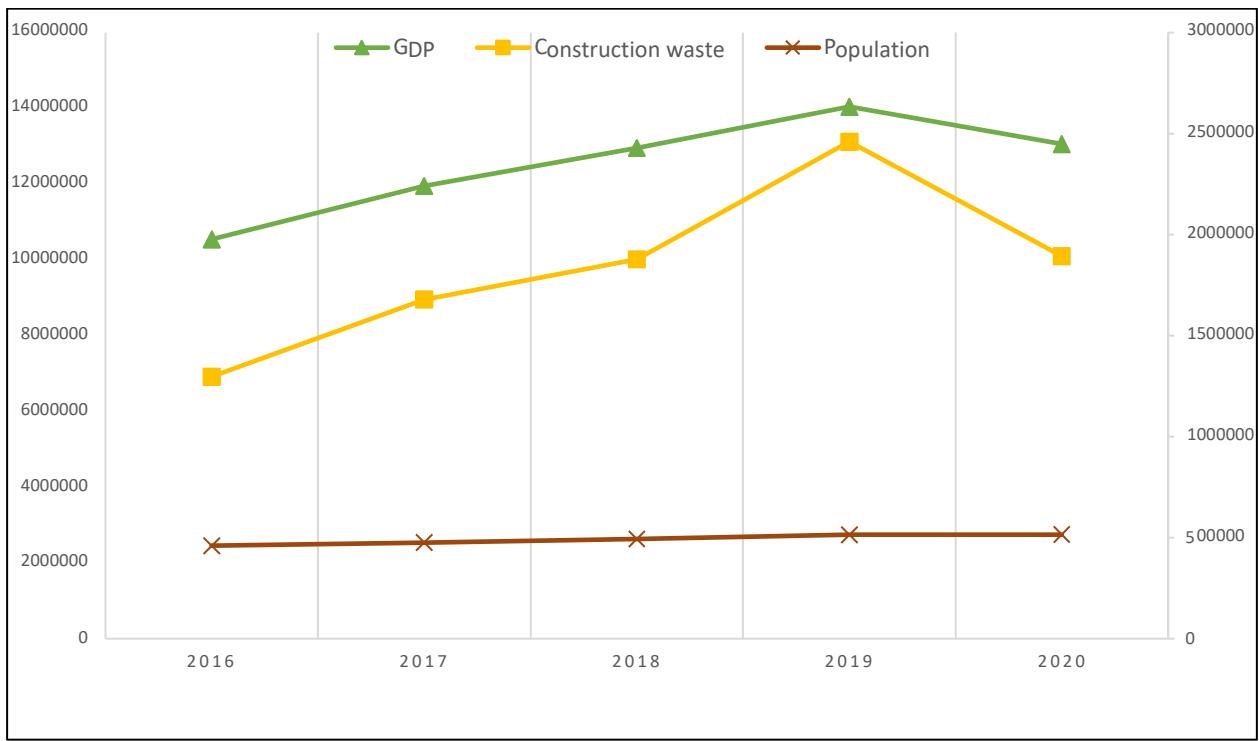
On a national basis, the generation of construction waste depends on the GDP, population and CDW related regulatory measures (Osmani & Villoria-Saez, P., 2019). In Malta, between 2010 and 2020, the building permits issued for residential properties increased continuously particularly between 2015 and 2019, when permits rose from 3,950 to 12,490 respectively. The figure fell to 7,840 in 2020 (Statista, 2022) mainly due to the Covid-19 slow down. Figures for construction waste follow the observed trends in GDP as can be noted in Figure 1.
 Source: National Statistics Office Figure 1: GDP, construction waste and population in Malta between 2016 and 2020
The Construction and Demolition Waste Strategy for Malta 2021-2030 states that waste generation depends on (1) the present level and magnitude of development, (2) excavated material and (3) waste generated from demolishing activities. Furthermore, the strategy seeks to improve on the waste classification and source separation, explore ways of applying the polluter-pays-principle and promote markets for secondary raw materials (ERA & Ministry for the Environment, 2021).
### a) Waste intensity indicators and direct and indirect waste generation
Waste intensity indicators are driving force indicators that demonstrate the response to improved eco-efficiency measures. Since, this research is focused on the production side, the quantity of waste generated is divided by the Gross Value Added (GVA). GVA captures the value, which is added by economic sectors, that is, the cost between the total output of the sector and the cost of intermediate inputs, according to institutional sector (Wieland & Kavonius, 2016) and in view of this, provides a superior measurement of a specific sectoral economic contribution compared to total output (Miller & Blair, 2009).
The notion of multipliers rests upon the difference between—the initial effect caused by an exogenous change in final demand and the total effects of that change. The total effects accounts for both the direct and indirect effects or what is termed as simple multipliers (Miller & Blair, 2009 p.244). The examination of waste multipliers allows for the examination of trends as to which economic sectors have the highest waste multiplier when they experience a 1-million-euro injection and how this injection will impact treatment facilities when the waste generated is reassigned amongst the different treatments available. The direct and indirect waste multipliers are shown in Figure 2 below. The figure shows that direct waste generation is caused mainly by the construction, health care and social work and the other services sectors. Reasons for CDW generation vary, among others, from lack of on-site waste management plans, time pressure, and ordering errors (Osmani & Villoria-Saez, P., 2019). Health care waste, on the other hand, tends to be heavily regulated in view of the that it can be a source of infection, injury, or health related impact. The need for education is particularly felt in this area since there are a lot of misconceptions about what constitutes hazardous waste and what does not. This would be very beneficial in proper infection control and waste reduction (Woolridge & Hoboy, 2019). This is also applicable to Malta where there is a clear need for clarity among healthcare institutions and professionals. Waste management practices need to be established in the daily routine and prioritized through training and education with all staff (Attard Bason, 2015).
All other sectors, while having a negligible contribution to direct waste generation, make an indirect contribution. This means that certain economic sectors like transport, information and communication, financial and insurance real estate, professional, administration, public administration and education do not generate requesting services from the other sectors of waste directly but induce indirect waste generation by production.
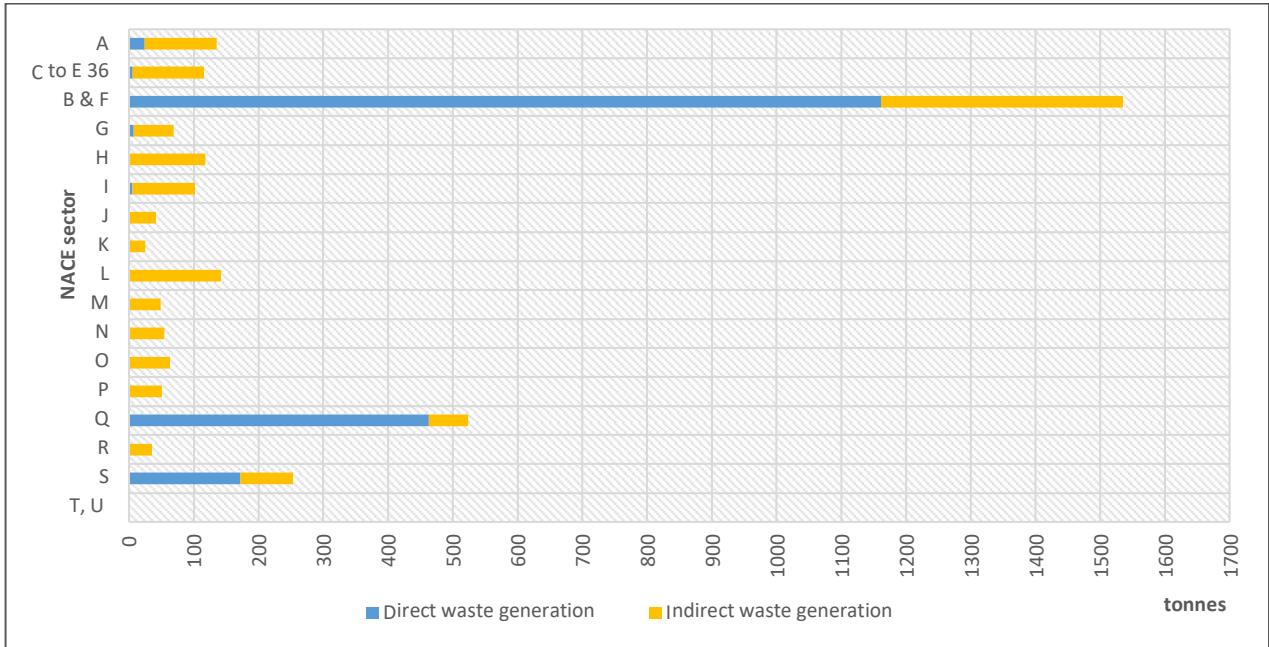 Figure 2: Direct and indirect waste generation based on the SIOT for 2015
Source:Authors' calculations
The results of the waste input-output multipliers are consistent with those of 2010. Shifts are registered both in an upwards and downwards direction, however it should be noted that the relative ranking of the waste input-output multipliers amongst the various sectors does not vary.
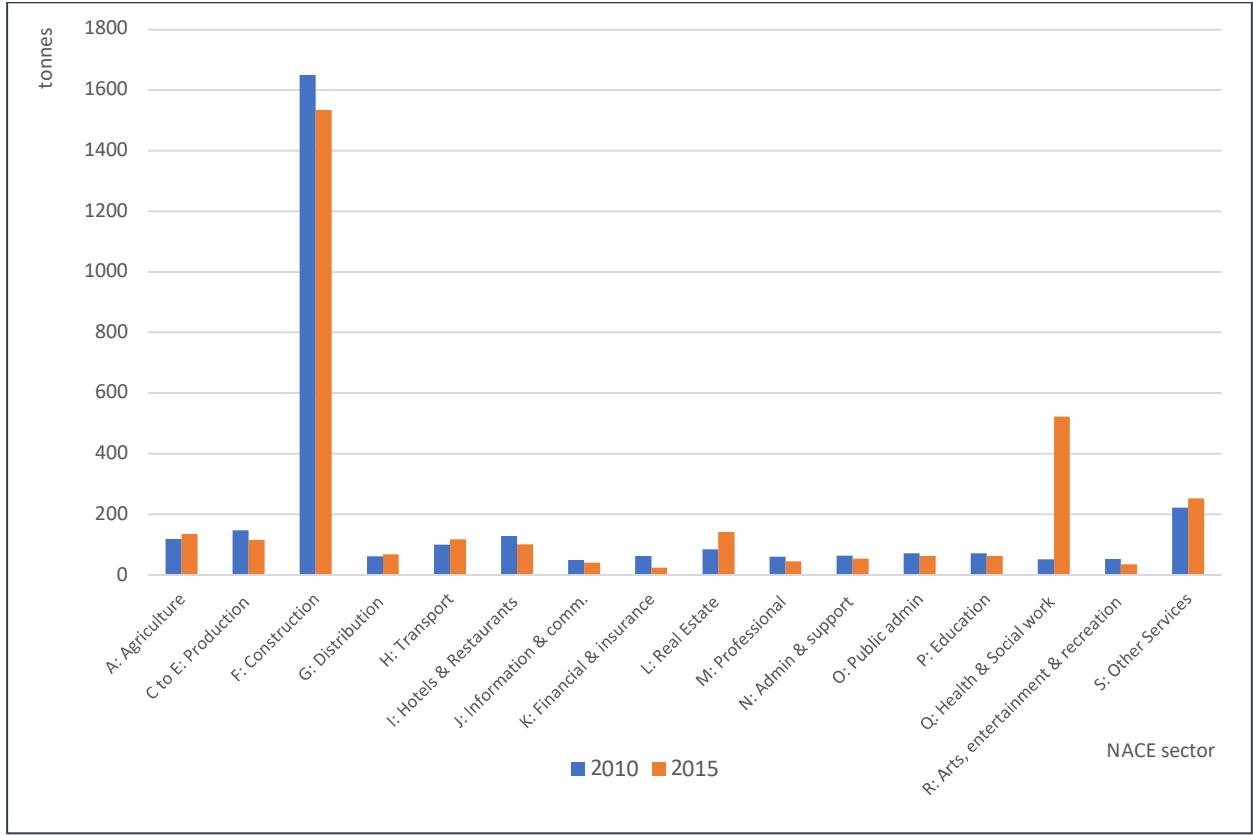 Figure 3: A comparison of waste input-output multipliers on the basis of the SIOTs for 2010 and 2015
Source: Author's calculations
The WIO multipliers display both upward and downward shifts between 2010 and 2015. In some cases, this could signify an improvement in efficiency of industries however it could also show a downward trend in that economic sector or improvements in data collection.
A strong difference can be noted in the Sector Q: Health and Social Work, whereby in 2010 the WIO reached 52.21 while in 2015, the figure amounted to 523.33. While absolute waste generation figures originating from the sector increases to 424 tonnes changes can also be noted in the industry-by-industry input-output table whereby final consumption increased to €769.4 million. In 2015 intermediate demand from other sectors amounted to 15.2 while in 2010 it amounted to 8.9.
The consistently high waste multiplier for the construction sector suggests that not enough effort has been undertaken to reduce the waste generated despite the shift towards recovery and recycling discussed earlier which should be taking place.
## V. CONCLUSION
The research presented here quantifies the waste impact when the economy is injected with €1 million thus providing a more complete picture of economic growth that includes the induced waste repercussions. Direct and indirect quantification of waste generation is one of the strengths of the methodology utilised in this research. This means that while certain industrial sectors might be lauded for low direct waste generation, the impacts of their supply chains cannot be dismissed. A total of eight NACE sectors do not impact waste generation directly but cause considerable impact on indirect waste generation. Therefore, while in national statistics their waste impact is negligible, the WIOA developed in this research study assists in quantifying the real growth registered. The research study therefore makes the case for more widespread economic accounting that accounts for both direct and indirect impact since the cost to treat waste externalities must be deducted from the economic multipliers. This means that the additional growth registered by, for example, the manufacturing industry needs to account for the treatment of 115.72 tonnes of waste. The results and discussion presented should therefore aid policy makers in gaining a deeper understanding of the underlying linkages between sectoral specific production and waste generation and in doing so will hopefully allow for the formulation of more effective industrial policy aimed at mitigating the generation of such externalities.
[^1]: Figure as per News Release NR119/2023 published on July 10, 2023. _(p.2)_
[^2]: The 2010 study was carried out as part of the doctoral research Camilleri Fenech, M. (2020). Understanding Waste Flows. An industrial ecology approach to the generation of waste, its flows and the connection it has with economic shifts. A case study of the Maltese Islands. _(p.2)_
[^4]: Only sectors for which waste generation data is currently available are shown. _(p.3)_
[^5]: $^{5}$ Axiak, V., (2005). An overview of marine dumping activities in Malta including legal, institutional, and technical aspects. https://era.org.pt/en/Documents/OverviewDumpingActivities.pdf $^{6}$ The waste statistics for 2010 were used for a similar unpublished study carried out by the same authors. _(p.4)_
[^7]: Final demand refers to household final consumption together with expenditure of non-profit institution serving household (npish) and government final consumption expenditure, gross capital formation and exports of goods and services (NSO, 2016). _(p.5)_
[^3]: The trade-to-GDP ratio is an indicator of the relative importance of international trade in the economy of a country. It is calculated by dividing the aggregate value of imports and exports over a period by the gross domestic product for the same period. The EU average trade to GDP ratio, for 2021, amounted to $93\%$, with Malta recording the second highest ratio in 2021 (World Bank, 2022). _(p.3)_
Generating HTML Viewer...
References
25 Cites in Article
M Attard Bason (2015). Knowledge, attitude and practice of healthcare waste management in Malta's general hospital.
Margaret Camilleri-Fenech,Jordi Oliver-Solà,Ramon Farreny,Xavier Gabarrell (2018). Where do islands put their waste? – A material flow and carbon footprint analysis of municipal waste management in the Maltese Islands.
Aleksejs Ļeontjevs (2013). Integrated Approach to Taxation Optimisation in Latvia. Doctoral Thesis.
G Sammut,E Sinagra,M Sapiano,R Helmus,P De Voogt (2018). Perfluoroalkyl substances in the Maltese environment – (II) sediments, soils and groundwater.
C,P (2021). Environment and Resources Authority (ERA), & Ministry for the Environment.
C,P (2021). Construction and Demolition Waste Strategy for Malta 2021-2030.
(2014). Malta -Rural Development Programme.
(2020). Construction and demolition waste: challenges and opportunities in a circular economy.
(2021). Construction and demolition waste: challenges and opportunities in a circular economy.
Rhona Smith (2008). Directive 2008/104/EC of the European Parliament and of the Council of 19 November 2008.
A Green (2019). Agricultural waste and pollution.
M Liao,P Chen,H Ma,S Nakamura (2015). Identification of the driving force of waste generation using a high-resolution waste input e output table.
A Malik,M Egan,M Lenzen (2021). Managing sustainability using fi nancial accounting data : The value of input-output analysis.
Ruben Borg (2022). Standards for Recycling Oriented Deconstruction and Classification of Waste.
Antonio Massarutto (2007). Municipal waste management as a local utility: Options for competition in an environmentally-regulated industry.
William Miernyk (2020). Comments on Recent Developments in Regional Input-Output Analysis.
Ronald Miller,Peter Blair (2009). Input-Output Analysis.
Msdec (2014). Waste Managment Plan for the Maltese Islands: A Resource Management Approach 2014-2020.
Mohamed Osmani,Paola Villoria-Sáez (2019). Current and Emerging Construction Waste Management Status, Trends and Approaches.
Ramy Salemdeeb,Abir Al-Tabbaa,Christian Reynolds (2016). The UK waste input–output table: Linking waste generation to the UK economy.
J Santamarta,L Miklin,C Gomes-Nadal,J Rodr,J Rodr,N Cruz-P (2023). Waste Management and Territorial Impact in the Canary Islands.
Dana Chermesh (2020). Residential Permits Issuance and 311 Building Violations complaints.
Paitoon Termsinvanich (2022). Effective factors on application of industrial symbiosis in : case study of Mab-Ta-Phut Industrial Estate.
M Wahlström,J Bergmans,T Teittinen,J Bachér,A Smeets,A Paduart,E Wieland,I Kavonius (2016). Construction and demolition waste: challenges and opportunities in a circular economy.
Explore published articles in an immersive Augmented Reality environment. Our platform converts research papers into interactive 3D books, allowing readers to view and interact with content using AR and VR compatible devices.
Your published article is automatically converted into a realistic 3D book. Flip through pages and read research papers in a more engaging and interactive format.
The search for an economy that is not riddled with externalities is an ongoing one. However, to reach this objective, policy making must shift its focus from the end of pipe solutions and obtain a deeper understanding of the connection that economic development and growth holds with environmental degradation. This study focuses on the connection that the economy holds with waste generation and via the application of the Waste Input Output model, it puts forward estimatesillustrating how a €1-million injection in final demand impacts total waste generation, considering, both direct and indirect production and waste generation effects. The research is based on the Maltese Islands and uses 2015 as a base year. This is in view that the most recent input-output tables published by the national statistics office are built on this year. Results note that the waste generated by the construction industry remains by far the largest with 1,535.07 tonnes generated for every €1 million. Other concerning figures arise from the health and social work and agricultural sectors which result in 523.33 and 135.57 tonnes of waste respectively when there is an injection of 1 million euros.
Our website is actively being updated, and changes may occur frequently. Please clear your browser cache if needed. For feedback or error reporting, please email [email protected]
Thank you for connecting with us. We will respond to you shortly.