Market Basket Analysis is a technique used to analyse the items which are most likely to be purchased together mostly in the retail and economic sector. This technique is especially beneficial for optimization purpose. In this research paper we have used the market basket dataset from the Kaggle repository. This database has been analysed for very well know topic Market Basket Analysis using Python language.
## I. INTRODUCTION
Market Basket Analysis is a valuable tool for businesses seeking to optimize their product offerings, increase cross-selling opportunities, and improve marketing strategies. Market basket analysis can be used to enhance the profitability of any business. Machine Learning is rewarding the retail industry in a unique way. It supports the retail sector in all areas, from predicting sales success to locating customers. Market basket analysis (MBA) is one such top retail application of machine learning. It helps retailers know what products people are purchasing together so that the store/website layout can be designed in the same manner.[^1]
We have followed the below mentioned process for the task of Market Basket Analysis research project
- Gather transactional data, including purchase history, shopping carts, or invoices.
- Analyse product sales and trends.
- Use algorithms like Apriori or FP-growth to discover frequent item sets and generate association rules.
- Interpret the discovered association rules to gain actionable insights.
- Develop strategies based on the insights gained from the analysis.
## II. REVIEW OF LITERATURE
(Chaudhary, S. (2022, February 11) has talked about the importance of Market Basket Analysis in his research; (Stevens, S. (2023, September 7) has talked critically about the Data Analysis implication using Machine Learning; (Simplilearn. (2022, November 22) has discussed about the key components of the Market Basket Analysis; (McColl, L. (2022, March 1) has discussed about the Market Basket Analysis using Python; (How to use market basket analysis for retail and marketing. (2023, December 19) talks about the analysis of Market Basket analysis for retail sector; Overview of market basket analysis. (n.d.) discusses about the overview related to the Market basket analysis; Predoiu, O. (2024, April 2) talks about customer behavior analysis; Elnahla, N. (2021) discusses about Retail lance and its Marketing Implications with reference to Market Basket Analysis.
## III. RESEARCH METHODOLOGY
We have worked on the Quantitative research. The past (historical) research data has been downloaded from the Kaggle repository for analysis. Now this data has been analyzed very effectively using Python language. According to Dawson (2019), a research methodology is the primary principle that will guide your research. It becomes the general approach in conducting research on your topic and determines what research method you will use. A research methodology is different from a research method because research methods are the tools you use to gather your data (Dawson, 2019). You must consider several issues when it comes to selecting the most appropriate methodology for your topic. Issues might include research limitations and ethical dilemmas that might impact the quality of your research.[2]
## IV. DATA ANALYSIS & INTERPRETATION
Even with years of professional experience working with data, the term "data analysis" still sets off a panic button in my soul. And yes, when it comes to serious data analysis for your business, you'll eventually want data scientists on your side. But if you're just getting started, no panic attacks are required.[^3]
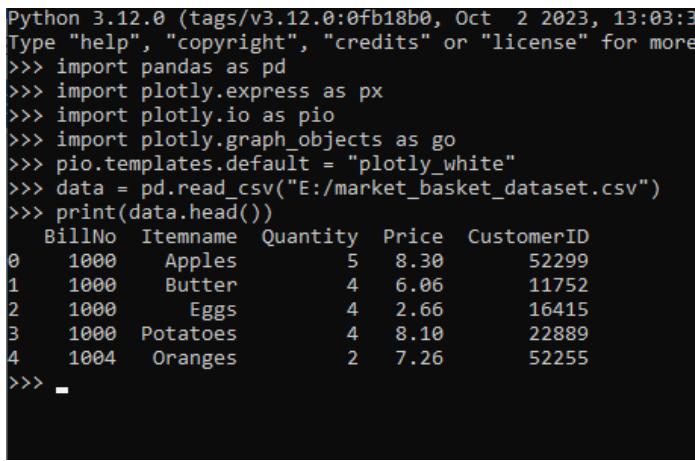 Figure 1: Importing Utilities & Reading Dataset
Figure 1 above shows us steps to import utilities in Python which would be required for our Data analysis.
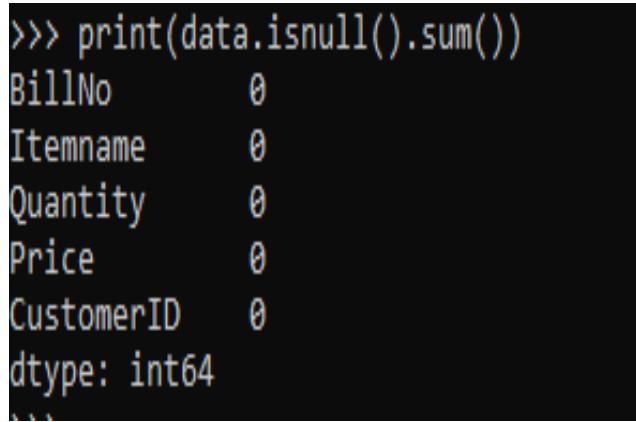 Figure 2: Verification of the Consistency of Data
Figure 2 above shows that we do not have any null data in our dataset.
Further we go ahead to check for Summary Statistics of the dataset as shown below (Figure 3).
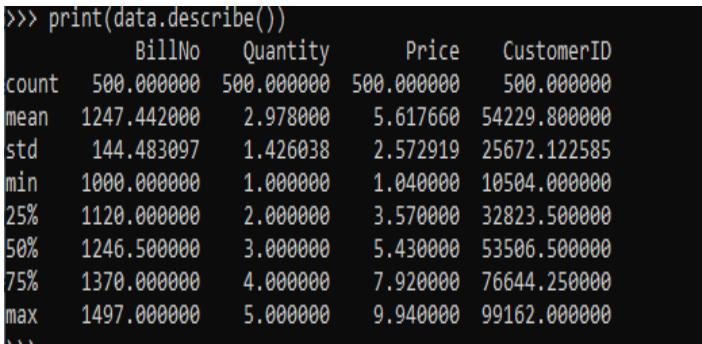 Figure 3: Statistics for the Dataset
Figure 3 above shows the Statistical results of dataset.
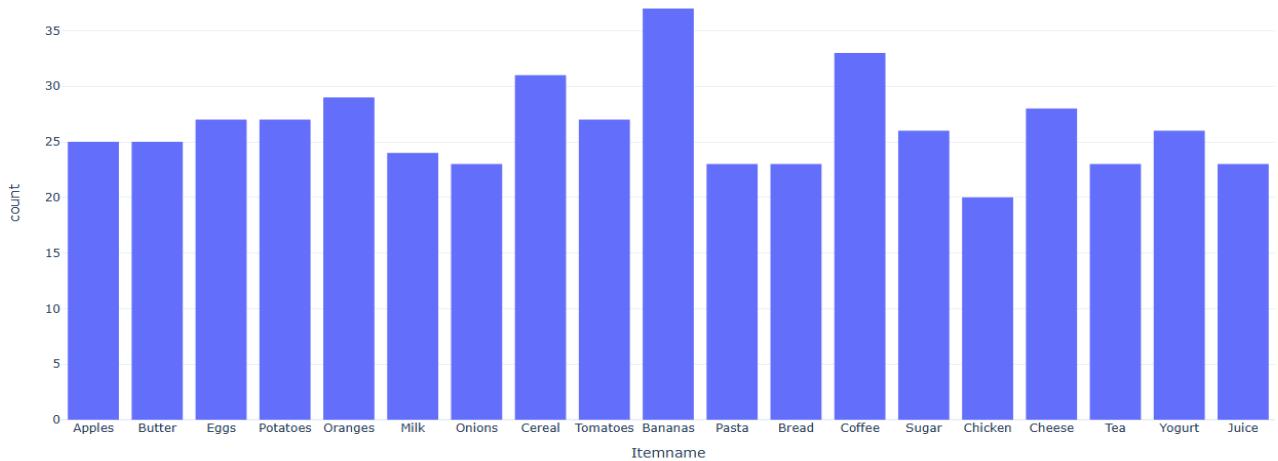
Now let us look at the pictorial representation Sales Distribution of the items as.
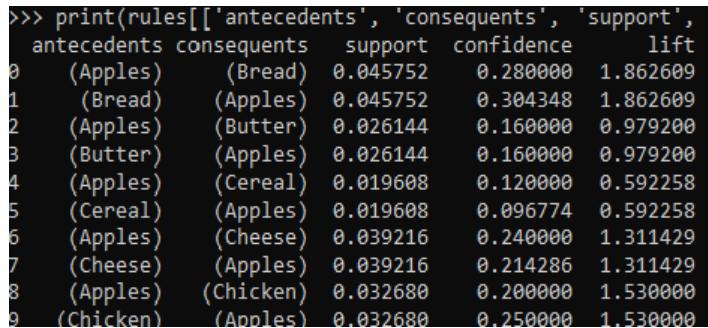 Figure 4: Sales Distribution
- Antecedents: These are the items that are considered as the starting point or "if" part of the association rule. Here is our case we have Bread, Butter, Cheese, and Chicken as the antecedents in our analysis. The entities or "itemsets" produced from the data are called antecedents. To put it another way, it's the IF element on the left. In the situation before, bread serves as the antecedent.[^4]
- Consequent: These are the items that tend to be purchased along with the antecedents or the "then" part of the association rule. The term "consequent" refers to an item or group of items that are encountered along with the antecedent. The THEN part of the sentence is displayed on the right-hand side. The result in the aforementioned case is butter.[^5]
- Support: Support measures how frequently a particular combination of items (both antecedents and consequents) appears in the dataset. It refers to the proportion of transactions in which the items are expected to be bought together. For example, the first rule indicates that Bread and Apples are bought together in approximately $4.58\%$ of all transactions. Support refers to the frequency or occurrence of a specific combination of items in the dataset. Thus indicates frequency of item set appearing in the transactions being analyzed. $^6$
- Confidence: Confidence quantifies the likelihood of the consequent item being purchased when the antecedent item is already in the basket. Alternately it shows the probability of buying the subsequent item wherein the antecedent item is already in the basket. Figure above shows that there is a $30.43\%$ chance of buying Apples when Bread is already kept in the basket after purchase. The probability that a transaction that contains the items on the left hand side of the rule (in our example, pencil and paper) also contains the item on the right hand side (a rubber). The higher the confidence, the greater the likelihood that the item on the right hand side will be purchased or, in other words, the greater the return rate you can expect for a given rule.[^7]
- Lift: Lift measures the degree of association between the antecedent and consequent items,
while considering the baseline purchase probability of the consequent item. If we find a lift with a value greater than 1 then this would indicate a positive association between the antecedent and the consequent item then it would indicate that the items are most likely to be bought together rather than independently. If we obtain a value which is less than 1 then it would indicate a negative association between the two. We can find a lift of 1.86 suggests a positive association between Bread and Apples. Lift is the measure of the effect of purchasing item A on purchasing item B. It is used to determine whether the combination of items has practical value. In other words, it is used to see if the combination of items is purchased more frequently than the individual items. If the value is greater than 1, it means that the combination is effective, while if it is less than 1, it means that it is ineffective.[8]
 Item Distribution Figure 5: Item Distribution
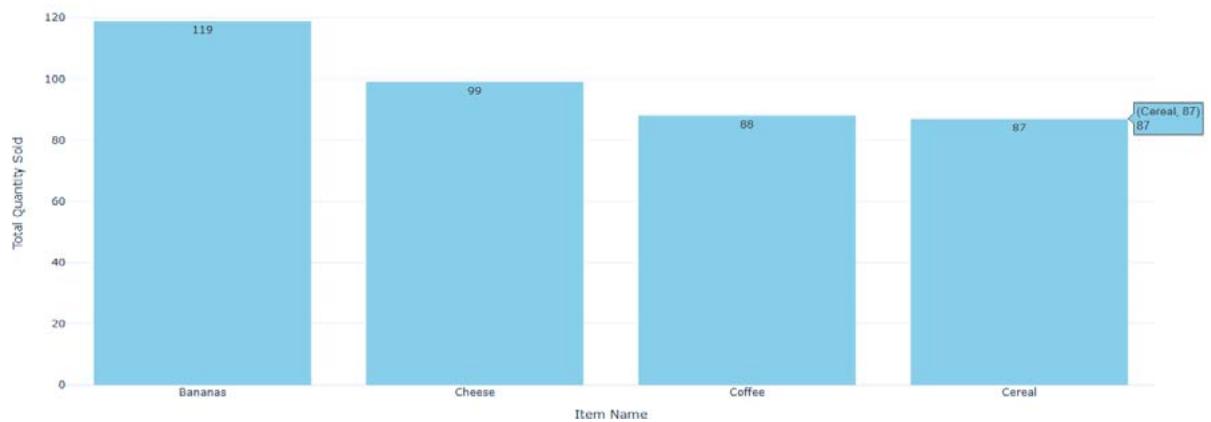 Top 4 Most Popular Items Figure 6: Top four Most Popular Items
It is observed that bananas are the most popular item sold in the store.
Understanding Customer Behavior.
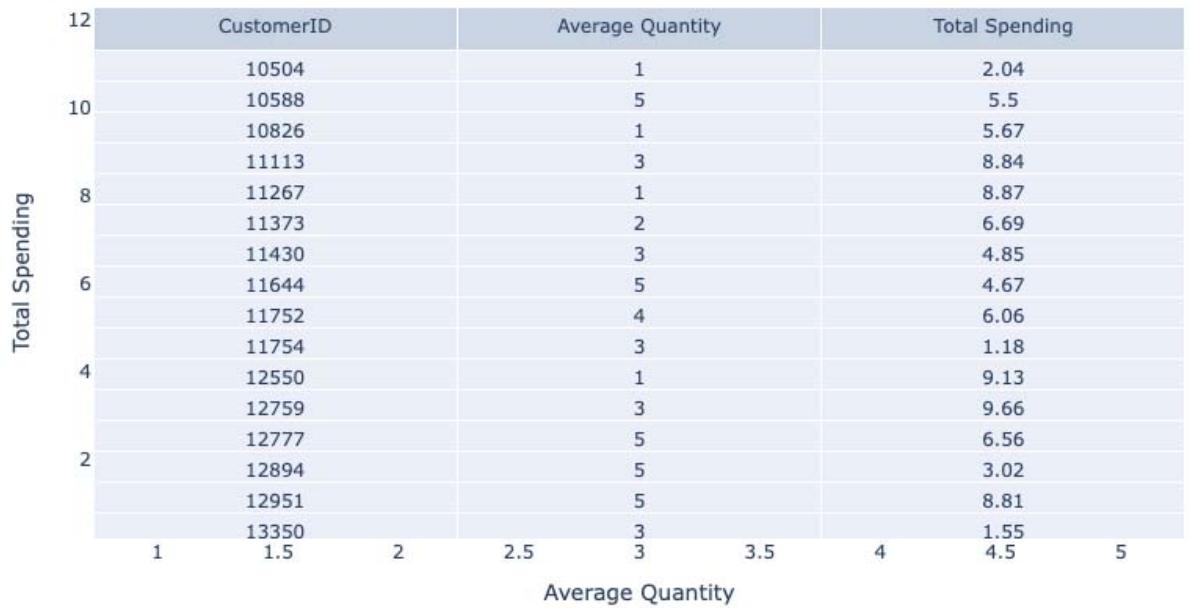 Figure 7: Understanding Customer Behavior
By the term customer behavior, we understand the trends in the buying habits and factors which influence the decision to buy something else along with previous item. Here in Figure 7 above we explore customer behavior by comparing average quantity and total spending. Customer Behavior Analysis represents the study of how people make buying decisions concerning a product, service, and/or organization.[9]
## V. CONCLUSION, IMPLICATIONS, AND SCOPE FOR FUTURE RESEARCH
Henceforth it may be concluded that the historic data can be analyzed very effectively using Python language which is highly flexible and simple. This data analysis would be highly beneficial to end users in terms of decision-making in the future. They can very easily plan out their investment based upon the results that have been obtained with the help of this application. It would help them to have a better decision-making which would result in generating more profits. Since Market Basket Analysis is a highly productive tool to optimize the selling opportunities hence this project becomes utmost important. In the near future we would design a model wherein the predictions can be made beforehand. Artificial intelligence has revolutionized market basket analysis by automating the process of data analysis and rule discovery.[10]
### ACKNOWLEDGEMENT
We would like to express our deepest gratitude to my adviser, Professor Mamta Bansal, for her invaluable guidance and support throughout this research. Her expertise and dedication have been a source of inspiration and motivation.
Generating HTML Viewer...
References
6 Cites in Article
S Chaudhary (2022). Market Basket Analysis in a Time Variant Data Warehouse.
S Stevens (2023). What is data analysis? Examples and how to get started.
Simplilearn (2022). What is market basket analysis? Overview, uses, types, and examples Simplilearn.
Simplilearn (2022). What is market basket analysis? Overview, uses, types, and examples.
Explore published articles in an immersive Augmented Reality environment. Our platform converts research papers into interactive 3D books, allowing readers to view and interact with content using AR and VR compatible devices.
Your published article is automatically converted into a realistic 3D book. Flip through pages and read research papers in a more engaging and interactive format.
Our website is actively being updated, and changes may occur frequently. Please clear your browser cache if needed. For feedback or error reporting, please email [email protected]
Thank you for connecting with us. We will respond to you shortly.