I. INTRODUCTION
The efficient use of water resources is becoming a priority for the countries of Central Asia as well. At the same time, important economic results can be achieved by determining the formation of water resources in rivers and canals and their optimal management. These tasks are carried out on the basis of operating procedures, modern forecasting programs and mathematical and statistical analysis [1, 5].
The Narpay Canal is located in the Samarkand region of the Republic of Uzbekistan, with a total length of 130 km and an irrigated area of 42 thousand hectares. The water sources of the Narpay Canal are the Zarafshan and Karadarya rivers, and sometimes additional water is supplied from the Kattakurgan reservoir. This, in turn, creates great opportunities for the supply of sufficient and reliable water to the sown areas. The Kattakurgan Reservoir is also filled with water through the Zarafshan River. In this article, the analysis and forecasts of the volume of water taken from the water source to the main structure of the Narpay Canal were calculated based on the current state [2].
II. MATERIALS AND METHODS
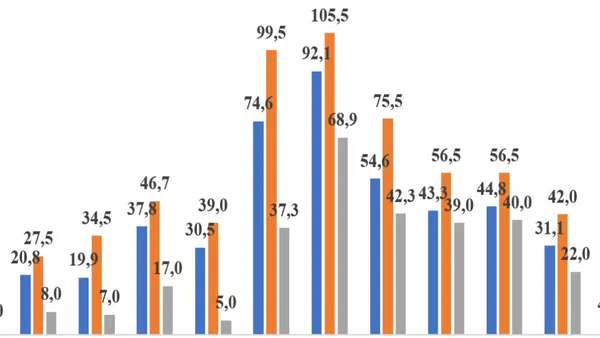
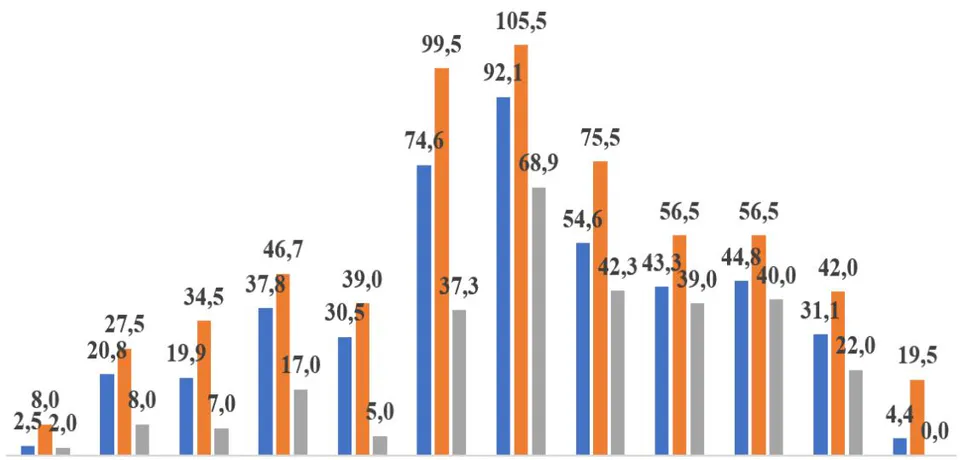
To determine the hydrological regime of the flow in the Narpay Canal, a systematic analysis of 12-year water discharge data from 2010 to 2021 was carried out, and a hydrograph was drawn. One of them is shown in Figure 1. Narpay for 2010-2021 Assessment of flow changes in canals is carried out by determining and assessing the average monthly values of long-term water flow from the water source.
According to Table 1, calculations show that from 2010 to 2021, the Narpay Canal received an average annual flow volume of at a flow rate of . In 2015 and 2018, compared to other years, the water consumption was lower and amounted to 31 cubic meters per second. At the beginning of the Narpay Canal, in June 2016, a maximum discharge of was observed, and again in June 2012, a maximum discharge of . These indicators explain that it was during these months that mudflows were observed or large volumes of water resources were released from the source into the canal. Determination of studies by average water discharge values increases the accuracy of the hydrological regime and allows for obtaining the correct result. Due to the additional supply of water from the Katta-Kurgan Reservoir to the Narpay Canal, the volume of water in the canal will be regulated and sufficient water will be supplied to consumers. The value of the long-term average maximum water discharge varies from to . The average long-term minimum water consumption varied from to . [6].
| Year | Months | Average | ||||||||||||
| 1 | 2 | 3 | 4 | 5 | 6 | 7 | 8 | 9 | 10 | 11 | 12 | |||
| 2021 | Average | 2,5 | 20,8 | 19,9 | 37,8 | 30,5 | 74,6 | 92,1 | 54,6 | 43,3 | 44,8 | 31,1 | 4,4 | 38,0 |
| Max. | 8 | 27,5 | 34,5 | 46,7 | 39 | 99,5 | 105,5 | 75,5 | 56,5 | 56,5 | 42 | 19,5 | 50,9 | |
| Min. | 2 | 8 | 7 | 17 | 5 | 37,3 | 68,9 | 42,3 | 39 | 40 | 22 | 0 | 24,0 | |
| 2020 | Average | 1,9 | 6,9 | 42 | 28 | 37,7 | 73,6 | 74 | 77,5 | 38 | 24,3 | 33,3 | 8,7 | 37,2 |
| Max. | 15 | 16,2 | 61 | 61 | 77 | 79 | 84 | 88,1 | 60,5 | 36 | 54 | 21 | 54,4 | |
| Min. | 0 | 0 | 10,4 | 0 | 0 | 66 | 43 | 60,5 | 22,5 | 19,5 | 2 | 2 | 18,8 | |
| 2019 | Average | 1,2 | 4,6 | 27,2 | 38,9 | 36,7 | 50,4 | 88,4 | 66 | 32,7 | 34,9 | 26,6 | 4,7 | 34,4 |
| Max. | 7 | 8 | 50 | 133 | 66 | 66 | 113,2 | 87 | 42 | 35 | 35 | 9 | 54,3 | |
| Min. | 0 | 0 | 0 | 0 | 9 | 38 | 45,1 | 33,2 | 18,1 | 33,2 | 9 | 0 | 15,5 | |
| 2018 | Average | 5,7 | 0 | 23,9 | 40,6 | 43,5 | 41,1 | 56,6 | 69,2 | 41,5 | 33,7 | 22,5 | 2,2 | 31,7 |
| Max. | 10 | 0 | 48 | 45 | 55 | 47,5 | 64 | 78 | 58 | 42 | 37 | 10 | 41,2 | |
| Min. | 0 | 0 | 0 | 35 | 37,5 | 30,5 | 28,3 | 58,9 | 10 | 10 | 4 | 0 | 17,9 | |
| 2017 | Average | 0,1 | 2,7 | 27,7 | 50,2 | 72,3 | 67,9 | 72,6 | 66,9 | 38,4 | 34,8 | 31,9 | 5,3 | 39,2 |
| Max. | 0,5 | 36,7 | 39,7 | 72 | 84,3 | 83,2 | 95,3 | 87,3 | 53,8 | 40 | 35 | 17 | 53,7 | |
| Min. | 0 | 0 | 6 | 14 | 2,3 | 62,8 | 62,3 | 47,8 | 25,9 | 28 | 20 | 0 | 22,4 | |
| 2016 | Average | 11,4 | 7,8 | 35,4 | 25,7 | 45 | 74,5 | 83,1 | 62,6 | 34,8 | 37,5 | 25,7 | 9,7 | 37,8 |
| Max. | 20,2 | 31,9 | 45 | 38,5 | 73,4 | 150,5 | 109,5 | 78,5 | 41 | 41,5 | 38,5 | 15 | 57,0 | |
| Min. | 0 | 0 | 16,8 | 16 | 30,5 | 45 | 68,5 | 41,5 | 34 | 33,5 | 0 | 0 | 23,8 | |
| 2015 | Average | 0,4 | 0,1 | 19,4 | 35,3 | 34,8 | 55,7 | 72,6 | 53,8 | 41,1 | 34,5 | 17,9 | 7,3 | 31,1 |
| Max. | 2 | 3 | 45 | 45 | 52 | 65,5 | 92 | 68 | 47 | 40 | 25 | 18,7 | 41,9 | |
| Min. | 0 | 0 | 0 | 20 | 26,6 | 35 | 54,6 | 39,8 | 34,8 | 23,5 | 0 | 0 | 19,5 | |
| 2014 | Average | 0,1 | 1 | 31,9 | 32,3 | 40,1 | 72,8 | 71,1 | 47,7 | 43,1 | 45,8 | 21,8 | 3,3 | 34,3 |
| Max. | 2 | 3,5 | 44,5 | 50 | 67 | 88 | 83 | 64,3 | 58,6 | 53,1 | 39,2 | 13 | 47,2 | |
| Min. | 0 | 0 | 2 | 25,1 | 30 | 57,1 | 51,6 | 25,2 | 33,4 | 38,6 | 10 | 0 | 22,8 | |
| 2013 | Average | 0,5 | 0,6 | 26,6 | 37,3 | 51,7 | 76,8 | 80,3 | 73,2 | 46 | 37,8 | 27,7 | 2,7 | 38,4 |
| Max. | 3,8 | 4 | 42,4 | 42,5 | 75,2 | 92,3 | 100,5 | 91,5 | 61,9 | 44 | 34 | 10,5 | 50,2 | |
| Min. | 0 | 0 | 4 | 31,5 | 32,9 | 66,2 | 63,5 | 55 | 20 | 29 | 12,5 | 0 | 26,2 | |
| 2012 | Average | 0,8 | 0,8 | 14,9 | 58,5 | 57,4 | 83,9 | 103,1 | 87,5 | 35,4 | 36,2 | 27,1 | 5 | 42,6 |
| Max. | 4 | 5,1 | 40,5 | 71,1 | 64,6 | 93,9 | 144,5 | 107 | 42 | 38 | 38 | 14,3 | 55,3 | |
| Min. | 0 | 0 | 0 | 6,5 | 32,8 | 62,6 | 73,1 | 33,5 | 29,5 | 30,5 | 14,3 | 0 | 23,6 | |
| 2011 | Average | 0 | 0 | 30,8 | 52,5 | 61,6 | 67,4 | 67,9 | 54,1 | 28,4 | 39 | 16,9 | 1,9 | 35,0 |
| Max. | 0 | 0 | 68,8 | 70,1 | 77,8 | 90,3 | 82,2 | 79,5 | 37,5 | 45 | 39,3 | 5,8 | 49,7 | |
| Min. | 0 | 0 | 0 | 29,8 | 46,8 | 49,8 | 57,2 | 39,8 | 11,4 | 29,6 | 5,8 | 0 | 22,5 | |
| 2010 | Average | 5 | 3,7 | 20,6 | 63,8 | 71,2 | 85 | 79,4 | 77,8 | 44 | 34,8 | 37,3 | 13,7 | 44,7 |
| Max. | 15,5 | 13,5 | 67 | 89 | 89 | 104,5 | 91,4 | 101,5 | 63,5 | 39,5 | 44,5 | 32 | 62,6 | |
| Min. | 0 | 0 | 0 | 41 | 29 | 61,8 | 71,5 | 51 | 31,5 | 17,7 | 32 | 2 | 28,1 | |
| Year | Q Meters. Cubic/S | 1 Year | 1 Day | Min. | Sek. | Annual Water Volume (Billion.Meters.Cubic). |
| 2021 | 38 | 365 | 24 | 60 | 60 | 1,20 |
| 2020 | 37,2 | 365 | 24 | 60 | 60 | 1,17 |
| 2019 | 34,4 | 365 | 24 | 60 | 60 | 1,08 |
| 2018 | 31,7 | 365 | 24 | 60 | 60 | 1,00 |
| 2017 | 39,2 | 365 | 24 | 60 | 60 | 1,24 |
| 2016 | 37,8 | 365 | 24 | 60 | 60 | 1,19 |
| 2015 | 31,1 | 365 | 24 | 60 | 60 | 0,98 |
| 2014 | 34,3 | 365 | 24 | 60 | 60 | 1,08 |
| 2013 | 38,4 | 365 | 24 | 60 | 60 | 1,21 |
| 2012 | 42,6 | 365 | 24 | 60 | 60 | 1,34 |
| 2011 | 35 | 365 | 24 | 60 | 60 | 1,10 |
| 2010 | 44,7 | 365 | 24 | 60 | 60 | 1,41 |
1- The table calculates the volume of water taken into the Narpay Canal in 2010-2021. During these years, a maximum of 1.41 billion cubic meters of water flowed into the canal from a minimum of 0.98 billion cubic meters. The results show that there are no sharp changes in the volume of water flow in the annual calculation. In low-water years, a current water deficit of up to or 150 million cubic meters can be observed. The table shows that the recurrence of low-water years occurs once every 3 or 4 years. Water resources in the Narpay, Kattakurgan, and Pakhtachi districts of the Samarkand region are supplied through this canal in an average of 1.1 billion cubic meters per year.
III. RESULTS
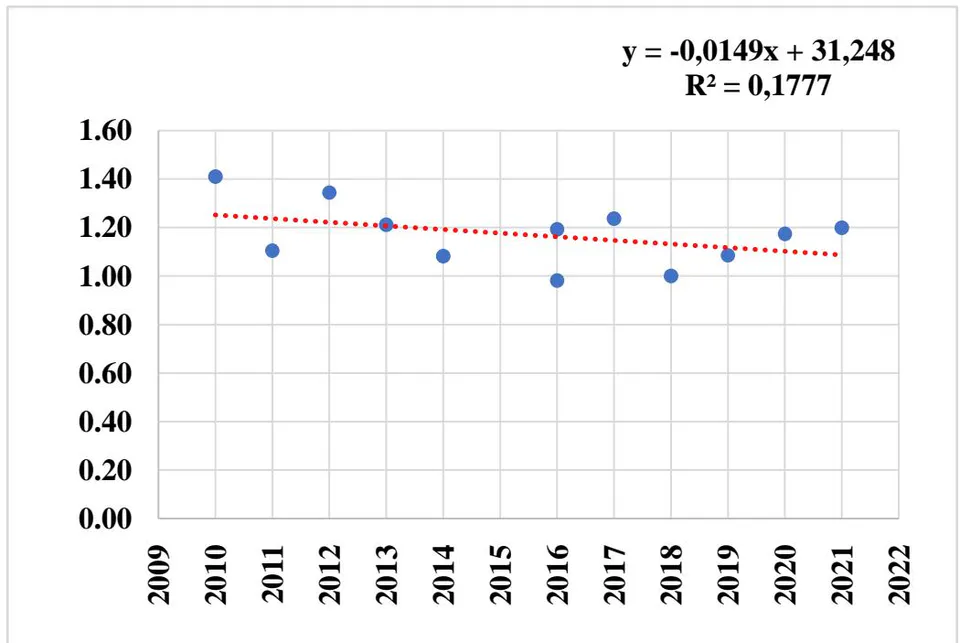
Based on the results of the calculated water volume of the Narpay Canal for 2010-2021 in Table 2, a graph of Figure 2 is drawn. This graph, representing the change in water volume over the years, has a linear functional relationship and obeys the following equation [4, 7].
where, the U axis represents water volume, and the X axis represents years.
Based on this equation 1, it is possible to determine the forecast of the volume of water formed and drawn into the Narpay Canal in the future. Currently, several programs for forecasting the formation of water resources are also used in practice. However, there are also statistical and mathematical methods for forecasting the formation of water resources. Using this method, we forecast the flow volume for any subsequent years. For example, for 2025, it is determined as follows.
| Years | Forecast, Water Volume, W, | Years | Forecast, Water Volume, W | Years | Forecast, Water Volume, W |
| 2025 | 1,0755 | 2035 | 0,9265 | 2045 | 0,7775 |
| 2026 | 1,0606 | 2036 | 0,9116 | 2046 | 0,7626 |
| 2027 | 1,0457 | 2037 | 0,8967 | 2047 | 0,7477 |
| 2028 | 1,0308 | 2038 | 0,8818 | 2048 | 0,7328 |
| 2029 | 1,0159 | 2039 | 0,8669 | 2049 | 0,7179 |
| 2030 | 1,001 | 2040 | 0,852 | 2050 | 0,703 |
| 2031 | 0,9861 | 2041 | 0,8371 | 2051 | 0,6881 |
| 2032 | 0,9712 | 2042 | 0,8222 | 2052 | 0,6732 |
| 2033 | 0,9563 | 2043 | 0,8073 | 2053 | 0,6583 |
| 2034 | 0,9414 | 2044 | 0,7924 | 2054 | 0,6434 |
IV. CONCLUSION
According to Figure 2 and Table 3, according to the red lines, the change in the annual water volume is decreasing. Table 3 presents forecasts for the period up to 2054. This table also shows a decrease in water volume in the future. By 2054, the annual flow volume will be 0.64 billion cubic meters. After 30 years, in 2054 there will be a decrease in water volume by 0.43 billion cubic meters or at least compared to 2025. For the years after 2030, a maximum annual water volume of up to 1 billion cubic meters will be formed at this facility and will not exceed it.
These analyses were calculated using statistical and mathematical methods. In this case, if the laws of nature continue in this direction, these forecasts are considered valid in cases where there is no clear influence from the human factor or other factors.
At the minimum and average water flow of the canal, a decrease in water pressure in the middle and lower parts of the canal and an increase in the time of water delivery are observed, in these conditions, it is advisable to constantly introduce the procedure for alternating water intake from internal irrigation networks and sources.
In accordance with the procedures for the operation of canals, it is advisable to steadily regulate the level in the canal through water-retaining, outlet, and intake networks.
During the period of temporary suspension of water flow in the Narpay Canal in the autumn and winter, during the non-vegetation period, it is necessary to carry out measures to clean and strengthen the banks and channel. During this period, there is no need to supply water to water consumers. In this case, the canals are prepared for the growing season.
Using this mathematical method, it is possible to predict the formation of water resources in water sources.
ACKNOWLEDGEMENT
This research is carried out based on the applied sciences grant of the Ministry of Water resource of the Republic of Uzbekistan No. 10/2024. Authors would like to thank to the Ministry for the financial support of the project.