This paper applies the Elastic Net Machine Learning technique to choose the variables that best represent the characteristics of mobile internet use in Brazil. We use regularized models to estimate the importance of a large number of variables, including socioeconomic attributes, internet and device utilization patterns, and digital skills to explain (a) access to the internet through mobile devices and (b) choice of mobile data plan. After identifying the most important variables, we estimate their marginal effects on the two dependent variables with nonlinear econometric models. The results suggest that socioeconomic characteristics and user skills have significant explanatory power in both estimations. Specifically, barriers such as age, income, and skill gaps persist, hindering inclusive mobile internet adoption. Conditional on mobile internet use, these characteristics are more common among postpaid internet data plan subscribers. Moreover, communication skills like messaging and social media use stand out regarding internet access, whereas internet utilization patterns (on the move and at work) have high explanatory power in the data plan choice.
Funding
No external funding was declared for this work.
Conflict of Interest
The authors declare no conflict of interest.
Ethical Approval
No ethics committee approval was required for this article type.
Data Availability
Not applicable for this article.
Dr. Philipp Ehrl. 2026. \u201cUnderstanding Mobile Internet Access and Data Plan Choice in Brazil: A Machine Learning Approach\u201d. Global Journal of Human-Social Science - E: Economics GJHSS-E Volume 25 (GJHSS Volume 25 Issue E1): .
## I. INTRODUCTION
M oBILE broadband internet and the liberalization of telecommunications markets have played a significant role in the growth of access to information and communication technologies (ICTs) since the 1990s. This technological development changed the patterns of internet usage and communication, both in the private and business domain. Governments worldwide seek to increase internet adoption among the population because it contributes to economic (Olumekor et al. 2024), social, educational (Chen et al. 2024), and environmental sustainability (Aljebreen et al. 2023). In particular, mobile internet use is highly popular in developing countries as it is easier and less expensive compared to a landline and a personal computer (Wu et al. 2023). Sustainable ICT use is really a key to development because permeates all sectors of the economy. In this context, digital skills are important for employment and daily life, as well as for an increasingly digital future, where individuals need to be able to use ICTs (International Telecommunication Union 2018). Thus, connectivity can be seen as a driver of economic development and a tool to empower people and communities in a sustainable way.
The number of internet users worldwide has been growing at a rapid pace. While in 2003, only $12\%$ of the world's population was using the internet, this share rose to $53.6\%$, or 4.1 billion people, in 2019 according to data from the World Telecommunications/ICT Indicators Report. The same source reports that mobile phone subscriptions reached approximately 8.3 billion in 2019. Most countries in Latin America are above the global average in terms of ICT usage. Table 1 shows that $88\%$ of people in Brazil use mobile phones, followed by Colombia $(85.2\%)$ and Paraguay $(84.3\%)$. Regarding internet and computer usage by the population during the same period, Brazil ranks third $(70.4\%)$ and fourth $(38.6\%)$ respectively. These numbers indicate that progress has been made, but there is still clearly room to increase internet adoption in Brazil and many other developing countries.
Table 1: Percentage of Individuals using Cell Phones, Internet and Computers
<table><tr><td></td><td>Brazil</td><td>Colombia</td><td>Paraguay</td><td>Argentina</td><td>Peru</td><td>Uruguay</td><td>Bolivia</td></tr><tr><td>Cell phone</td><td>88.0</td><td>85.2</td><td>84.3</td><td>81.2</td><td>80.7</td><td>76.7</td><td>69.7</td></tr><tr><td>Internet</td><td>70.4</td><td>64.1</td><td>65.0</td><td>74.3</td><td>52.5</td><td>74.8</td><td>44.3</td></tr><tr><td>Computer</td><td>38.6</td><td>44.9</td><td>23.4</td><td>44.8</td><td>31.6</td><td>54.4</td><td>29.7</td></tr></table>
A key question for businesses and policymakers is how to sustain the growth of internet access and the expansion of an increasingly inclusive information society. Although there are several studies on the determinants of (mobile) internet adoption, most of them highlight socio-economic factors such as income, education, age, or gender (Martínez-Dominguez and Mora-Rivera 2020; Vimalkumar et al. 2021).
This research investigates in how far internet access has progressed in Brazil and what factors most hinder a continued and inclusive mobile internet adoption. The present study stands out from the previous literature because we take a more holistic approach and include a large number of socioeconomic variables (67), as well as a large set of indicators for internet and device utilization patterns, and digital skills. We rely on the Elastic Net Machine Learning technique to identify which variables have the highest explanatory power regarding individuals' internet use via cell phone. After identifying the most important attributes, we use econometric techniques to quantify the marginal effect of the selected variables on mobile internet access using nonlinear models. These results reveal which factors still hinder the expansion of mobile internet access.
Since the type of mobile phone contract determines whether internet is used and if so how, we also study the variables that indicate who opts for the prepaid modality. We use rich micro data before the COVID-19 Pandemic (2014 to 2018) from Brazil called the Household ICT Survey which measures the ownership and use of Information and Communication Technologies by Brazilian citizens. Based on this nationally representative survey, we apply Machine Learning (ML) such as the Elastic Net regularization techniques to select the variables and estimate the significance of each attribute in explaining mobile internet access and mobile data plan choice. In the present context, a Machine Learning approach is particularly suited to deal with the large amount of microdata and the high dimensionality of explanatory variables (Athey 2019). ML also has significant advantages in using data to select functional forms flexibly, as well to estimate and compare alternative models. Finally, the process of repeated cross validation is useful to reduce overfitting and increase consistency. To the best of our knowledge, no other study has applied the proposed ML methods to the context of mobile internet adoption and mobile plan choice.
The data suggest that the socio-economic characteristics of internet users are decisive in their mobile internet access. For example, older individuals are more likely to not access the internet through mobile phones and do not have prepaid phone services. The differences across population groups also seem to be related to digital illiteracy as well as personal income.
The skills with the highest explanatory power for having mobile internet access are sending text messages, searching information, and using social media. Stimulating and facilitating the access to these services is thus likely to increase mobile internet adoption among the groups of the population which are not well-inserted in the digital world thus far. Skills, however, are less relevant regarding the choice of mobile data plan type. Socioeconomic characteristics like age and income as well the pattern of use (on the move and at work) are closely related to having a postpaid mobile internet plan.
Our findings are in line with Riggins and Dewan (2005) who argue that the existence of a 'digital divide' among countries, i.e. the gap between those who have widespread access to ICTs (such as personal computers and the internet) and those who do not, may primarily be attributed to differences in income and educational levels. Although, policy makers are well aware of the pronounced regional disparities that are highly persistent (Ehrl and Monasterio 2019, 2024) and specific programs seem to have some effect but are still rather slow to reach income conversion, if ever (de Almeida et al. 2021; Ehrl et al. 2022). These findings are also observed in the context of mobile internet and in a variety of different countries Chen (2021); Demoussis and Giannakopoulos (2006); Martínez-Dominguez and Mora-Rivera (2020); Vicente and López (2011). Yet, controlling for these attributes and many others, we find that gender and race are not among the most influential drivers of mobile internet adoption, as argued by Wong et al. (2020), Chen (2021) and many others. Ochoa et al. (2022) adds that employment, location, and housing characteristics are also important drivers of mobile internet adoption in West Africa.
Van Deursen and van Dijk (2018) note that with internet connectivity rates reaching high levels in recent years, research attention on the digital divide has shifted from indicators related to internet access (referred to as the first-level digital divide) to indicators of the second-level digital divide, which includes skills and internet use. Within this context, several empirical studies highlight the relationship between the internet use pattern and the socio-demographic characteristics explored in first-level digital divide studies (Araujo and Reinhard 2019; Martínez-Dominguez and MoraRivera 2020). Chen (2021) includes the interesting aspect of social network effects and finds that having more connections in social media platforms increases mobile internet usage, which is in line with our observations. The digital divide and the unequal access of mobile internet adoption is relatively little researched, see the recent survey by Lythreatis et al. (2022). Digital skills, however, were analyzed in related contexts such as of adoption of mobile financial services (Kiconco et al. 2019) and mobile learning Mac Callum and Jeffrey (2013).
Our paper complements findings from Brazil by Nishijima et al. (2017), Araujo and Reinhard (2019), and
Silva et al. (2020) who also use microdata and estimate logistic models to explain internet and cell phone usage. Silva et al. (2020) highlight that during economic crises families attempt to replace home internet access with more economical alternatives. Additionally, especially families with low income and education levels experience a negative impact on internet access rates due to the economic crisis. Nishijima et al. (2017) focus on internet access and mobile phone property and observe that income and education have a much larger explanatory power than personal attributes such as age or ethnicity. Araujo and Reinhard (2019) and Martínez-Dominguez and Mora-Rivera (2020) is among the few studies that relate digital skills to age and gender, however, without estimating their specific for mobile internet adoption.
Overall, the various approaches to studying sustainable internet access by families reveal an empirical challenge that is overcome in the present paper: selecting which variables to consider in applied works that best represent the characteristics of internet users. Most papers make a pre-selection of a few variables, although having more information available in the data set. This selection is usually based on a gap in the literature but without discussing the influence of alternative (similar) options. By using ML techniques we avoid much of the pre-selection of variables and let the data indicate which attributes are most relevant for explaining the access of internet though the mobile phone and the choice of mobile data plan.
Apart from this introduction, this paper is divided into four more sections. In the second section, we discuss related literature. Section three presents the data and methodology used in this research. The fourth section contains the results, and the fifth section provides conclusions and possibilities for future research.
## II. RELATED LITERATURE
The use of the internet became widespread just over 20 years ago. Although the price of internet usage plans and the necessary devices have been decreasing sharply, the access to internet is still far from universal. The existence of a 'digital divide' that varies across countries and population groups is well documented by a variety of papers.
Regarding barriers to digital access, Dutton et al. (2005), LaRose et al. (2012), Chen (2021) show that people are less likely to use the internet if they are older, belong to an ethnic minority, are female, do not have children, or are from disadvantaged areas. Other studies that reinforce the relationship between inequalities in ICT access and income and education which hinder a sustainable growth of internet adoption include Demoussis and Giannakopoulos (2006), Nishijima et al. (2017), and Silva et al. (2020). This study follows these papers by adopting personal income, education, and other individual characteristics such as ethnicity and age to the list of potential determinants of ICT access.
Affordability can be considered a first-level divide that still requires careful attention of researchers. van Deursen and van Dijk (2018) indicate that is problem continues even in the wealthiest and technologically advanced countries in the world. Moreover, the authors stress that ongoing expenses such as maintenance, software, and subscriptions also should not be neglected. The use of internet via cellphone offers poor families affordable access, and it is unsurprisingly very popular in developing countries (Marler 2018). Although, connected low income groups have a less pleasant experiences and obtain worse outcomes using the internet according to Gonzales (2015). Our research adopts these insights by considering that the type of internet plan (prepaid vs more expensive options) is an important aspect of internet usage.
Skills can be considered a second-level divide that pose even more subtle difficulties to exploit the benefits of ICT (Adamczyk et al. 2024; Ehrl and Monasterio 2024; Gonzales 2015). A variety of different measures can be found in the literature. Van Deursen and Van Dijk (2014) even include skills as one of the four stages of internet access: motivation, physical access, digital skills, and use. These authors consider digital skills to be divided into six types: operational, formal, informational, communication, content creation, and strategic skills. According to these authors, digital skills are essential for living in the information society, which includes economic, educational, political, social, cultural, and institutional participation. Technical skills are obviously required to use the internet and the skill proficiency varies by the type devices people are using (Araujo and Reinhard 2019; Martínez-Dominguez and Mora-Rivera 2020). The former paper observes that Brazilians who access the internet using both computers and mobile devices exhibit the highest level of digital skills. Interestingly, Martínez-Dominguez and Mora-Rivera (2020) find that entertainment and communication services are used more intensively by people aged 65 years and older. Education seems to have little impact on the type of internet utilization. Similar to these papers, we exploit self-reported activities by internet users as a proxy for digital skills.
Van Deursen and Van Dijk (2011) suspected that the unequal distribution of digital skills in the Dutch population may be one of the causes for the disparities in internet access. Part of the reasoning behind that conclusion is that although computers, mobile phones, and internet access itself has become gradually more affordable, part of the population, especially the elderly and very young remain unconnected. Eynon and
Geniets (2016) exploit interviews with a small group of youth and find that limited experience and support networks contribute to the lack of skill acquisition. Chohan and Hu (2022) show that government-sponsored digital competency training programs can reduce the digital divide. One of the few examples that directly link digital skills to ICT (including internet adoption) is Yu et al. (2017) who find evidence in favor of a relevant connection, as in the present case.
Dutton and Reisdorf (2017) highlight that attitudes and values of internet users and non-users have been added more recently as key variables shaping internet engagement. Similarly, Eynon (2009) specifically investigates the digital divide in terms of education and learning, and finds that $91\%$ of people with a positive attitude towards ICT are internet users. Dasgupta et al. (2005), Vicente and Lopez (2011), and Zhang (2013) show that cultural and geographic characteristics are also related to opportunities for ICT access and use among individuals in different EU countries. Such differences may be responsible for the large variations in mobile phone usage across countries observed by Vimalkumar et al. (2021).
## III. METHODOLOGY
### a) Data
This research uses microdata from 2014 to 2018 that stems from the TIC Survey, which is an annual survey conducted by the Regional Center for the Study of Information Society Development (Cetic), operating under the sponsorship of UNESCO. Cetic is the executive branch of the Internet Management Committee in Brazil (CGI), responsible for coordinating and integrating internet services and is composed of members from the government, the business sector, and the academic community. The TIC Household Survey uses concepts and definitions contained in the Manual for Measuring ICT Access and Use by Households and Individuals published by the International Telecommunication Union (ITU). Data is collected through structured questionnaires with closed-ended questions and predefined responses (single or multiple answers). This database does not track a fixed set of individuals over time, which prevents the use of panel techniques.
The TIC Survey is subdivided into two main groups: households and individuals. For this research, we use individual-level microdata. We consider individual characteristics such as personal income, education, gender, age group, and race. We also consider the use of mobile phones and users' internet skills. We analyze the type of payment plan for individuals who have a mobile phone (prepaid or postpaid), taking into account the equipment used for internet access, the location where internet was used, users' communication-related skills, information-seeking skills, operational skills, as well as users' skills when accessing the internet via mobile phones. Skills are measured based on a set of binary proxies representing online activities performed by internet users in the last three months.
Table 2 presents summarized statistics of the dependent and independent variables used in the study, including the number of observations (N), the frequency of occurrence. This table provides a description of the entire set of variables studied.
The two dependent variables of interest are internet access via mobile phones and the type of payment plan for individuals who have a mobile phone (prepaid or postpaid). Variables related to devices used (3.3), location of use (3.4), and internet usage skills (3.5; 3.6; and 3.7) are questions from the TIC Survey related to internet use, while variables related to operational skills with mobile phones (3.8) refer only to mobile phone use.
<table><tr><td>Variable/Categories</td><td>obs.</td><td>share (%)</td></tr><tr><td colspan="3">DEPENDENT VARIABLES</td></tr><tr><td>Used the internet on a cell phone?</td><td>86,682</td><td></td></tr><tr><td>Yes</td><td>57,650</td><td>66.51%</td></tr><tr><td>Prepaid plan?</td><td>80,695</td><td></td></tr><tr><td>Yes</td><td>62,479</td><td>77.43%</td></tr><tr><td colspan="3">DEMOGRAPHIC CHARACTERISTICS</td></tr><tr><td>Age Groups:</td><td>101,364</td><td></td></tr><tr><td>Male</td><td>46,414</td><td>45.79%</td></tr><tr><td>Ethnicity skin color:</td><td>98,832</td><td></td></tr><tr><td>White</td><td>37,148</td><td>37.59%</td></tr><tr><td>Black</td><td>14,403</td><td>14.57%</td></tr><tr><td>Brown</td><td>26,431</td><td>26.74%</td></tr><tr><td>Yellow</td><td>19,074</td><td>19.30%</td></tr><tr><td>Indigenous</td><td>1,776</td><td>1.</td></tr></table>
Table 2: Summary Statistics of Analyzed Variables <table> <tr><td>Variable/Categories</td><td>obs.</td><td>share (%)</td></tr> <tr><td colspan="3">DEMOGRAPHIC CHARACTERISTICS</td></tr> <tr><td>Someone else's home:</td><td>58,508</td><td></td></tr> <tr><td>Yes</td><td>32,483</td><td>55.52%</td></tr> <tr><td>Public free access center:</td><td>58,508</td><td></td></tr> <tr><td>Yes</td><td>8,284</td><td>14.16%</td></tr> <tr><td>Private access center:</td><td>58,508</td><td></td></tr> <tr><td>Yes</td><td>6,502</td><td>11.11%</td></tr> <tr><td colspan="3">INFORMATION SEEKING SKILLS</td></tr> <tr><td>Product or services:</td><td>58,450</td><td></td></tr> <tr><td>Yes</td><td>33,816</td><td>57.85%</td></tr> <tr><td>Health or services:</td><td>58,450</td><td></td></tr> <tr><td>Yes</td><td>24,274</td><td>41.53%</td></tr> <tr><td>Travel or accommodation:</td><td>58,458</td><td></td></tr> <tr><td>Yes</td><td>16,5</td><td>24.82%</td></tr> <tr><td colspan="3">COMMUNICATION SKILLS</td></tr> <tr><td>Sending or receiving e-mails:</td><td>58,409</td><td>59.01%</td></tr> <tr><td>Yes</td><td>34,470</td><td>59.01%</td></tr> <tr><td>Sending instant messages:</td><td>58,475</td><td>88.65%</td></tr> <tr><td>Yes</td><td>51,837</td><td>88.65%</td></tr> <tr><td>Talking by voice or video:</td><td>58,437</td><td>57.41%</td></tr> <tr><td>Yes</td><td>33,546</td><td>57.41%</td></tr> <tr><td>Participating in social networks:</td><td>58,455</td><td>75.63%</td></tr> <tr><td>Yes</td><td>44,208</td><td>75.63%</td></tr> <tr><td>Participating in lists or discussion forums:</td><td>58,308</td><td>10.20%</td></tr> <tr><td>Yes</td><td>5,945</td><td>10.20%</td></tr> <tr><td>Using microblogs (Twitter):</td><td>58,221</td><td>8.76%</td></tr> <tr><td>Yes</td><td>5,100</td><td>8.76%</td></tr> </table> Tables continues on the next page
<table> <tr><td>Variable/Categories</td><td>obs.</td><td>share (%)</td></tr> <tr><td colspan="3">DEMOGRAPHIC CHARACTERISTICS</td></tr> <tr><td>Someone else's home:</td><td>58,508</td><td></td></tr> <tr><td>Yes</td><td>32,483</td><td>55.52%</td></tr> <tr><td>Public free access center:</td><td>58,508</td><td></td></tr> <tr><td>Yes</td><td>8,284</td><td>14.16%</td></tr> <tr><td>Private access center:</td><td>58,508</td><td></td></tr> <tr><td>Yes</td><td>6,502</td><td>11.11%</td></tr> <tr><td colspan="3">INFORMATION SEEKING SKILLS</td></tr> <tr><td>Product or services:</td><td>58,450</td><td></td></tr> <tr><td>Yes</td><td>33,816</td><td>57.85%</td></tr> <tr><td>Health or services:</td><td>58,450</td><td></td></tr> <tr><td>Yes</td><td>24,274</td><td>41.53%</td></tr> <tr><td>Travel or accommodation:</td><td>58,458</td><td></td></tr> <tr><td>Yes</td><td>16,5</td><td>24.82%</td></tr> <tr><td colspan="3">COMMUNICATION SKILLS</td></tr> <tr><td>Sending or receiving e-mails:</td><td>58,409</td><td>59.01%</td></tr> <tr><td>Yes</td><td>34,470</td><td>59.01%</td></tr> <tr><td>Sending instant messages:</td><td>58,475</td><td>88.65%</td></tr> <tr><td>Yes</td><td>51,837</td><td>88.65%</td></tr> <tr><td>Talking by voice or video:</td><td>58,437</td><td>57.41%</td></tr> <tr><td>Yes</td><td>33,546</td><td>57.41%</td></tr> <tr><td>Participating in social networks:</td><td>58,455</td><td>75.63%</td></tr> <tr><td>Yes</td><td>44,208</td><td>75.63%</td></tr> <tr><td>Participating in lists or discussion forums:</td><td>58,308</td><td>10.20%</td></tr> <tr><td>Yes</td><td>5,945</td><td>10.20%</td></tr> <tr><td>Using microblogs (Twitter):</td><td>58,221</td><td>8.76%</td></tr> <tr><td>Yes</td><td>5,100</td><td>8.76%</td></tr> </table> Tables continues on the next page
<table><tr><td>Variable/Categories</td><td>obs.</td><td>share (%)</td></tr><tr><td colspan="3">CELL PHONE OPERATIONAL SKILLS</td></tr><tr><td>Used cell phone to make or receive calls:</td><td>86,714</td><td></td></tr><tr><td>Yes</td><td>82,759</td><td>95.44%</td></tr><tr><td>Used cell phone to send or receive text messages (SMS):</td><td>86,618</td><td></td></tr><tr><td>Yes</td><td>44,310</td><td>51.16%</td></tr><tr><td>Used cell phone to listen to music:</td><td>86,662</td><td></td></tr><tr><td>Yes</td><td>52,162</td><td>60.19%</td></tr><tr><td>Used cell phone to watch videos:</td><td>86,647</td><td></td></tr><tr><td>Yes</td><td>47,311</td><td>54.60%</td></tr><tr><td>Used cell phone to play games:</td><td>86,640</td><td></td></tr><tr><td>Yes</td><td>30,152</td><td>34.80%</td></tr><tr><td>Used cell phone to take photos:</td><td>86,683</td><td></td></tr><tr><td>Yes</td><td>57,416</td><td>66.24%</td></tr><tr><td>Used cell phone to use maps:</td><td>86,579</td><td></td></tr><tr><td>Yes</td><td>27,643</td><td>31.93%</td></tr><tr><td>Used cell phone to access email:</td><td>86,595</td><td></td></tr><tr><td>Yes</td><td>34,169</td><td>39.46%</td></tr><tr><td>Used cell phone for social networks:</td><td>86,628</td><td></td></tr><tr><td>Yes</td><td>45,249</td><td>52.23%</td></tr><tr><td>Used cell phone to access websites:</td><td>86,580</td><td></td></tr><tr><td>Yes</td><td>38,523</td><td>44.49%</td></tr><tr><td>Used cell phone to download apps:</td><td>86,564</td><td></td></tr><tr><td>Yes</td><td>38,636</td><td>44.63%</td></tr><tr><td>Used cell phone to search for information on Google:</td><td>86,574</td><td></td></tr><tr><td>Yes</td><td>42,911</td><td>49.57%</td></tr><tr><td>Used cell phone to share photos, videos, or texts:</td><td>86,616</td><td></td></tr><tr><td>Yes</td><td>46,420</td><td>53.59%</td></tr><tr><td>Used cell phone to send text messages (WhatsApp, Skype):</td><td>86,630</td><td></td></tr><tr><td>Yes</td><td>52,422</td><td>60.51%</td></tr></table>
### b) Regularization ML methods
To select the variables with the highest explanatory power among the attributes listed in table 2, we used ML regression techniques, where the dependent variable is either the binary indicator for 'internet use on the cell phone during the last three months', or 'having a prepaid mobile data plan'.
An appropriate choice among the diverse ML methods to advance the present research question is
$$
- \left[ \frac{1}{N} \sum_i \sum_t y_{it} \left(\beta_0 + X_{it}'\beta\right) - \log\left(1 + e^{\beta_0 + X_{it}'\beta}\right) \right] + \lambda \left[ (1 - \alpha) \|\beta\|_2^2 / 2 + \alpha \|\beta\|_1 \right] \tag{1}
$$
where $t$ represents one of the $N$ individuals in the sample in year $t$. $\mathbb{D}$ is the vector with the parameters to be estimated of the explanatory variables $X$, as defined further below. $\lambda$ can take values between 0 and $\infty$, so that it is the regularization parameter penalizing the model's complexity. When $\lambda = 0$ the regularization is turned off and the estimation of $\pmb{\theta}$ is as in ordinary logistic models. $\alpha$ controls the combination of two basic regularization methods. When $\alpha = 0$ the equation takes the form of the Ridge model, and when $\alpha = 1$, the Elastic Net collapses to the pure Lasso model. Both $\alpha$ and $\lambda$ are known as the tuning parameters. The parameter estimates of $\alpha$, $\lambda$, and $\beta$, i.e. the minimization of eq. (1), is obtained through Maximum Likelihood estimation.
Zakharov and Dupont (2011) highlight the following advantages of the Elastic Net estimation over the common binary logistic regression. (1) It avoids binary classification using penalized logistic regression. For this purpose, we employed the Elastic Net regularization technique, which comprises Lasso and Ridge models. The two latter techniques are also known as shrinkage methods used to address the issue of high relative variance in predictions. Our Elastic Net regularization model is set to minimize the following cross-entropy function for binary dependent variables
overfitting in the sense that outliers can cause some attributes to have relatively large weights, so that small changes in the values of these attributes lead to significant changes in the model's prediction. (2) The Lasso penalty forces coefficients of relatively irrelevant variables to become exactly zero, thus producing sparse models. Given the large number of attributes considered in our estimation, a selection of important variables reduces the complexity of the model's interpretation. (3) The combination of Lasso and Ridge regularization reduces instability problems regarding Lassos' variable selection.
The explanatory variables are combined linearly but differ between the two dependent variables, as follows. For the indicator 'internet use on the cell phone during the last three months', three types of explanatory variables are used such that $X$ can be represented as:
$$
X _ {i t} ^ {\prime} \beta = \beta_ {1} T _ {t} + \beta_ {2} S E C _ {i t} + \beta_ {3} C P O _ {i t} \tag {2}
$$
The vector $T_{t}$ represents a temporal trend that captures how the dependent variable evolves over time. The vector $\mathsf{SEC}_{it}$ represents individuals' socio-economic To predict the indicator variable 'having a prepaid mobile data plan', the linear part can be represented as:
$$
X _ {i t} ^ {\prime} \beta = \beta_ {1} T _ {t} + \beta_ {2} S E C _ {i t} + \beta_ {3} C P O _ {i t} + \beta_ {4} C _ {i t} + \beta_ {5} I _ {i t} + \beta_ {6} O _ {i t} + \beta_ {7} H _ {i t} + \beta_ {8} P _ {i t} \tag {3}
$$
where $T_{t}$, $SEC_{it}$, and $CPO_{it}$ are defined as in eq. (2). The variables in $C_{it}$, $I_{it}$, and $O_{it}$ represent the communication, information seeking, and operational skills of individuals, respectively, see table 2. The variable $H_{it}$ represents the devices used to access the internet in the last three months, $P_{it}$ refers to the location of internet use.
### c) Estimation Procedure for Tuning Parameters
To estimate the models, we used the statistical program R. Following common practice in the application of the Elastic Net regularization method, we randomly divided the sample into a training set (70% of total observations) and a test data set (30%) (Mehta et al. 2019).
The Elastic Net pre-model is estimated with the training data set using the cvglmnet algorithm to firstly characteristics: personal income, education level, gender, age group, and skin color/ethnicity. $CPO_{it}$ represents individuals' cell phone operational skills.
data plan', the linear part can be represented as:
select $\lambda$ for given values of $\alpha = 0.5$, as is standard in the literature. In this process we used the repeated cross-validation method $K$ -fold $^{+1}$. The $K$ -fold cross-validation randomly divides the data into $k$ blocks of approximately equal size. To train the model $k-1$ blocks are used, and one is left out. This separate block is used for predictions that are summarized in performance measures (for example, accuracy measures). The resulting $k$ performance estimates are averaged to obtain the overall resampled estimate (Kuhn et al. 2013). The repeated cross validation method $K$ -fold $^{+1}$ performs the same procedure as $K$ -fold, but more than once. In the case of five repetitions and ten cross-validations, this would result in 50 total resamplings. The $\lambda$ with the best precision results in 0.00013 for the dependent variable "used internet on cell phone" and is equal to 0.00035 for "prepaid type data plan.
Based on these initial values for $\lambda$, we use the expand.grid command and vary both $\alpha$ and $\lambda$ in sequential steps of 0.1 for the range [0,1] and 0.0001 in the range [0,0.001], respectively, to find the model estimates with the highest accuracy overall. Again the repeated cross validation method $K$ -fold $^{+1}$ is applied with
$k = 10$ folds, with repetitions of five times for each process. The performance of the regularization model is also evaluated using the AIC (Akaike Criterion) and the area above the ROC (Receiver Operating Characteristic) curve. The summary of the results from this evaluation presented in table 3 indicates that the estimations are fairly accurate.
Table 3: Estimated Tuning Parameters and Performance
<table><tr><td>dependent var.:</td><td>Mobile Data on Cell Phone</td><td>Prepaid Plan</td></tr><tr><td># of θ coefficients</td><td>33</td><td>62</td></tr><tr><td>λ</td><td>0.0006</td><td>0.0009</td></tr><tr><td>α</td><td>1</td><td>0.4</td></tr><tr><td>accuracy</td><td>0.961</td><td>0.748</td></tr><tr><td>precision</td><td>0.511</td><td>0.513</td></tr><tr><td>AIC</td><td>12,506</td><td>43,186</td></tr><tr><td>ROC</td><td>0.990</td><td>0.714</td></tr></table>
## IV. RESULTS
### a) Variable Selection
Figures 1 and 2 show the estimated coefficients of the 20 variables with the highest explanatory power relative to the highest coefficient estimate in each model for the two dependent variables, respectively, according to the Elastic Net technique described in the previous section. Note that in the present case the coefficients of a model are directly comparable among each other because all of the explanatory variables are created as binary indicators. We will (arbitrarily) focus on the 20 most important variables in order to keep the interpretations traceable.
The attribute "used cell phone to send text messages" is the most important predictor for "internet access via cell phone", followed by "used cell phone for social networks" and "used cell phone to search for information on Google". The dominance of skill based measures is striking given that large parts of the literature highlighted the importance of socio-economic characteristics. Notwithstanding, age and education also appear among the list of the 15 most important characteristics for internet access via cell phone. The general effects of internet access in specific years are also among this list, confirming results from Silva et al. (2020) regarding the impact of business cycles on individual internet connections and affordability. Finally, the two highest income level groups rank at the bottom of our 20 selected variables in figure 1.
Figure 2 shows that the attribute "age group [60 years and above]" is the variable with the highest explanatory power regarding the decision between a prepaid or more flexible and expensive postpaid mobile data plan. Other age groups, income groups, year indicators are among the top 10 most important variables from this model. The remaining selected variables in figure 2 comprise indicators for the location of internet use, race/ethnicity, education, and information seeking and cell phone operating skills. Given the dominance of the latter in the previous model, it is rather surprising to see that the various skill measures under analysis seem to affect the mobile plan choice much less than the use of internet on the cell phone in general.
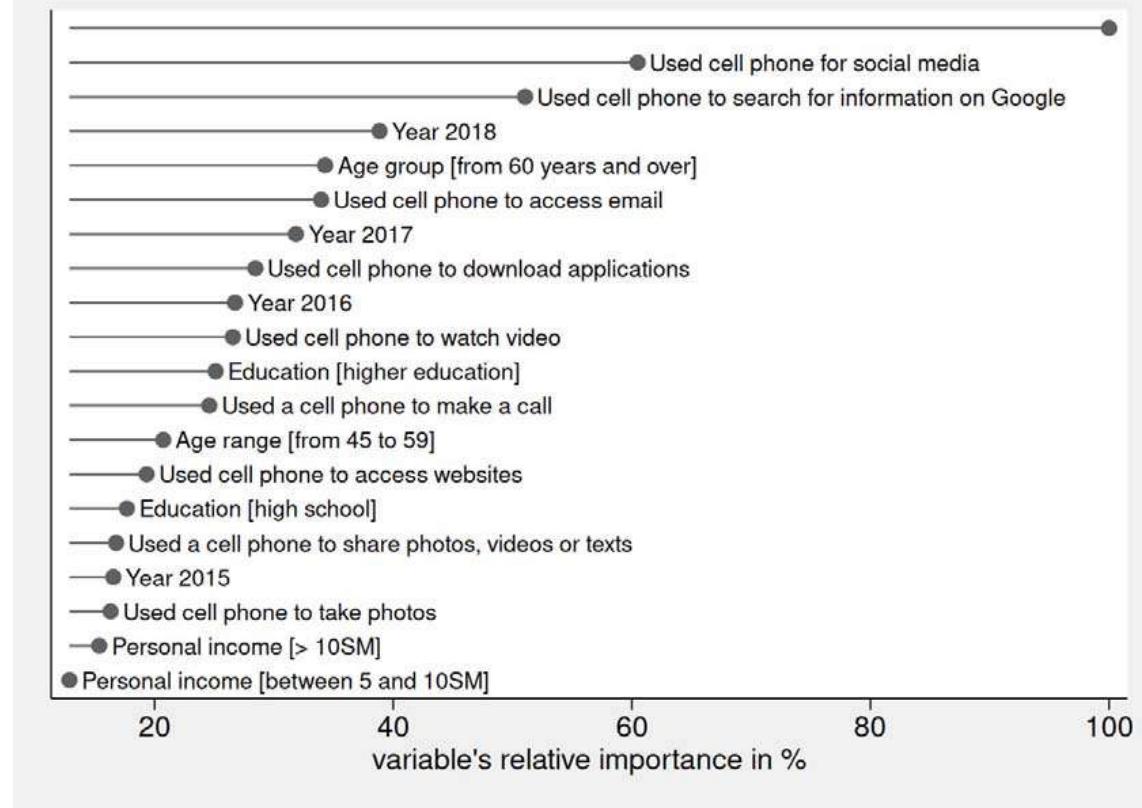 Figure 1: The 20 Most Relevant Variables for "internet access via cell phone"
Note: The figure displays the coefficient estimates relative to the highest coefficient estimate from equations 1 and 2 using the Elastic Net model where the dependent variable is the indicator for "internet access via cell phone". The variable with the highest explanatory power, which is represented by the first horizontal bar in the chart, is "used cell phone to send text messages".
### b) Marginal Effects of Selected Variables
Based on the 20 variables with the highest explanatory power presented in figures 1 and 2, we select these variables and add the remaining categories for age, income, education, race/ethnicity and year. The estimated coefficients from the logistic model can be transformed into marginal effects to facilitate interpretations. As neither the logistic nor the Elastic Net model account for the potential endogeneity of the explicable variables, the marginal effects do not have a causal interpretation.
Table 4 shows that, compared to the year 2014 (the omitted base variable), the probability of using the internet via cell phone increases over the years, with the exception of 2015. This observation is reasonable given that the Brazilian economy was formally in recession between 2014 and 2016, with growth rates below $-4\%$ (Silva et al. 2020). In times of crisis, there tends to be a decrease in employment and, consequently, in family consumption levels, which may provoke a reduction in telecommunications services expenses. Furthermore, the data suggests that the probability of internet access via cell phone decreases with age. The estimated coefficient for the group of individuals aged 60 and above is equal to -2.031, which corresponds to a marginal effect of -6.4 percentage points.
Communication technology has the potential to benefit older adults by promoting their independence and increasing their ability, but still, older adults are less likely to adopt new technologies (Heinz et al. 2013). Silva et al. (2020) highlight that elder Brazilians are frequently characterized by low digital literacy. Along the same lines, Riggins and Dewan (2005) and Scheerderet al. (2017) and Litt (2013) also find a negative relationship between internet usage and age.
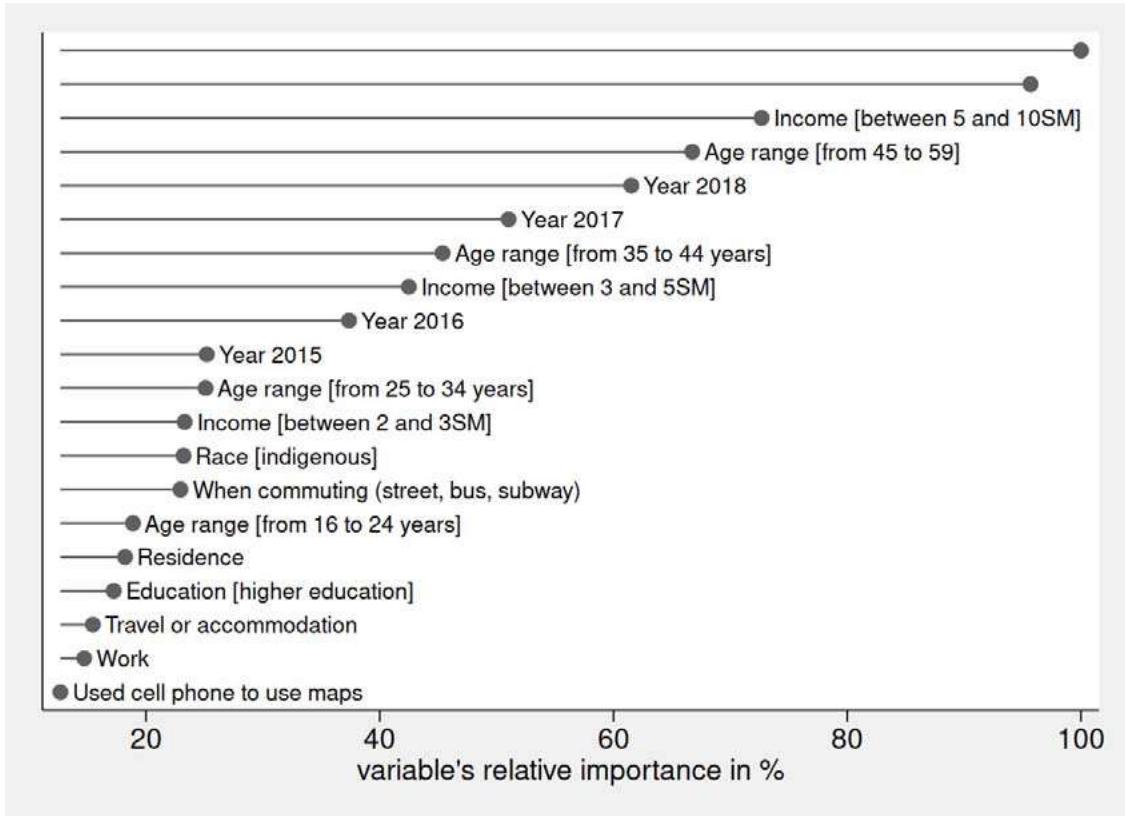 Figure 2: The 20 Most Relevant Variables for "prepaid mobile data plan"
Note: The figure displays the coefficient estimates relative to the highest coefficient estimate from equations 1 and 3 using the Elastic Net model where the dependent variable is the indicator for "prepaid mobile data plan". The variables with the highest explanatory power, which are represented by the first and second horizontal bars in the chart, are "age group [60 years and above]" and "income above 10SM", respectively, where SM is the Brazilian acronym for the official minimum wage.
Table 4 indicates that individuals with no income or up to two time the minimum wage (SM) have roughly the same probability of access internet via cell phone, which is significantly higher among individuals with large income levels. For individuals with personal income between 2 and 3 minimum wages, the estimated coefficient is equal to 0.259, which corresponds to a marginal effect of 0.8 percentage points (p.p.).
Table 4: Logit Estimation – "internet access via cell phone"
<table><tr><td>Year 2015</td><td>-0.548***</td><td>(0.069)</td></tr><tr><td>Year 2016</td><td>1.196***</td><td>(0.063)</td></tr><tr><td>Year 2017</td><td>1.389***</td><td>(0.066)</td></tr><tr><td>Year 2018</td><td>1.683***</td><td>(0.068)</td></tr><tr><td>Age range [from 16 to 24 years]</td><td>-0.652***</td><td>(0.109)</td></tr><tr><td>Age range [from 25 to 34 years]</td><td>-0.959***</td><td>(0.105)</td></tr><tr><td>Age range [from 35 to 44 years]</td><td>-1.177***</td><td>(0.105)</td></tr><tr><td>Age range [from 45 to 59]</td><td>-1.510***</td><td>(0.101)</td></tr><tr><td>Age group [from 60 years and over]</td><td>-2.031***</td><td>(0.106)</td></tr><tr><td>Personal income [up to 1SM]</td><td>-0.036</td><td>(0.061)</td></tr><tr><td>Personal income [between 1 and 2SM]</td><td>0.120*</td><td>(0.068)</td></tr><tr><td>Personal income [between 2 and 3SM]</td><td>0.259***</td><td>(0.093)</td></tr><tr><td>Personal income [between 3 and 5SM]</td><td>0.548***</td><td>(0.124)</td></tr><tr><td>Personal income [between 5 and 10SM]</td><td>0.728***</td><td>(0.188)</td></tr><tr><td>Personal income [> 10SM]</td><td>0.726**</td><td>(0.286)</td></tr><tr><td>Education [elementary education]</td><td>0.370***</td><td>(0.070)</td></tr><tr><td>Education [high school]</td><td>0.905***</td><td>(0.077)</td></tr><tr><td>Education [higher education]</td><td>1.246***</td><td>(0.126)</td></tr><tr><td>Used cell phone to send text message</td><td>3.718***</td><td>(0.056)</td></tr><tr><td>Used cell phone to search for information on Google</td><td>1.935***</td><td>(0.090)</td></tr><tr><td>Used cell phone to access email</td><td>1.332***</td><td>(0.092)</td></tr><tr><td>Used cell phone to watch video</td><td>0.971***</td><td>(0.055)</td></tr><tr><td>Used a cell phone to make a call</td><td>-0.857***</td><td>(0.071)</td></tr><tr><td>Used cell phone to access websites</td><td>0.913***</td><td>(0.110)</td></tr><tr><td>Used a cell phone to share photos, videos or texts</td><td>0.608***</td><td>(0.065)</td></tr><tr><td>Used cell phone to take photos</td><td>0.638***</td><td>(0.045)</td></tr><tr><td>Used cell phone for social media</td><td>2.395***</td><td>(0.078)</td></tr><tr><td>Used cell phone to download applications</td><td>1.065***</td><td>(0.088)</td></tr><tr><td>Observations</td><td>79,669</td><td></td></tr><tr><td>Log Likelihood</td><td>-8,930.565</td><td></td></tr><tr><td>AIC</td><td>17,919.13</td><td></td></tr></table>
This relationship increases with income and for those with ten or more minimum wages the average marginal effect is equal to 2.29 percentage points. On the one hand, higher income provides people with more consumption opportunities. On the other hand, the observed effect may be partly explained by the fact that higher income is related to the professional obligation to use ICTs on the cell phone. This may be related to the fact that higher income means more likely individuals to have access to higher education and, in turn, have access to consumer goods in the area of information and communication technology. Higher socioeconomic status is also positively related with digital competence (Araujo and Reinhard 2019). Nishijima et al. (2017), Coelho et al. (2019), and Silva et al. (2020) previously reported that that income is one of the main determinants of access to ICTs. The lowest level of education (0 to four years of schooling) is used as the reference category so that the positive estimated coefficients of the remaining three education categories indicate that internet access via cell phone becomes more likely with the years of schooling. For individuals with secondary education and higher education the marginal effect is equal to 2.85 p.p. and 3.92 p.p., respectively.
The remaining variables in table 4 represent digital skills. Having operational and communication skills is positively related to the probability of internet access via cell phone. It is interesting to note that the only negative coefficient is observed for the ability to actually make a 'call' so that the use of this elementary function does not really represent an abnormality. For example, those who exchange instant messages, use social networks, search for information on Google, access their email, and download applications have a ceteris paribus 11.72, 7.55, 6.10, 4.19, and 3.35, percent higher probability of accessing the internet via cell phone, respectively. Sharing photos, however, has a relatively low marginal effect (1.91 p.p.).
Table 5 presents the estimated coefficients of the logistic model, considering the dependent variable "type of payment plan to access the internet via cell phone" where the value 1 corresponds to a prepaid plan and 0 to a postpaid one. Prepaid plans are characterized by a limited amount of data allowance, lower probability of having zero-rating applications included, and they are more affordable. It is coherent that prepaid plans are much more frequent in Brazilian federal states in the North and Northeast regions where per capita income and wage levels are lower (Caldeira et al. 2023; Ehrl and Monasterio 2021; Schiavon and Moreira 2022). This type of payment plan, is still predominant in Brazil, according to data from the responsible national regulatory agency ANATEL.
Table 5 shows that having a prepaid mobile data plan steadily became less frequent over time. The marginal effect for the year 2018 indicates that, compared to the base year 2014, prepaid internet plans decreased by 13.45 p.p. In fact, the National Telecommunications Agency reports a similar number of 11.6 million $(+13.3\%)$ new postpaid lines in 2018. The number of accesses per billing modality, compared to 2017, reduced by 12.73 p.p. for prepaid, while in the postpaid modality it increased by 11.46 p.p. $^{1}$. These observations point to the growing importance that people attribute to internet services and potent data packages.
Table 5: Logit Estimation – "prepaid mobile data plan"
<table><tr><td>Year 2015</td><td>-0.325***</td><td>(0.041)</td></tr><tr><td>Year 2016</td><td>-0.499***</td><td>(0.043)</td></tr><tr><td>Year 2017</td><td>-0.684***</td><td>(0.042)</td></tr><tr><td>Year 2018</td><td>-0.800***</td><td>(0.042)</td></tr><tr><td>Age range [from 16 to 24 years]</td><td>-0.416***</td><td>(0.068)</td></tr><tr><td>Age range [from 25 to 34 years]</td><td>-0.534***</td><td>(0.069)</td></tr><tr><td>Age range [from 35 to 44 years]</td><td>-0.832***</td><td>(0.070)</td></tr><tr><td>Age range [from 45 to 59]</td><td>-1.121***</td><td>(0.069)</td></tr><tr><td>Age group [from 60 years and over]</td><td>-1.548***</td><td>(0.077)</td></tr><tr><td>Personal income [up to 1SM]</td><td>0.085**</td><td>(0.039)</td></tr><tr><td>Personal income [between 1 and 2SM]</td><td>-0.087**</td><td>(0.040)</td></tr><tr><td>Personal income [between 2 and 3SM]</td><td>-0.414***</td><td>(0.047)</td></tr><tr><td>Personal income [between 3 and 5SM]</td><td>-0.677***</td><td>(0.053)</td></tr><tr><td>Personal income [between 5 and 10SM]</td><td>-1.082***</td><td>(0.067)</td></tr><tr><td>Personal income [> 10SM]</td><td>-1.347***</td><td>(0.108)</td></tr><tr><td>Education [elementary education]</td><td>0.148</td><td>(0.103)</td></tr><tr><td>Education [high school]</td><td>0.138</td><td>(0.103)</td></tr><tr><td>Education [higher education]</td><td>-0.225**</td><td>(0.107)</td></tr><tr><td>Race [black]</td><td>0.138***</td><td>(0.036)</td></tr><tr><td>Race [brown]</td><td>0.159***</td><td>(0.029)</td></tr><tr><td>Race [yellow]</td><td>0.155***</td><td>(0.038)</td></tr><tr><td>Race [indigenous]</td><td>0.281***</td><td>(0.105)</td></tr><tr><td>Use internet @Residence</td><td>-0.261***</td><td>(0.049)</td></tr><tr><td>Use internet @Work</td><td>-0.233***</td><td>(0.027)</td></tr><tr><td>Use internet on the move</td><td>-0.287***</td><td>(0.024)</td></tr><tr><td>Book travel or accommodation</td><td>-0.203***</td><td>(0.026)</td></tr><tr><td>Used cell phone to use maps</td><td>-0.206***</td><td>(0.026)</td></tr><tr><td>Observations</td><td>47,858</td><td></td></tr><tr><td>Log Likelihood</td><td>-24,505.42</td><td></td></tr><tr><td>AIC</td><td>49,066.84</td><td></td></tr></table>
Young individuals aged 10 to 15 years are the age group with the highest probability to have a prepaid mobile data plan. The estimated marginal effect for the group of people aged 60 years and above indicates a 26.03 p.p. lower probability of having a prepaid plan. A similar pattern is observed with respect to income and
education. People in the upper and middle class are more likely to possess a postpaid mobile data plan. Individuals with a personal income level of more than 10 minimum wages have a 22.66 p.p. lower probability of having a prepaid plan. Education is a less powerful explanatory variable compared to income. The second and third educational category show no statistically significant difference with respect to the reference group and individuals with higher education 'only' present a marginal effect of 3.78 p.p. Similar observations for these variables regarding internet access are made with Brazilian data by Nishijima et al. (2017) and Coelho et al. (2019).
Brazil is among the most unequal countries in the world and social mobility is relatively low. Women and Non-white citizens have worse salaries, even after controlling for other socio-economic characteristics (Mariano et al. 2018). We thus expect skin color/race to be related to mobile data plan selection, too. The data show that non-white individuals have comparable but significantly (2.5 p.p.) higher probability of choosing a prepaid plan. For indigenous citizens the marginal probability is even as high as 4.7 p.p.
In relation to the location where the individual used to access the internet, table 5 shows that usage at home, at work and 'on the move' is associated with a 4-5 p.p. lower probability of having a prepaid plan. The omitted categories comprise 'other locations' and free access public and private alternatives. This finding is reasonable given that postpaid data plans provide a larger amount of data allowance and usually include some zero-rating applications such as media content and chat apps which allows users to access the internet in a larger variety of places. Finally, the two digital skills variables that made it the top 20 variable selection are 'book travel or accommodation' and 'use maps'. Using the internet for these services is associated with a 3.4 p.p. lower probability of using a prepaid mobile data plan. Again, the intuition behind this observations seems to be that heavy internet users with advanced skills and needs opt for the potent postpaid plans.
## V. CONCLUSION
This research used microdata from the Brazilian ICT Household Survey in 2014- 2018 and applied Machine Learning techniques to identify the variables with the highest explanatory power among a pool of 67 variables to explain how to increase internet access via mobile devices and how to predict the type of mobile data plans individuals chose. The variables compass frequently studies socio-economic characteristics, year fixed effects, location and device of internet access, as well as operational, communication, and information seeking skills. Having selected the most important variables via Elastic Net regularization method, we estimate their marginal effects and differences in predicted probabilities regarding each of the two dependent variables.
We find that age, income, and education have predictive power for access to internet via cell phone and particularly for the type of mobile plan. Some of individuals' skills/ICT activities are also among the variables with high predictive power, especially for mobile internet access. Finally, effects that are specific for a year, such as the business cycle or technological progress are also highly important predictors for individual's mobile internet usage patterns.
The differences between the two models lead to some interesting insights and implications. The fact that socio-economic status, and personal income above all, are much better predictors for having a cheaper, more limited prepaid mobile data plan but nor for mobile internet access in general, indicates that the digital divide with respect to these characteristics is becoming more narrow. However, age still seems to be the predominant dimension that prevents a sustainable reduction in the digital divide. The cohort aged 60 years or older, specifically, is estimated to have a 6.4 p.p. lower probability of accessing internet via mobile phone as compared to 10 to 15 year old children, which are the most likely users.
Another encouraging observation is the increasing trend both regarding the use mobile internet and postpaid data plans, even after controlling for other variables such as income. However, we also perceive that the recession during the years 2014-2016 temporary hindered the expansion of internet access via cell phones. State-sponsored access to internet and the necessary devices for socially disadvantages families or school children may help to bridge the digital divide such that further economic and social sustainability can be reached.
The relatively low predictive power of specific skills and activities is rather surprising. Hence, an insight from our research may be that operational skills, and the lack thereof, do not seem to constitute major barriers for people to adopt a cell phone with internet access. Future studies, however, should investigate this question more in depth. Among the few variables that turned out to be relevant for internet access via cell phone are sending text messages using social media. These skills/activities seem to be predominant on this type of device whereas regarding other activities, the phone seems to have closer substitutes.
We hope that the present results will serve as a foundation for supporting public policies in the telecommunication sector. This area lacks well-designed evaluations and implementation of public policies. A prominent example is the Universalization Fund for Telecommunications Services (Fust). The fund was created in 2000 with the mission of reducing regional and social inequality, i.e. accelerating the universal- zation of telecommunication services in Brazil. During the Fust's 22 years of existence it has collected several billions, but not a single Brazilian Real was actually spent (Reis and Ehrl 2023). Our research shows which groups should be targeted by policies that intend to promote sustainable, universal internet access and equal opportunities in the digital society.
Author Contributions: Conceptualization, PE., T.C.S. and F.C.C.; Methodology, PE., T.C.S. and F.C.C.; Software, PE., T.C.S. and F.C.C.; Validation, PE., T.C.S. and F.C.C.; Formal analysis, PE., T.C.S. and F.C.C.; Investigation, PE. and F.C.C.; Data curation, F.C.C.; Writing—original draft, PE. and F.C.C.; Writing—review & editing, PE.; Supervision: PE. and T.C.S.; All authors have read and agreed to the published version of the manuscript.
Funding: FAP-DF grant no. 00193-00000143/2024-41.
Institutional Review Board Statement: Not applicable.
Informed Consent Statement: Not applicable.
Data Availability Statement: The data is owned by NIC.br and can be accessed through the Regional Center for Studies for the Development of the Information Society (Cetic.br). The authors do not have the permission to share the data.
Conflicts of Interest: The authors declare no conflict of interest.
This paper applies the Elastic Net Machine Learning technique to choose the variables that best represent the characteristics of mobile internet use in Brazil. We use regularized models to estimate the importance of a large number of variables, including socioeconomic attributes, internet and device utilization patterns, and digital skills to explain (a) access to the internet through mobile devices and (b) choice of mobile data plan. After identifying the most important variables, we estimate their marginal effects on the two dependent variables with nonlinear econometric models. The results suggest that socioeconomic characteristics and user skills have significant explanatory power in both estimations. Specifically, barriers such as age, income, and skill gaps persist, hindering inclusive mobile internet adoption. Conditional on mobile internet use, these characteristics are more common among postpaid internet data plan subscribers. Moreover, communication skills like messaging and social media use stand out regarding internet access, whereas internet utilization patterns (on the move and at work) have high explanatory power in the data plan choice.
Our website is actively being updated, and changes may occur frequently. Please clear your browser cache if needed. For feedback or error reporting, please email [email protected]
×
This Page is Under Development
We are currently updating this article page for a better experience.
Thank you for connecting with us. We will respond to you shortly.